

SUMMARY
The fate of disseminated tumor cells is largely determined by microenvironment (ME) niche. The osteogenic niche promotes cancer cell proliferation and bone metastasis progression. We investigated the underlying mechanisms using pre-clinical models and analyses of clinical data. We discovered that the osteogenic niche serves as a calcium (Ca) reservoir for cancer cells through gap junction (GJs). Cancer cells cannot efficiently absorb Ca from ME, but depend on osteogenic cells to increase intracellular Ca concentration. The Ca signaling, together with previously identified mTOR signaling, promotes bone metastasis progression. Interestingly, effective inhibition of these pathways can be achieved by danusertib, or combination of everolimus and arsenic trioxide, which provide possibilities of eliminating bone micrometastases (BMM) using clinically established drugs.
Graphical Abstract
INTRODUCTION
In breast cancer (BCa), spread of tumor cells may occur before diagnosis (Huang et al., 2013). The resultant metastatic seeds in distant organs are left behind by surgeries, survive adjuvant therapies, enter and then exit a presumable dormancy/latency state, and eventually resume aggressive outgrowth (Massagué and Obenauf, 2016). Bone is the most frequently affected organ by BCa metastasis (Kennecke et al., 2010; Smid et al., 2008), and often the first site of metastasis, especially after long latency (Zhang et al., 2013a).
In the clinic, bone metastases are usually diagnosed with significant skeletal-related events (Ell and Kang, 2012; Weilbaecher et al., 2011). At this stage, metastases are driven by a vicious cycle between cancer cells and osteoclasts (Boyce et al., 1999; Kang et al., 2003). Targeting osteoclasts by bisphosphonates and denosumab, can limit metastasis progression but cannot extend overall survival (Mackiewicz-Wysocka et al., 2012). Several molecular pathways have been implicated in the vicious cycle, including Notch (Sethi et al., 2011), TGFβ (Fournier et al., 2015; Waning et al., 2015), integrin (Ross et al., 2017) and IL-6 (Luo et al., 2016). These discoveries have significantly enriched the options of treating overt bone metastases.
Relatively less is known about early-stage bone colonization before the vicious cycle occurs. Disseminated tumor cells (DTCs) in the bone marrow are associated with poor survival of patients, suggesting that they are precursors of late, overt metastases (Wan et al., 2013). Specific ME niches have been implicated to determine DTC fate. In particular, the peri-vascular niche regulates dormancy of DTCs (Ghajar et al., 2013; Price et al., 2016), whereas the osteogenic niche promotes BMM proliferation and progression (Wang et al., 2015) and resistance to chemotherapies (Zheng et al., 2017). However, molecular mechanisms behind cancer-niche crosstalk are largely elusive, and need to be elucidated for eradication of DTCs and BMM.
Our previous studies demonstrate that cancer cells and osteogenic cells (osteoblasts and their precursors) can form heterotypic adherens junctions (hAJs), which in turn activate the mTOR signaling to promote BMM progression (Wang et al., 2015). mTOR inhibitors were approved by FDA to treat endocrine-resistant estrogen receptor alpha-positive (ER+) tumors (Baselga et al., 2012). The treatment significantly delayed tumor progression, but failed to extend overall survival. We hypothesize that there are additional pathways that may cooperate with the mTOR signaling to mediate osteogenic niche’s metastasis-promoting effects.
RESULTS
Transcription factor (TF) activities downstream of Ca signaling are enriched in bone metastases
To understand how the bone ME may affect signaling pathways in cancer cells, we conducted an unbiased comparison to identify TFs with differential activities between bone and other metastases of BCa in a published dataset (GSE14020) (Zhang et al., 2013b). We utilized Gene Set Variation Analysis (GSVA) (Hänzelmann et al., 2013) and focused on TF target gene sets defined by binding motifs in promoter regions. (Subramanian et al., 2005). We identified the top 5% of TFs whose activities are enriched in bone metastases. These include NFAT and MEF2, which are both downstream of Ca signaling (Figure 1A and S1A) (Berridge et al., 2003; Macian, 2005; McKinsey et al., 2002). This finding was validated by a different approach and independent NFAT and MEF2 signatures (Di Giorgio et al., 2017; Tripathi et al., 2014) (Figure 1B-C). Moreover, activation of Ca signaling is associated with epigenomic reprogramming (Raynal et al., 2016). We asked if any epigenetic modulator is differentially expressed in bone metastases. MeCP2 is a nuclear protein that binds methylated DNA and recruits other factors such as histone deacetylases, acting as a transcriptional repressor (Shahbazian et al., 2002). Ca signaling triggers the CaMKII-dependent MeCP2 phosphorylation (S421), and releases MeCP2 from silenced promotors in various cellular contexts (Buchthal et al., 2012; Li et al., 2014). Consistently, the alteration of MECP2 expression displayed a trend opposite to that of NFAT and MEF2 – it is expressed at a lower level in bone metastasis than in other sites (Figure 1D). Due to the availability of high-quality antibodies, the expression level and localization of MeCP2 may serve as an indicator of Ca signaling in vivo.
Figure 1. Ca signaling is enriched in bone metastasis compared to metastases in other organs.

(A) An overview of bioinformatics analysis leading to Ca signaling. GSVA: Gene Set variation analysis. FDR: False discovery rate. Both p values and FDR were computed by the Statistics of Microarray (SAM) algorithm. MSigDB C3 transcription factor targets (TFT) database was analyzed.
(B-D) Boxplots show the expression of a NFAT signature (B), an MEF2 signature (C), and MECP2 (D) across human BCa metastases in different organs (GSE14020).
E. Similar to B-D, except that human PCa metastases (GSE77930) is examined.
(B-E): p values by one-way ANOVA.
For all boxplots: line inside the box: median value; top/bottom of the box: 75th/25th percentile; upper/lower whiskers: largest/smallest values no further than 1.5 × inter-quartile range from the hinge; data points beyond whiskers: possible outliers. Same for the boxplots in other figures. See also Figure S1.
In another dataset of BCa metastases (GSE46141), similar differences in NFAT, MEF2 and MECP2 expression were observed between bone and visceral metastases, although statistical significance was not achieved due to smaller sample size (Figure S1B). Moreover, in a cohort of 615 primary BCa (Zhang et al., 2009), the NFAT signature appeared to be associated with bone metastasis-free survival, but not with lung or brain metastasis-free survival (Figure S1C).
Prostate cancer (PCa) is another cancer type that frequently metastasizes to bone. In a dataset of prostate cancer metastases in different organs (GSE77930) (Kumar et al., 2016), we observed a significant increase of expression of NFAT and MEF2 signatures, and a dramatic decrease of MECP2 expression (Figure 1E) in bone metastases compared to other sites.
In vivo and ex vivo bone metastasis models recapitulate Ca signaling alterations in cancer cells.
We previously established in vivo models based on intra-iliac artery (IIA) injection and in vitro 3D co-culture of cancer cells and osteogenic cells (including osteoblasts [OBs] and mesenchymal stem cells [MSCs]). These models allow us to investigate how BCa cells interact with bone cells and initiate the colonization (Wang et al., 2015; Yu et al., 2016)
In our in vivo model, bone lesions introduced by IIA injection of MCF7 cells exhibited diminished immunofluoresence (IF) MeCP2 staining as compared to orthotopic tumors established by the same cells using mammary fat pad injection (Figure 2A). Transcriptomic profiling (GSE110451, Figure S2A) indicated up-regulation of NFAT and MEF2 transcription activities and down-regulation of MECP2 expression at RNA level in the bone lesions as compared to orthotopic tumors (Figure 2B). Thus, IIA-based bone metastasis models recapitulate the observations in clinical datasets.
Figure 2. Experimental models recapitulate the enhancement of Ca signaling in cancer cells interacting with the bone ME.

(A) Representative IF staining of MeCP2 in orthotopic tumors and bone lesions. Keratin 8 (K8) marks cancer cell cytoplasm; DAPI marks nucleus; translocalization is highlighted by single channel images; Scale bar, 25 µm.
(B) Boxplots show the expression of the NFAT signature, the MEF2 signature and MECP2 in in vivo bone lesions (IVBL, n=8) or orthotopic tumors (Orth, n=7) derived from MCF7 cells.
(C) IF staining of NFAT is shown in mammospheres of MCF7 cells alone or heterotypic organoids of admixed MSCs and MCF7 cells to mimic bone ME. Scale bar, 25 µm.
(D) Western blot of indicated (phospho-)proteins in 3D cultures of cancer cells or OBs either alone or admixed. The slight shift between phosphor-NFAT (pNFAT) or non-phosphor-NFAT (npNFAT) is highlighted by altering the display width/length ratio of the gel shown as an additional row.
(E) Similar to (C) except that MeCP2 staining is shown.
(F) Western blot shows total (TP) or S421-phosphorylated MeCP2 in MCF7 cells with or without MSCs in 3D co-cultures. Firefly luciferase (Fluc) was used as loading control for cancer cells.
Samples of (C-F) were harvested after mono- or co-culture for 48 hr.
(G) A schematic illustration of BICA platform.
(H) Bioluminescence intensity (BL) in BICA of MCF7 cells expressing empty vector, dominant negative CaN (DN-CaN), dominant negative CaMKII (DN-CaMKII), and both (DN-CaN+DN-CaMKII). n=12 bone fragment for each group.
(I) Similar to (H) except that prostate cancer cell lines C4-2 and 22Rv1 were used.
(J) Bone colonization curves of IIA-injected MCF7 cells, either expressing empty vector or DN-CaN+DN-CaMKII. n=6 and 7 for the two groups, respectively.
(K) Represented BL pictures of mice in the vector and DN-CaN+DN-CaMKII (DN) groups.
(L) Quantitation of ex vivo BL signals emitted from extracted hind limb bones. Representative pictures are shown.
(M) Representative IHC staining of bone lesions derived from (J). Tumor lesions were indicated by K8 (brown) staining. Scale bar, 100 µm.
p values by one-way ANOVA (B), LSD (H), Student’s t tests (I, and L) or repeated measures ANOVA test (J). Error bars = S.D.(H, I, L) or S.E.M.(J)
See also Figure S2.
In vitro 3D co-culture of cancer cells and osteogenic cells is a further simplified model that focuses on osteogenic cells only. Cancer cells and osteogenic cells form heterotypic organoids after 48 hours, causing an increase of cancer cell proliferation and survival as we previous showed (Wang et al., 2015). The interaction with osteogenic cells led to an increase of NFAT IF signal intensity in nuclear, indicating nuclear trans-localization of NFAT (Figure 2C, of note, NFAT antibodies did not work well on decalcified tissues, preventing application to in vivo bone tissues). NFAT subcellular localization is regulated by dephosphorylation (Sharma et al., 2011), and can be reflected by a slight but obvious gel-shift on western blot (Figure 2D). By IF, MeCP2 appeared to follow an opposite trend upon the interaction with osteogenic cells – its signal intensity increases in cytoplasm but decreases in nucleus. The overall intensity also appeared to decrease (Figure 2E). This indicates trans-localization from nucleus to cytoplasm as well as an overall reduction at the protein level. Western blot again confirmed this change, and in addition revealed an increase of phosphorylation of MeCP2 at S421 (Figure 2F), a regulatory modification leading to nuclear exportation (Buchthal et al., 2012). Because the osteogenic cell lines express little NFAT or MeCP2 (Figure 2D, 2E and S2B), the alterations seen in western blots were likely to occur in cancer cells. To further validate this point, we used murine osteogenic cells so that gene expression in human cells can be assessed by qPCR with human-specific primers. As expected, both the 8-gene NFAT signature (Tripathi et al., 2014) as well as MECP2 exhibited expected changes (Figure S2C). Thus, the major ME factor that drives the alteration of Ca signaling in cancer cells appears to be the direct interaction with osteogenic cells.
Inhibition of Ca signaling impedes bone colonization.
Ca signaling involves transducers such as CaMKII and calcineurin (CaN), and transcription factors such as NFAT and MEF2, all of which are encoded by multiple genes, making genetic depletion difficult. Instead, we tested pharmacological inhibitors of CaN (FK506) and CaMKII (Kn93). Both reduced MeCP2 phosphorylation and NFAT de-phosphorylation (Figure S2D), and abolished the tumor-promoting effects of osteogenic cells in 3D co-cultures (Figure S2E).
We also employed the bone-in-culture array (BICA) to examine the role of Ca signaling in bone colonization. Specifically, bone tissues harboring IIA-introduced cancer cells are fragmented to generate a number of ex vivo bone segments (Figure 2G). We showed previously that cancer-bone interaction maintains in BICA for up to 4-6 weeks, and allows multiplex treatments (Wang et al., 2017). As another way to overcome paralog redundancy, we employed dominant negative (DN) CaN (∆ H160Q) (Shibasaki et al., 1996) and CAMKII (T286A) (Pi et al., 2010). DN-CaN and DN-CAMKII, alone or in combination, showed moderate effect on tumor proliferation in vitro (Figure S2F) but dramatic decrease of growth of BCa and PCa in BICA (Figure 2H-2I).
Finally, IIA-injected MCF7 cells expressing both DN-CaN and DN-CAMKII, compared to control cells, exhibited remarkably reduced bone colonization (Figure 2J-M). The same trend was observed on PCa cells: IIA injection of C4-2 cells generated detectable bone lesions in 4 of 7 mice in six weeks, whereas no lesions was detected when DN-CaN and DN-CAMKII were expressed (Figure S2G).
Osteogenic cells boost Ca concentration in cancer cells.
We examined alterations of steady-state intracellular Ca concentration ([Ca2+]) of cancer cells. Classic approaches such as patch-clamp or microfluorometry (e.g., Fura2) (Ishikawa et al., 2011) were not applicable, as they could not distinguish different cell types in the co-culture system. As an alternative, we transduced MCF7 cells with GCaMP, a genetically encoded [Ca2+] indicator (Chen et al., 2013). MCF7 cells appeared to have limited ability to absorb Ca directly from medium, as GCaMP intensity only increased moderately when 2 mM Ca2+ was added to medium (Figure 3A). In the Ca2+-free medium, when human fetal OBs were added, cancer cell [Ca2+] increased to a degree comparable to 2 mM Ca2+ medium (Figure 3A). A dramatic increase was observed when both OBs and 2 mM Ca2+ were combined (Figure 3A). This observation suggested that, compared to cancer cells, OBs are more efficient in absorbing Ca from environment and may in turn provide Ca to cancer cells.
Figure 3. Ca2+ flows from osteogenic cells to cancer cells.

(A) A schema of MCF7-OB co-culture assay with GCaMP indicating alteration of [Ca2+] in cancer cells (left) and representative intensity curves of GCaMP under the indicated four conditions (right).
(B) GCaMP intensity in MCF7 cells (alone or co-cultured with indicated cell types) as a function of different cell types in co-cultures and medium [Ca2+]. Bars show GCaMP intensity in MCF7 cells in medium with [Ca2+]=0 mM (solid) or [Ca2+]=2 mM (hashed). MSC: mesenchymal stem cells.
(C) Fold change (FC) of MCF7 cell quantity in 3D co-cultures with indicated cell types as compared to MCF7 alone. MCF7 cells were quantitated by BL. Error bars = S.D. (n=3 technical replicates).
(D) A scatter plot shows the correlation between increase of [Ca2+] as indicated by changes of median GCaMP intensity (MGI) and the FC of MCF7 cells in co-cultures.
In (B-D): RAW: RAW264.7 cells, osteoclast precursors. dU937: differentiated U937 cells, osteoclasts. HMF: human mammary fibroblast cells. 3T3: NIH3T3 cells, mouse embryo fibroblasts.
Pearson correlation coefficient and p value (by Student’s t test) are shown.
See also Figure S3.
To ask if this property is unique to OBs, we tested other cell types including MSCs, fibroblasts, osteoclasts, and astrocytes (Figure 3B and S3). These cells conferred variable degrees of growth advantages, but only MSCs appear to have a similar, Ca2+-related effect, highlighting that the “Ca provider” function may be specific to osteogenic cells (OBs and MSCs) (Figure 3C). Overall, the fold changes of growth are correlative with the ability of these cells to boost [Ca2+] in cancer cells (Figure 3D), indicating that the ability of increase [Ca2+] in cancer cells is one mechanism among others to enhance tumor progression.
Ca2+ flows from osteogenic cells to cancer cells via gap junctions (GJs).
Osteogenic cells may increase cancer cell [Ca2+] by a few possible mechanisms. They may release Ca2+ to medium, which in turn enters cancer cells through various Ca channels or receptors (Berridge et al., 2003; Dubois et al., 2014). Alternatively, Ca2+ may directly flow between cells via GJs (Osswald et al., 2015). We employed inhibitors targeting these mechanisms and asked whether they could reverse the observed [Ca2+] change. Inhibitors of voltage-sensitive Ca channel, store-operated Ca entry, and receptor-operated Ca entry, Nifedipine (NIFE) or SKF96365, (Wu et al., 2015) could not stop [Ca2+] increase in cancer cells (Figure 4A). In contrast, a GJ inhibitor, Carbenoxolone (CBX), almost completely blocked the Ca2+ flow (Figure 4A). Consistently, CBX and another GJ inhibitor, mefloquine (MEFL), but not NIFE or SKF96365, suppress OB-induced growth of cancer cells in co-cultures (Figure 4B). ORAI proteins play important roles in prostate tumorigenesis by mediating store-independent Ca2+ entry (Dubois et al., 2014). ORAI1 and ORAI3 expression do not correlate significantly with BCa bone metastasis (Figure S4A-B), suggesting that ORAI channels might not play roles in later metastasis after initial tumorigenesis.
Figure 4. GJ mediates the Ca2+ flow from osteogenic cells to cancer cells.

(A) A schema of experiment design and key reagents and molecules (left) and the alteration of median GCaMP intensity by co-cultured OBs as a function of treatment of various inhibitors (right). The co-culture was performed in Ca2+-free medium. GJ: GJ. VSCC: voltage-sensitive Ca channel; SOCE: store-operated Ca entry; ROCE: receptor-operated Ca entry; CBX: carbenoxolone; MEFL: mefloquine; NIFE: nifedipine; SKF: SKF96365; Veh: vehicle control; MGI: Median GCaMP intensity.
(B) Fold change (FC) of MCF7 quantity, quantitated by BL, in the same experiment as (A). Error bars = S.D. (n=3 per group). p value by one-way ANOVA.
(C) Changes of GCaMP intensity in MCF7 cells (left) and OBs (right) in monocultures, co-cultures, and co-cultures with 10 μM CBX. Data are based on two separate experiments: GCaMP+ MCF7 + GCaMP− OB, and GCaMP+ OB + GCaMP− MCF
(D) Western blot of indicated (phosphor-)proteins in MCF7 cells with or without 10 µM CBX treatment after mono- or coculture for 4 hr. The gel-shift of NFAT1 is highlighted in additional rows.
(E) Expression of NFAT target gene set, MEF2 target gene set, and MECP2 in fibroblasts, MSCs and myoepithelial cells when they are co-cultured with various cancer cell lines. GSVA scores were calculated for NFAT and MEF2 target gene sets and re-scaled linearly between 0-1. Analyses were based on GSE27120. p: by Student’s t tests between indicated groups. *p: by one-way ANOVA across all groups.
(F and G) Calcein transfer through GJs in co-culture of MCF7 cells and OBs in the absence (F) and presence (G) of 10 µM CBX. Negative control (no calcein) was indicated by grey area. The direction of transfer and percent positive recipient cells are indicated.
See also Figure S4.
Direct flow of Ca2+ toward cancer cells may lead to depletion of Ca2+ in osteogenic cells. By expressing GCaMP in OBs, we observed a decrease of [Ca2+] in these cells upon the establishment of cancer-bone interaction. This change in OBs, as well as the activation of Ca signaling in cancer cells, was abolished by CBX (Figure 4C-D). The reciprocal decrease of [Ca2+] in osteogenic cells is also reflected by transcription. Analysis of patient-derived MSCs, fibroblasts, and myoepithelial cells revealed decreases of NFAT and MEF2 signatures and an increase of MECP2 in MSCs when co-cultured with several cancer cell lines (GSE29036) (Figure 4E). These differences are less pronounced in fibroblasts and insignificant in myoepithelial cells (Figure 4E). Thus, the Ca2+ flow is specific between cancer cells and osteogenic cells, leading to increased Ca signaling in cancer cells but decreased Ca signaling in osteogenic cells (Figure S4C).
The GJ mediates bidirectional substance transfer.
To assess the general directionality of the GJs between cancer cells and osteogenic cells, we incubated either cell type with calcein, a fluorescence dye that can diffuse through GJs, before setting up the 3D co-cultures. This experiment uncovered different efficiencies of heterotypic and homotypic GJs, with most efficient dye-transfer between osteogenic cells (Figure 4F, S4D). OBs and osteocytes are known to connect with one another with GJs to form a cellular network, which is an essential characteristic of bone tissue (Jiang et al., 2007). Calcein transfer was also detected between cancer cells, as well as between cancer cells and osteogenic cells in a bidirectional manner (Figure 4F and S4D). The transfer of calcein from osteogenic cells to cancer cells can be blocked by CBX (Figure 4G, S4E). These results suggest that the GJs between cancer cells and osteogenic cells are bidirectional . The apparently unidirectional flow of Ca2+ is likely driven by concentration gradient.
Connexin 43 (Cx43) is overexpressed in bone metastasis and correlates with Ca signaling in clinical samples.
The connexin family proteins are the major constituents of GJs. Particularly in bone, osteocytes and OBs are widely connected by GJs composed of Cx43 (Plotkin and Bellido, 2013). We asked if bone metastatic cells also express Cx43. IIA-injected MCF7 cells exhibited positive Cx43 staining at cancer-bone interface (Figure 5A). The expression level of Cx43 (encoded by GJA1) in cancer cells is significantly higher in bone lesions as compared to in orthotopic tumors (Figure 5B). Co-culture with MSCs induced expression of Cx43 in multiple cancer cell lines (Figure 5C). Furthermore, the Ca transfer appears to be particularly significant between cancer cells and MSCs, as compared to fibroblasts and myoepithelial cells (Figure 4E). This trend is correlative to the expression of Cx43 in these stromal cells (Figure S5A).
Figure 5. Connexin 43 (Cx43) is the major constituent of GJ.

(A) IF co-staining of K8 and Cx43 (left) or K8 and ALP (OBs, right) in sequential sections of a microscopic bone lesion derived from IIA-injected MCF7 cells. Arrows in high magnification pictures indicate punctuated Cx43 staining. Scale bar, 10 µm.
(B) Normalized expression of GJA1 in bone lesions versus orthotopic tumors (GSE110451). p value by Student’s t test.
(C) A heatmap (left) showing the expression level difference of genes encoding connexin family proteins in five breast cancer cell lines and human mammary epithelial cells (HMEC) upon co-culture with OBs (GSE29036) and the paired Cx43 expression (right) between mono- and co-cultures of these cells. p value by paired t test.
(D) The expression of GJA1 across BCa metastases in different organs (GSE14020, top) and in bone and brain metastases divided based on ER and Her2 statuses (bottom). Sample size of each group is shown in parentheses. p value by one-way ANOVA.
(E) Similar to (D) except that human PCa metastases (GSE77930) is examined
(F) Scatter plots showing the correlations between GJA1 expression and the NFAT signature, the MEF2 signature, and MECP2 expression in bone metastases of BCa and PCa. All values were linearly re-scaled to between 0 and 1. Pearson correlation coefficients and p values by Student’s t tests are shown.
See also Figure S5.
In clinical data, bone metastasis exhibited the highest level of Cx43 expression among all sites of metastases of both BCa and PCa (Figure 5D and 5E). Cx43 expression in primary tumor is associated with bone metastasis-free survival (Figure S5B). Cx43 GJs play important roles in brain colonization in triple negative (TN) breast cancer (Chen et al., 2016). By separating metastases based on ER, PR, and Her2 expression, we confirmed that all subtypes of bone metastases and TN brain metastases overexpress Cx43 (Figure 5D). Among bone metastases of BCa and PCa, Cx43 expression positively correlate with NFAT and MEF2 signatures, and negatively correlate with MECP2 (Figure 5F). These correlations are weaker among metastases at other sites (Figure S5C), indicating that the connection between GJs and Ca signaling may be particularly strong in the bone ME.
Inhibition of GJs suppresses bone colonization.
In 3D co-culture, siRNA-mediated knockdown of Cx43 in cancer cells or in OBs impeded the growth of MCF7 cells (Figure S6A). Overexpression of dominant negative Cx43 (G138R, DN-Cx43) (Roscoe et al., 2005), but not wild-type Cx43 (WT-Cx43), could achieve similar effects (Figure S6B). The same observations were also made in murine BCa cells (Figure S6C).
In BICA, we found that ablation of Cx43 in either osteogenic cells or cancer cells, using cancer cells expressing dominant negative Cx43 (DN-Cx43) or bone fragments derived from hosts with conditional knockout of Gja1, hindered bone colonization (Figure 6A-6C, S6D-S6F). Similar effects were observed when murine 4T1 cells were treated by CBX in BICA (Figure S6G). We previously reported that development of E-cadherin and N-cadherin hAJs promotes early bone colonization (Wang et al., 2015). Indeed, ablation of hAJs, either by knockout of Cdh2, encoding N-cadherin, in bone or knockdown of E-cadherin in cancer cells, causes reduced cancer growth in BICA (Figure S6E and S6F). It is well established that formation of adherens junctions precedes and facilitates GJ development (Jiang et al., 2007; Shaw et al., 2007). Our data support this notion and indicate that both AJs and GJs mediate cancer-niche interaction.
Figure 6. Inhibition of Cx43 and GJs retarded bone colonization.

(A and B) The effect of erexpressing DN-Cx43 on MCF7 (A) and C4-2 (B) cell growth in BICA. n=12 bone fragment for each group. Representative BL images are shown on the right. p value by Student’s t test.
(C) The effect of inducible condition knockout (KO) of Gja1 in Osx+ lineage cells on MCF7 cell growth in BICA. The experimental group, Osx1-GFP::Cre;Gja1f/f (Osx1-cre;Gja1f/f) animals with doxycycline withdrawn (KO induced), are compared to control groups, Osx1-GFP::Cre (Osx1-cre) and Osx1-GFP::Cre;Gja1f/f on doxycycline. n=16 for each group. Representative BL images are shown on the right. p value by one-way ANOVA.
(D) A schematic illustration of experiments assessing the effects of inducible overexpression of WT-Cx43 or DN-Cx43 on bone colonization.
(E) Growth curves of IIA-injected MCF7 cells with indicated genetic perturbation in hind limbs. Error bars = S.E.M. n=5 for each group. p value by repeated measures ANOVA test across three groups. Representative BL images are shown on the right.
(F) Normalized, log2-transformed BL intensity of hind limb bones extracted from the three groups described in (D) and (E). p value by LSD test.
(G) A schematic illustration of experiments assessing the effects of CBX/MEFL treatment on bone colonization of MCF7 cells.
(H) Growth curves of IIA-injected MCF7 cells in hind limbs. CBX or MEFL treatment last for 4 weeks as indicated by the arrow. Error bars = S.E.M. n=5 for each group. p value by repeated measures ANOVA test across three groups. Representative BL images are shown on the right. Veh: vehicle.
(I) BL intensity of hind limb bones extracted from the three groups described in (G) and (H). p value by LSD test.
(J) A schematic illustration of experiments assessing the effects of CBX treatment on spontaneous bone metastasis of 4T1.2 cells.
(K) Representative BL images of spontaneous metastases two weeks after orthotopic tumor resection.
(L) BL intensity of hind limbs and lungs extracted from control and CBX-treated animals. n=7 for each group. p values by Student’s t tests.
Error bars = S.D. except (E) and (H). See also Figure S6.
Several in vivo experiments were also conducted to tackle GJs in bone colonization. Firstly, compared to control cells, DN-Cx43-expressing MCF7 cells exhibited significantly delayed bone colonization after IIA injection, opposite to the wild-type Cx43 (Figure 6D-6F). Secondly, treatment of GJ inhibitors, MEFL or CBX, significantly delayed bone colonization of IIA-injected MCF7 cells (Figure 6G-6I and S6H). CBX treatment caused nuclear localization of MeCP2 in bone lesions (Figure S6I), suggesting reduced Ca signaling. Thirdly, 4T1.2 cells were orthotopically transplanted into syngeneic Balb/c mice, and orthotopic tumors were resected once reaching certain size. The following adjuvant CBX significantly reduced spontaneous bone metastasis, but had little effects on metastases in lungs and other organs (Figure 6J-6L). Taken together, these data strongly support the role of GJs in bone colonization.
Side effects of GJ inhibitors and high effective dosage of Ca signaling inhibitors prompted need for alternative therapeutic strategies.
Long-term CBX treatment led to an increased vertebral curvature and consequently a reduced length from head to tail (Figure S7A). This is not surprising given the important roles of GJs in normal bone development and homeostasis (Jiang et al., 2007). Thus, global GJs may not be an ideal target for chronic treatment. Ca2+ appeared to flow unidirectionally from osteogenic cells to cancer cells. The activation of Ca signaling is specific to cancer cells and may represent a more suitable target. Inhibitors, such as FK506 and Kn93, affected cancer cell growth in the bone ME only at micromolar concentrations (Figure S7B), which renders it unrealistic to be applied in vivo. The mTOR signaling, also contributes to promote bone colonization (Wang et al., 2015). We therefore conducted a mini-screening to identify agents that can inhibit bone colonization, preferentially through inhibition of Ca signaling and/or mTOR signaling at clinically relevant dosage.
BICA screening identified As2O3 and danusertib that preferentially target cancer cells in the bone ME.
We previously performed a BICA-screening on a library of 60 small molecule epigenetic modulators (Wang et al., 2017). This screening led to identification of danusertib, a pan-aurora kinase inhibitor with bone metastasis-selective efficacies. Here, we performed another screening on a library containing 66 FDA- or foreign-approved anti-neoplasm drugs selected from John Hopkins University Clinical Compound Libraries (JH library, see Table S1), in order for potentially rapid drug repositioning. Two rounds of tests were conducted (Figure 7A), leading to the identification of arsenic trioxide (As2O3) (Figure S7C and S7D), which displayed a comparable efficacy to danusertib (Figure 7B). This effect appears to be bone-preferential: the IC50 of As2O3 is reduced by 10 and 1000 fold in BICA as compared to 2D culture of cancer cells alone for MCF7 and C4-2 cells (Figure 7C). We validated that, like danusertib, As2O3 treatment significantly decreased spontaneous bone metastasis in the syngeneic 4T1.2 model when applied after orthotopic tumor resection (Figure 7D). This did not appear to be a general anti-tumor effect, as the same dosage had no effects on orthotopic tumor growth (Figure S7E).
Figure 7. BICA-screening identified As2O3 and danusertib as candidate therapies to eliminate cancer cells interacting with osteoblasts.

(A) Schematic pipeline of multiplex drug tests using BICA.
(B) Heatmaps showing the efficacies of As2O3 [100 nM] and danusertib [100 nM] on MCF7 and MDA-MB-361 cells in BICA. The color scale is based on proportion of proliferation (−1=100% cell number increase) and inhibition (1=100% cell number decrease). p value by LSD test.
(C) Efficacies of As2O3 on indicated cancer cells as a function of dosage in 2D culture or BICA . BL intensity was measured on Week 2-3. Mean values of 6 bone pieces are shown for each dot. p value by repeated measures ANOVA test.
(D) Efficacies of As2O3 [1.9 mg/kg] and danusertib [15 mg/kg] on spontaneous bone metastasis of 4T1.2 cells in syngeneic hosts. Treatment started immediately after orthotopic tumor resection. n=8 for each group. p value by one-way ANOVA test. Error bar = S.D.
(E) Western blot shows the indicated (phosphor-)proteins under various (co-)cultures of MCF7 and MSCs, and treatment of 5 µM As2O3 or 100 nM danusertib. The gel-shift of NFAT is highlighted in an additional row.
(F) IF staining of MeCP2 in MCF7 bone lesions treated with vehicle, danusertib or As2O3. K8 indicates cancer cells. Single-channel image of MeCP2 highlights cytoplasm or nucleus localization. Scale bar, 25 µm.
(G) The effects of As2O3 or danusertib on [Ca2+] in MCF7-OB co-cultures as assessed by GCaMP intensity. The grey area indicates no-OB control. Alteration of median GCaMP intensity (∆MGI) was used to quantitate the difference and is shown as a bar graph on the right.
(H) “Volcano plot” showing gene expression alteration induced by As2O3 treatment in MCF7 co-cultured with MSCs. GJA1 is indicated.
(I) The effects of 5 µM As2O3 on relative GJA1 expression in cancer cells with or without co-culturing of murine MSCs, quantified by qPCR. GJA1 expression in mono-culture, vehicle treated MCF7 or MSC were normalized to 1. Log2-transformed fold change (FC) is plotted. Three biological replicates are included. p value by Student’s t tests. Error bar = S.D.
Veh: vehicle; Danu: danusertib. See also Figure S7 and Table S1.
As2O3 and danusertib both affect Ca signaling and GJs, but exhibit less side effects.
Since both mTOR and Ca signaling mediate early stage bone colonization, we asked whether the effects of As2O3 and danusertib on bone metastasis are mediated by these pathways. Indeed, both drugs appeared to increase NFAT phosphorylation and decrease MeCP2 phosphorylation in co-cultures (Figure 7E), and led an increase of nuclear MeCP2 in bone lesions (Figure 7F). Danusertib also decreased S6K phosphorylation, indicating a reduction of mTOR signaling (Figure 7E). Finally, both As2O3 and danusertib reduced GCaMP intensity in cancer cells in co-cultures (Figure 7G), indicating a decrease of [Ca2+].
Despite their effects on GJs, As2O3 and danusertib did not exhibit obvious side effects. They did not change mouse weight (Figure S7F). Nor did they affect normal bone cell viability in BICA (Figure S7G). One explanation is that these drugs preferentially affect GJs in cancer cells. Cx43 is upregulated when cancer cells are co-cultured with osteogenic cells. As2O3 or danusertib might inhibit this alteration, thereby preventing the formation of heterotypic GJs. For As2O3, this is indeed the case: GJA1 was one of the most down-regulated genes in MSC-interacting cancer cells upon As2O3 treatment (Figure 7H), which is consistent with a previous finding in leukemia (Chou et al., 2005). By qPCR, we confirmed that the treatment abolished the increase of Cx43 transcription in co-cultures whereas exhibited little effects on Cx43 expression in MSCs alone (Figure 7I). The diminished Cx43 expression was possibly due to the As2O3 -induced reactive oxygen species and oxidation of transcription factors Sp1 (Chou et al., 2005). ChIP assay confirmed that Sp1 binds to the GJA1 promoter, which was decreased in As2O3 -treated cells. (Figure S7H). Danusertib did not change Cx43 expression, and might use other mechanisms. Interestingly, aurora kinases, the targets of danusertib by design, can regulate the S421 phosphorylation of MeCP2, and thereby partially abolish the transcriptional output of Ca signaling (Figure 7E and 7F, Li et al., 2014).
As2O3 inhibits bone colonization via Ca signaling
As2O3 may affect many processes in cancer cells. We asked if the efficacies of As2O3 are mediated by the heterotypic GJs and Ca signaling. First, blockade of GJ by DN-Cx43 abolished the effects of As2O3 in BICA (Figure S8A). Overexpression of a constitutively active (CA) CaMKII mutant (T286D) (Pi et al., 2010) significantly increased resistance to As2O3 (Figure S8B) and CBX (Figure S8C) in BICA . Moreover, the doxycycline-induced expression of Cx43 also rescued As2O3 treatment (Figure S8C). To quantitate contribution of Ca signaling to the effects of As2O3 in the bone ME, we examined dose-response curves of cancer cells with or without expression constitutively active CaMKII (CA-CaMKII) in BICA (Figure S8D). CA-CaMKII expression increased IC50 of As2O3 by over 10-fold (p ≦ 0.001). More importantly, at a clinically relevant dosage (<0.28 µM, the median plasma arsenic maximum concentration of As2O3-treated patients at 0.15 mg/kg/day) (Fox et al., 2008), CA-CaMKII expression reverses most cell deaths caused by As2O3. Finally, expression of CA-CaMKII almost completely reversed the effects of As2O3 in bone colonization assays in vivo (Figure 8A). These results indicate that the efficacies of As2O3 are dependent, to a large extent, on GJ and Ca signaling.
Figure 8. Adjuvant transient As2O3 treatment of reduced latent bone recurrence of ER+ breast cancer.

(A) Quantification (left) and representative BL images (middle) of in vivo bone colonization kinetics of IIA-injected MCF7 cells expressing empty vectors or CA-CaMKII treated with vehicles or As2O3 (n=6 for each group) and quantitation and representative BL images (right) of BL intensity (normalized, log2-transformed) of extracted bones. p value by repeated measures ANOVA (left) or LSD test (right). Error bars = S.E.M.
(B) Growth curves of individual bone lesions in vehicle- and As2O3 groups (top) and Kaplan-Meier curves of the indicated groups (bottom). n= 10 for both groups. The arrow indicates duration of treatment. The end point is defined as the time point when hind limb signal intensity reaches half of the Day 0 value (Normalized bioL intensity > 0.5) and continues to increase at subsequent time points. p value by log-rank test.
(C) Growth curves of individual bone lesions in vehicle-, everolimus-, and combined As2O3 and everolimus -treated groups (top) and Kaplan-Meier curves of different groups with indicated treatments (bottom). n= 8 for each group. The arrow, end point and p value are defined as in (B).
(D) Top left: representative BL images showing high (H), median (M) and low (L) signals in each group. Top right: quantitation of BL intensity. Bottom: Representative IHC staining of bone lesions. Tumor lesions were indicated by K8 staining. Error bars = S.D. p value by LSD tests. Scale bar, 100 µm.
(E) µCT scanning of hind limb bones of tumor-free animal and representative animals in different treatment groups in (C) and (D). Bone mineral density values are shown below the images.
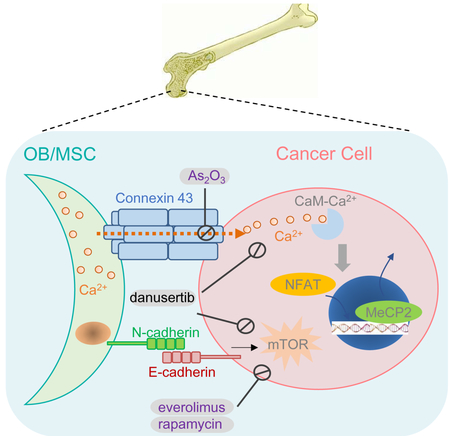
(F) Schematic model for interaction between osteogenic cells and cancer cells in bone colonization. FDA-approved drugs are indicated by purple font.
Veh: vehicle; Eve: everolimus. See also Figure S8.
Unlike As2O3, danusertib exerted additional inhibition on DN-Cx43 cells (Figure S8A). Correspondingly, CA-CaMKII only marginally rescued danusertib’s effects (Figure S8B), suggesting that danusertib may affect multiple downstream pathways besides Ca signaling (e.g. mTOR).
Transient As2O3 treatment reduced latent bone recurrence of ER+ breast cancer
The luminal subtype of BCa exhibits a stronger bone-tropism than the triple negative subtype (Kennecke et al., 2010) and is more likely to give rise to late-onset bone metastasis (Zhang et al., 2009), suggesting that some BMM survive adjuvant therapies and persist. Eliminating these BMM is a clinical challenge as they are asymptomatic. One potential solution is to identify potent but safe drugs that can kill BMM by transient treatment in unselected patient population. As2O3 is an FDA-approved drug that could be used for this purpose. Since this hypothesis is pertinent to luminal ER+ breast cancer and latent metastatic growth, we employed IIA injection of MCF7 cells, which can slowly colonize when directly delivered into bones. We purposely left host animals without extra estradiol so that the systemic estrogen level is lower than normally needed for orthotopic tumor growth. Under this condition, bone colonization could still occur in over 60% of animals after a 2-5 weeks latency time. Treatment of low-dosage As2O3 significantly decreased this proportion and resulted longer relapse-free survival (Figure 8B).
The mTOR signaling promotes early-stage bone colonization (Wang et al., 2015). The mTOR inhibitors, such as everolimus, are used to treat endocrine-resistant, metastatic ER+ breast cancer (Baselga et al., 2012). In BICA, As2O3 and everolimus exhibited additive efficacies (Figure S8E) without additive toxicity (Figure S8F). We asked if combined treatment of everolimus and As2O3, under the low-estrogen condition, could further reduce bone colonization. BMM are asymptomatic, precluding pre-selection of high-risk patients. Therefore, short-term and low-toxicity treatments are strongly desired to balance risk and benefit in an unselected patient population. Therefore, we kept the everolimus/As2O3 treatment for two weeks right after IIA injection, and then left the animals untreated. This transient treatment significantly reduced relapses, and achieved a better outcome compared to everolimus treatment alone (Figure 8C). This was corroborated by ex vivo BL intensity and IHC analyses of K8 at terminal time point after overt bone metastases developed (Figure 8D). Through micro–computed tomography (μCT), we found that everolimus treatment alone significantly increased bone mineral density, which was not much further improved by adding As2O3 (Figure 8E and S8G). This suggests that the additional efficacies of As2O3 are predominantly through elimination of lesions that are not yet osteolytic. Taken together, these data indicate that short-term As2O3 treatment could be added to current standard-of-care to reduce long-latency bone metastasis.
DISCUSSION
The roles of Ca signaling in tumor progression have been well established (Dubois et al., 2014; Prevarskaya et al., 2011). One mechanism to increase cancer cell [Ca2+] is through interactions with the ME niche (Figure 8F). This mechanism is specific to metastatic cells during early-stage bone colonization, when they closely interact with the osteogenic niche cells, and is mediated by GJs, which distinguishes it from other important Ca entry/mobilization mechanisms involving Orai, Stim, and TRPM. Bone is the major Ca reservoir of the entire organism. During bone remodeling, ME [Ca2+] may fluctuate. This remodeling process may alter BMM progression through the changes of Ca signaling. Many processes induce bone remodeling, including microfractures, inflammation, and drug-induced alteration to bone homeostasis. Future studies may provide mechanistic connections of these processes to the increased risk of bone recurrences.
OBs and osteocytes are connected by GJs in the bone, forming a network that readily transmits small molecules among these cells. Once the GJ between cancer cells and OBs are developed and Ca2+ is depleted from OBs, it is conceivable that the concentration gradients may drive the flow from connected osteocytes to OBs. This could mean that the Ca reservoir may actually possess a larger capacity, also including the osteocytes buried in the bone matrix.
GJs are increasingly linked to tumor progression and metastasis (Aasen et al., 2016). GJs can serve as tumor suppressors (Plante et al., 2011). Recent studies also suggest that in specific contexts, GJs may facilitate metastasis or therapeutic resistance (Chen et al., 2016; Osswald et al., 2015). Thus, the function of GJ is context-dependent. Chronical inhibition of GJ exhibited severe side effects, as would be expected. Interestingly, As2O3 and danusertib can both inhibit GJ and Ca signaling without the same side effects. In particular, As2O3 is an FDA-approved drug for treatment of acute promyelocytic leukemia (Zhu et al., 2002). The exact mechanisms underlying its efficacies have not been fully understood. Previous studies suggested that As2O3 might affect Ca influx (Raynal et al., 2016). We further showed that GJA1 is one of the top genes down-regulated by As2O3 treatment specifically in cancer cells that are interacting with bone cells. The toxicity of As2O3 has been intensively investigated and safe regimens have been identified (Fox et al., 2008). As2O3 can eradicate cancer cells 10 times more efficiently in the bone ME, making the effective dosage well below the toxicity threshold, providing rationale for further mechanistic and clinical studies.
Our data highlighted the importance of considering ME in searching for anti-metastasis drugs. The close interaction with osteogenic cells clearly confers cancer cells resistance to some drugs For instance, a recent study demonstrated that the Notch signaling between cancer cells and the osteogenic niche renders cancer cells resistant to chemotherapies (Zheng et al., 2017). However, this interaction also confers vulnerability to other drugs, sometimes unexpectedly. Ca2+ flow from osteogenic cells to cancer cells is underlying some of these alterations. The unique ex vivo and in vivo platforms we developed in previous studies (Wang et al., 2015, 2017) were essential for the discoveries. In particular, BICA significantly accelerated our search for bone metastasis therapies.
STAR Methods
CONTACT FOR REAGENT AND RESOURCE SHARING
Further information and requests for resources or reagents should be directed to the lead contact Dr. Xiang H.-F. Zhang at xiangz@bcm.edu
EXPERIMENTAL MODEL AND SUBJECT DETAILS
Animals
Athymic nude mice and Balb/c mice were purchased from Envigo. Osx1-GFP::Cre mice, Gja flox mice and Cdh2 flox mice were purchased from Jackson Laboratories (stock numbers: 006361; 008039; and 007611, respectively). These strains were intercrossed to produce experimental cohorts Osx1-GFP::Cre;Cdh2 f/f and Osx1-GFP::Cre;Gja1 f/f mice. Mice genotyping was performed under the guidance of JAX genotyping protocol. To halt EGFP/Cre fusion protein expression, doxycycline was added to water bottles at a final concentration of 200 mg/L and changed weekly until 2 weeks before the experiment. The 5- to 7-week-old female mice were used in all in vivo/BICA experiments. In the regular tumor model using ER+ human breast cancer cells (e.g. MCF7 cells), estradiol tubes were prepared and transplanted to nude mice before cancer cell injection. All animal work was done in accordance with a protocol approved by the Baylor College of Medicine Institutional Animal Care and Use Committee.
Cell Lines
Human breast cancer cell lines MCF7 and MDA-MB-361, human prostate cancer cell line C4-2 and 22Rv1, mouse pre-osteoclast RAW264.7, human monocyte U937, mouse fibroblast NIH 3T3 and human osteoblast hFOB1.19 cells were obtained from ATCC. Mouse breast cancer cell lines 4T1 and 4TO7 cells were purchased from Barbara Ann Karmanos Cancer Center. Human astrocytes were purchased from ScienCell. All these purchased cells were maintained under the manufacturer’s recommended media.
4T1.2 cell was a generous gift from Dr. Robin Anderson at Peter MacCallum Cancer Center and cultured in DMEM supplemented with 10% FBS, 1% penicillin-streptomycin, and 0.2% Amphotericin B. The immortalized MSC cell line was a generous gift from Dr. Max Wicha’s laboratory at University of Michigan and was cultured in alpha-MEM supplemented with 10% FBS, 1% penicillin-streptomycin, and 0.2% Amphotericin B. The osteocyte cell line MLO-Y4 was gifted from Dr. Florent Elefteriou at Baylor College of Medicine and cultured in alpha-MEM culture medium containing 2.5% FBS and 2.5% Calf Serum. The human mammary fibroblast cell was gifted from Dr. Eric Chang at Baylor College of Medicine and cultured in DMEM supplemented with 10% FBS, 1% penicillin-streptomycin, and 0.2% Amphotericin B. Fluc/GFP labelled C4-2 cell was a generous gift from Dr. Dasgupta Subhamoy’s lab at Roswell Park Comprehensive Cancer Center.
METHOD DETAILS
IIA Injection and IVIS imaging
Intra-iliac injections and IVIS imaging were performed as previously described (Wang et al., 2015; Yu et al., 2016). Briefly, mice were anesthetized by isoflurane or ketamine (100 mg/kg body weight) and xylazine (10 mg/kg body weight) mixture, and then restrained on a Far Infraired Warming Pad (Kent Scientific). A 1.5 cm incision was made between the 4th and 5th nipples in the lower right abdomen. Blunt dissection was performed to separate muscles and expose the common iliac artery. 5 X 10⁵ MCF7 or C4-2 cancer cells were suspended in 0.1 ml PBS were injected via 31G needles. A cotton tip was used to press the artery incision area to stop bleeding (in about 5-10 min). The wound was then closed by a 9 mm EZ clip. All mice receiving IIA injection were monitored until awake and moving normally. In the regular IIA model injecting MCF7 in nude mice, estradiol pellet was implanted under the back neck skin to accelerate the tumor lesion formation. In the “latency” model (Figure 8b and 8c), no estradiol was provided to mice. When induced protein expression was demanded, 200 mg/L doxycycline in water was administered to animals right after injection till the end of experiments.
Bioluminescence signaling was checked by injection of 100 μl 15 mg/ml sterilized firefly luciferase substrate D-luciferin (LUCNA-1G, Goldbio) via the intra-orbital sinus. Animals were imaged weekly using IVIS Lumina II (Advanced Molecular Vision). The acquired bioluminescence signals were normalized by the day 0 intensity around the knee joint other than the entire hind limb.
Spontaneous bone metastasis assay
The spontaneous bone metastasis assay was performed as previously described (Wang et al., 2015). Briefly, BALB/c mice recieved mammary fat pad injections of 1X10⁵ 4T1.2 cells suspended in physiological saline with 50% Growth Factor Reduced Matrigel Matrix. Surgical resection was used to remove the tumors when tumors reached >7 mm in diameter. Mice were then randomized into different groups to initialize treatment and closely monitored for up to 2 weeks. Whole-body bioluminescence imaging was performed before mice were sacrificed. BL signals from spines and hind limbs regions were quantified as bone metastasis. Hind limb bones and lungs were extracted right after euthanasia for ex vivo bioluminescence imaging.
Pharmacological Treatment
The administration of carbenoxolone, mefloquine and danusertib followed previous reports (Fraedrich et al., 2012; Keiser et al., 2011; Morecki et al., 1997) whereas the dose of the two FDA-approved drugs, everolimus and arsenic trioxide were adjusted from clinical human dose by FDA guidance: mouse dose(mg/kg)=human dose X mouse Km (~37) / mouse Km (~3). Carbenoxolone (CBX, C4790 Sigma) was injected i.p. daily at the dosage of 30 mg/kg. Mefloquine (MEFL, 1379059 Sigma) was administrated once weekly by oral gavage at the dosage of 50 mg/kg. Danusertib (A4116, ApexBio) were injected i.p. daily at the dosage of 15 mg/kg. Arsenic trioxide (A1010, Sigma) was injected i.p. daily at the dosage of 1.9 mg/kg (transferred from 0.15 mg/kg/day for human). Everolimus (A8169, ApexBio) was administrated daily by oral gavage at the dosage of 1 mg/kg. For IIA model, all drug treatments were administrated from the day of injection till the end of experiment unless specifically stated. For spontaneous model, treatments were administrated after resection of primary tumors till the end of experiment.
Bone-in-culture Array (BICA)
Bone-in-culture samples were set up as previously described (Wang et al., 2017). All the cancer cells used for BICA were labelled by luciferase. After IIA injection, the epiphysis and metaphysis around knee joint of the femurs and tibias were collected and crushed with a sterilized bone plier (F.S.T.16025–14). The generated bone pieces were transferred to low-attachment 96-well plates and cultured in DMEM/F12 media (with 2.438 g/L Sodium Bicarbonate, Gibco Ca#11320-033) with 2% FBS. Medium was changed every 3–4 days. IVIS imaging were performed on 2nd - 3rd week to measure the bioluminescence intensity. BL intensity is normalized to Day 0 signals right after IIA injection unless specified otherwise.
Drug screening
The John Hopkins University Clinical Compound Library is a generous gift from Dr. Stephen T. C. Wong’s laboratory at Houston Methodist Research Institute. 66 anti-neoplasm drugs were selected based on the annotation of compounds. The drug screening was performed as previously reported (Wang et al., 2017). Briefly, BICA samples carrying Fluc+ MCF7 cells were aligned in low-attachment 96-well plates with six replicates per condition. For parallel 2D cultures, MCF7 cells were plated in regular 96-well plates at a density of 500 cells/well. Signals were monitored for 2-3 weeks. In the first screening, 66 anti-neoplasm drugs were randomly grouped at a concentration of 100 nM for each compound (see Table S1). In the secondary screenings, single compounds were tested at 100 nM separately.
Recombinant DNA generation
Dominant negative CaMKII T286A was cloned from GFP-C1-CAMKIIalpha-T286A (Addgene Cat#21220); Constitutive active CaMKII T286D was cloned from XE118 CAMKII-T286D-CS2+ (Addgene Cat#16736); Dominant negative Calcineurin ∆H161Q was cloned from pET15b CnA CnB (Addgene Cat#11787), mutations introduced by PCR. Wild-type Cx43 and dominant negative Cx43 G138R was cloned from hFOB1.19 cDNA, mutations introduced by PCR.
pInducer22 (a generous gift from Dr. Thomas Westbrook’s lab at Baylor College of Medicine) serves as the the backbone of doxycycline-induced overexpression system. The Gateway cloning system (ThemoFisher Scientific) was applied to insert Cx43, E-cadherin, Calcineurin or CaMKII (of wild-type, constitutive active or dominant negative proteins) into pInducer22, following the manufacturer’s protocol. To induce gene expression in vitro or in BICA, cells were treated with 50-100 ng/ml doxycycline in culture media. To induce gene expression in vivo, mice were administrated by 200 mg/L doxycycline in drinking water.
The PWIPZ system (psPAX2 and pMD2,G) was used to introduce Gcamp (carried by pHAGE-RSV-GCaMP6s , #80146, addgene), Cx43, E-cadherin, Calcineurin or CaMKII (carried by pInducer22) or firefly luciferase fused with GFP /RFP (carrie by pWPT) into different cell lines via lentivirus packaging and transduction. Transfection efficiencies were determined by western bolt.
3D co-culture assay
For IVIS imaging, a total of 20,000/well luciferase -labeled cancer cells with equivalent number of unlabeled osteogenic cells were cultured in 24-well low-attachment plate with serum-free DMEM/F12 media. The signal of cancer cells were were monitored or 3-7 days through bioluminescence imaging with IVIS Lumina II. Before imaging, sterilized firefly luciferase substrate D-luciferin (LUCNA-1G, Goldbio) was added to the cultures to reach a final concentration of 150 µg/ml.
For IF staining, qPCR or western blots on samples incubated over 48 hr, a total of 250,000/well cancer cells with 50,0000/well osteogenic cells were cultured in 6-well low-attachment plate with serum-free DMEM/F12 media. After 48 hr, organoids were spun down at 500 g for 5 min, rinsed by PBS, and then resuspended for PFA (IF), Trizol (qPCR) or lysis buffer (western blot).
For transient coculture settings (Figure S2D, 4D and 7E), 500,000 cancer cells were suspended and incubated with/without equal number of osteogenic cells for 3.5 hr in serum and calcium free S-MEM media. After that, 0-2 mM calcium was added along with other inhibitors as designed for 30 min. Cells were spun down at 500 g for 5 min, washed by PBS, and then resuspended in lysis buffer.
Western Blot
Western blots were performed using antibodies against NFAT1(Cell Signalling, 5861S), pS6K(T389) (Cell Signaling, 9234S), pCamKII(T286) (Cell Signalling, 12716S), MeCP2 (Cell Signalling, 3456S), pMeCP2(S421)(Rockland, 600-401-X14), Firefly luciferase (Thermo, PA5-32209). The Electrophoresis and Membrane-Transfer were performed by iBlot (Invitrogen). Imaging was obtained by Odyssey (Li-Cor) system, following the manufacturer’s protocol.
Immunofluorsent and Immunohistochemical Staining
On Day 2, the organoids were collected by centrifugation (500 g for 2 mins), fixed in 4% paraformaldehyde, and paraffin embedded. Orthotopic tumor samples were chopped into small chunks and fixed in 4% paraformaldehyde for paraffin embedding. Femur and tibia bones were excised from mice at the end point of each experiment. Mussels were carefully removed by paper towels. BICA or tumor-bearing bone samples were fixed in 4% paraformaldehyde, decalcified in 14% EDTA for 2 weeks, and embedded in paraffin for section. Microtome-sectioning was conducted to prepare 6 µm slides for organoids, othotopic tumor, BICA or bone samples.
Immunofluorescent and immunohistochemical staining was assisted by the BCM Breast Center Pathology Core and performed with the antibody against Cx43 (Sigma, C6219), MeCP2 (Cell Signalling, 3456S) and NFAT (Cell Signalling, 5861S). Sections were deparaffinized and followed by antigen retrieval in 1x citric buffer at 90°C for 10 min. After blocking for 1 hour at RT in blocking buffer (5 % goat serum, 5 % donkey serum, 2 % BSA in PBS-GT), slides were incubated overnight in a humidified chamber at 4°C with primary antibodies. The next day, slides were washed and incubated with Alexa Fluor conjugated secondary antibody (1:250, Jackson ImmunoResearch) for 1 hour at room temperature. Afterwards slides were stained with SlowFade Gold antifade reagent with DAPI (Life technologies, cat # S36936). Washing was performed in PBS between all steps. Immunofluorsent images were obtained using a Leica confocal microscope and ImageJ. Immunohistochemical images were obtained using an Olympus BX50F4 microscope and CellSens. All pictures are representative of at least three biological replicates in each group.
Flow Cytometry
To quantify calcium flow by FACS, cells expressing Gcamp6s were incubated with/without non- Gcamp6s cells for 4 hr in serum and calcium free S-MEM media. After that, 0-2 mM calcium was added along with other inhibitors as designed for 30 min and go for flow. To characterize the Calcein (C3100MP, ThermoFisher) transportation throw gap junction, Osteoblasts were preloaded with Calcein and cocultured with cancer cells for up to 4 hr in DMEM/F12 media before flow. All data were acquired using a BD LSR Fortessa Analyzer and analyzed with Flow Jo v10.0.
MicroCT (µCT) Analysis
For µCT analyzes, hind limb specimens were dissected to remove soft tissues. The bone specimens consisting of the entire femur and tibia were fixed in formaldehyde prior to imaging. The specimens (n=4) were stabilized in a individual holders and kept in ethanol during µCT scanning. To accommodate the length of bone specimens, overscan mode was used which acquired sequentially 7 high-resolution images with a spatial resolution of 6.5 µm (Skyscan1174v2; Bruker, Kontich, Belgium). The X-ray source was set at a voltage of 50kV, a current of 200 µA, and a rotation step at 0.2°. The sequential imag es were then digitally combined to obtain visualization of the entire femur and tibia. Qualitative analyzes included 2- and 3-dimentional reconstructions performed using NRecon and CTvox software (Bruker, Kontich, Belgium). After determining that the site of most pronounced metastatic destruction occurred in the distal femur and proximal tibia, segments of these bone regions each extending 5mm away from the knee joint space were selected for quantitative analyzes. The region of interest (ROI) were selected, and the gray thresholds of 68 and 120 allowed to calculate total (cancellous and cortical) and cortical bone, respectively. Bone mineral density was assessed using previous calibration against standard mouse density µCT phantoms. µCT results were compares using 1-way ANOVA with Bonferroni-Holm posthoc test for pairwise caparisons. Statistical significance was set at a threshold of 0.05.
RNA Isolation and qRT-PCR Analysis
Total RNAs were extracted from cells using Direct-zol RNA miniPrep kit (Zymo Research) following manufacturer’s instructions. RNAs were reverse-transcribed into cDNAs by using Superscript III reverse transcription kit (Invitrogen). Real-time RT-PCR was performed on Biorad CFX connected Real-time system using PowerUp SYBR Green Master Mix (applied biosystems). All real-time RT-PCR assays were performed in at least duplicate in three independent experiments. In 3D assay, human cancer cell and murine MSC were co-cultured. Human-specific primers were used exclusively for gene expression detection in cancer cells. Relative expression values of each target gene were normalized to GAPDH or ACTB mRNA level. The primers are listed in the Key Resources Table.
KEY RESOURCES TABLE.
| REAGENT or RESOURCE | SOURCE | IDENTIFIER |
|---|---|---|
| Antibodies | ||
| NFAT1 in 1:200 (IF) or 1:1000(WB), Rabbit | Cell Signaling Technology | Cat#5861S, RRID:AB_10835147 |
| pS6K(T389) in 1:1000(WB), Rabbit | Cell Signaling Technology | Cat#9234S, RRID:AB_2269803 |
| pCamKII(T286) in 1:1000 (WB), Rabbit | Cell Signaling Technology | Cat#12716S, RRID:AB_2713889 |
| MeCP2 in 1:200 (IF) or 1:1000(WB), Rabbit | Cell Signaling Technology | Cat#3456S, RRID:AB_2143849 |
| pMeCP2(S421) in 1:1000(WB), Rabbit | Rockland | Cat#600-401-X14, RRID:AB_2614557 |
| Firefly luciferase in 1:5000 (WB), Rabbit | Thermo | Cat#PA5-32209, RRID:AB_2549682 |
| SP1 antibody (Chip grade) | Cell Signaling Technology | CST # 9389S, RRID:AB_11220235 |
| normal rabbit IgG | Cell Signaling Technology | CST # 2729S, RRID:AB_1031062 |
| Cx43 in 1:200 (IF), Rabbit | Sigma | Cat#C6219, RRID:AB_476857 |
| Chemicals, Peptides, and Recombinant Proteins | ||
| D-luciferin | Goldbio | Cat# LUCNA-1G |
| Carbenoxolone | Sigma | Cat# C4790 |
| Mefloquine | Sigma | Cat#1379059 |
| Danusertib | ApexBio | Cat# A4116 |
| Nifedipine | ApexBio | Cat#B1988 |
| SKF96365 | ApexBio | Cat#B6616 |
| Arsenic trioxide | Sigma | Cat# A1010 |
| John Hopkins University Clinical Compound Library | gift from Dr. Stephen T. C. Wong’s laboratory at Houston Methodist Research Institute | NA |
| Everolimus | ApexBio | Cat# A8169 |
| Critical Commercial Assays | ||
| Nextera XT DNA Library Prep Kit | Illumina | Cat# FC-131-1096 |
| Nextseq 500/550 high output v2 kit | Illumina | Cat# FC-404-2002 |
| Deposited Data | ||
| breast cancer metastases dataset | GEO | GSE46141 |
| human breast cancer metastases dataset in different organs | GEO | GSE14020 |
| Stroma cells in the breast cancer microenvironment | GEO | GSE27120 |
| Cancer-osteoblast heterotypic interactions dataset | GEO | GSE29036 |
| Subpopulations of MDA-MB-231 and Primary Breast Cancers | GEO | GSE2603 |
| Breast cancer relapse free survival and lung metastasis free survival | GEO | GSE5327 |
| Breast cancer relapse free survival | GEO | GSE2034 |
| Expression data from primary breast tumors | GEO | GSE12276 |
| Metastatic prostate cancer dataset | GEO | GSE77930 |
| in vivo Bone Lesion (IVBL) and Orthotopic tumors dataset | GEO | GSE110451 |
| ATO treatment on mesenchymal stem cells (MSCs) interacting breast cancer cells | GEO | GSE118923 |
| Experimental Models: Cell Lines | ||
| Human breast cancer MCF7 | ATCC | Cat# HTB-22, RRID:CVCL_0031 |
| Human breast cancer MDA-MB-361 | ATCC | Cat# HTB-27, RRID:CVCL_0620 |
| Mouse pre-osteoclast RAW264.7 | ATCC | Cat# TIB-71, RRID:CVCL_0493 |
| Human monocyte U937 | ATCC | Cat# CRL-1593.2, RRID:CVCL_0007 |
| Mouse breast cancer 4T1 | Barbara Ann Karmanos Cancer Center | RRID:CVCL_0125 |
| Mouse breast cancer 4TO7 | Barbara Ann Karmanos Cancer Center | RRID:CVCL_B383 |
| Mouse breast cancer 4T1.2 | Gift from Dr. Robin Anderson at Peter MacCallum Cancer Center | RRID:CVCL_GR32 |
| Human Mesenchymal stem cell | gift from Dr. Max Wicha’s laboratory at University of Michigan | |
| Human osteocyte MLO-Y4 | gift from Dr. Florent Elefteriou at Baylor College of Medicine | RRID:CVCL_M098 |
| Human Astrocyte | ScienceCell | Catalog #1800 |
| Human mammary fibroblast cell | gift from Dr. Eric Chang’s laboratory at Baylor College of Medicine | |
| Mouse fibroblast NIH3T3 | ATCC | Cat# CRL-1658, RRID:CVCL_0594 |
| Human pre-Osteoblast hFOB1.19 | ATCC | Cat#CRL-11372, RRID:CVCL_3708 |
| Human prostate cancer C4-2, Fluc+ | gift from Dr. Dasgupta Subhamoy’s lab at Roswell Park Comprehensive Cancer Center | |
| Human prostate cancer 22RV1 | ATCC | Cat#CRL-2505, RRID:CVCL_1045 |
| Experimental Models: Organisms/Strains | ||
| Mouse Bal/cJ | Envigo | NA |
| Mouse C57BL/6 | Envigo | NA |
| Athymic nude mice | Envigo | NA |
| Osx1-GFP::Cre mice | Jackson Laboratory | Cat#006361 |
| Gja1 flox mice | Jackson Laboratory | Cat#008039 |
| Cdh2 flox mice | Jackson Laboratory | Cat#007611 |
| Oligonucleotides | ||
| FAP-F | Tripathi et al., 2014 | TGGCGATGAACAATATCCTAGA |
| FAP-R | Tripathi et al., 2014 | ATCCGAACAACGGGATTCTT |
| ACTB-F | This paper | GTTGTCGACGACGAGCG |
| ACTB-R | This paper | GCACAGAGCCTCGCCTT |
| TWIST1_F | Tripathi et al., 2014 | AGCTACGCCTTCTCGGTCT |
| TWIST1_R | Tripathi et al., 2014 | TCCTTCTCTGGAAACAATGACA |
| MRC2_F | Tripathi et al., 2014 | AACTTCCGGGACAGTCTGG |
| MRC2_R | Tripathi et al., 2014 | TTACAGGGACTGTCGTTCCA |
| COL3AL_F | Tripathi et al., 2014 | ACTGGAGCACGGGGTCTT |
| COL3AL_R | Tripathi et al., 2014 | TCCTGGTTTCCCACTTTCAC |
| ANGPTL2_F | Tripathi et al., 2014 | GCCCACTATGCCCACTCTC |
| ANGPTL2_R | Tripathi et al., 2014 | CTGCAGGCAGTCTCTCCAT |
| MGP_F | Tripathi et al., 2014 | TGAAAGCATGGAATCTTATGAACTT |
| MGP_R | Tripathi et al., 2014 | CTGCTGAGGGGATATGAAGG |
| PTRF_F | Tripathi et al., 2014 | CAGCGTCAACGTGAAGACC |
| PTRF_R | Tripathi et al., 2014 | CCGGCAGCTTCACTTCAT |
| MECP2_F | This Paper | GCGAGGAGGAGAGACTGGA |
| MECP2_R | This Paper | TTTAAACTTGAGGGGTTTGTCC |
| GJA1-F | This Paper | TCCTCCTCTTTCTTGTTCAGTTTCTCT |
| GJA1-R | This Paper | CCTGCAGATCATATTTGTGTCTGTTC |
| GAPDH-F | This Paper | TTGAGGTCAATGAAGGGGTC |
| GAPDH-R | This Paper | GAAGGTGAAGGTCGGAGTCA |
| Actb-F | This Paper | GGCTGTATTCCCCTCCATCG |
| Actb-R | This Paper | CCAGTTGGTAACAATGCCATGT |
| Nfatc1_F | This Paper | TCCAAAGTCATTTTCGTGGA |
| Nfatc1_R | This Paper | CTTTGCTTCCATCTCCCAGA |
| Nfatc2_F | This Paper | CAACGGAAAGAGGAAACGAA |
| Nfatc2_R | This Paper | CTGTCTTGATGGCAGGGACT |
| Gapdh-F | This Paper | AGGTCGGTGTGAACGGATTTG |
| Gapdh-R | This Paper | TGTAGACCATGTAGTTGAGGTCA |
| FW-SP1-CX43 | This Paper | ACTGCTGCTCTTTGCCTCTT |
| RV-SP1-CX43 | This Paper | TGTAACTTGGAGCACAGAGCTT |
| Recombinant DNA | ||
| pMD2.G | Addgene | Cat#12259 |
| psPAX2 | Cat#12260 | |
| pwpt-Fluc/GFP or pwpt-Fluc/RFP | Wang et al., 2015 | |
| pHAGE-RSV-GCaMP6s | Addgene | Cat#80146 |
| pInducer22 | gift from Dr. Thomas Westbrook’s lab at Baylor College of Medicine | |
| pInducer22-DN-Ecad | Wang et al., 2015 | |
| pInducer22-WT-Cx43 | This paper | |
| pInducer22-DN-Cx43(G138R) | This paper | |
| pInducer22-DN-CaMKII(T286A) | This paper | |
| pInducer22-CA-CaMKII(T286D) | This paper | |
| pInducer22-DN-Calcineurin(delta H160Q) | This paper | |
| Software and Algorithms | ||
| ImageJ | National Institute of Health | NA |
| Cyverse | National Science Foundation | Award Numbers DBI-0735191 and DBI-1265383 |
| R 3.3.4 | R Core Team | NA |
| Graphpad Prism7 | GraphPad Software, Inc. | NA |
| Flow Jo v10.0. | FlowJo, LLC | NA |
| SPSS 19 | IBM | NA |
| Other | ||
| Code of analysis by R programming | This paper | https://github.com/lethesea/Targeting-calcium-signaling-in-bone-micrometastases |
Chromatin Immunoprecipitation (ChIP)-assay
Cells were vehicle- or 200 nM As2O3 treated for 7 days and harvested for ChIP assay. In brief, DNA/protein complexes were crosslinked using 1% formaldehyde for 10 min, followed by chromatin extraction. Chromatin shearing was performed for 4 cycles of 10 min (30 sec ON/OFF). Pre-cleared samples were immunoprecipitated at 4°C overnight with SP1 antibody (CST # 9389S) or normal rabbit IgG (CST # 2729S) linked to Dynabeads protein G. Beads were sequentially washed 3 times with 1ml of Buffer 1 (50mM Hepes-KOH pH 7.5, 150mM NaCl, 1mM EDTA, 1% Triton X-100, 0.1% sodium deoxycholate, and 0.1% SDS), once with 1ml of Buffer 2 (50mM Hepes pH 7.5, 350mM NaCl, 1mM EDTA, 1% Triton X-100, 0.1% sodium deoxycholate 0.1% SDS), 1ml of Buffer 3 (1mM EDTA, 10mM Tris-HCl pH 8.1, 250mM LiCl, 1mM sodium Deoxycholate, and 1% NP40), and 1ml of Buffer 4 (1x) (1mM EDTA, 10mM Tris- HCl). Chromatin was eluted with 1% SDS buffer, followed by 2 hours protein digestion, and overnight DNA de-crosslinking at 67°C. DNA was puri fied using a DNA Clean & Concentrator kit (ZYMO # D4013) and used for RT-PCR with the primers FW-SP1-CX43 and RV-SP1-CX43 (see Key Resources Table).
RNA-seq experiment
For mice samples, the RNA-seq experiment was performed as previously reported (Wang et al., 2017, Figure S2A). The orthotopic tumor and bone lesion samples were collected 3 weeks after inoculation. Tissues were homogenized by Precellys 24 Homogenizer (Bertin). In 3D assay, human cancer cell and murine MSC were co-cultured in serum-free DMEM/F12 media for 48 hr and centrifuged. Total RNA of either tissues or cells were extracted using the Direct-zol RNA miniprep kit (Zymo Research). The first and second strands of cDNA were prepared by SuperScript III First-Strand Synthesis System and NEBNext mRNA Second Strand Synthesis Module from > 200 ng total RNA/ sample. Sequencing libraries were generated with the Illumina Nextera XT DNA Library Prep Kit (Illumina, San Diego, CA,USA) according to the protocol supplied by the manufacturer. Cluster generation was performed using the Illumina Nextseq 500/550 high output v2 kit and sequenced on the Illumina Nextseq 500 equipment.
The reads containing a mixture of human and mouse reads were separated with in silico sorting using Xenome (version 1.0.1). We used the default k-mer size suggested by Xenome (−k 25). After that, the sorted human reads were mapped using STAR RNA-seq aligner (version 2.4.1d). To make full use of the reads not uniquely mapped we used RSEM, which applies estimation maximization to quantify gene and isoform expression. DEseq2 R package was used to normalize the gene/isoform expression matrix. The dataset has been uploaded to GEO with the access number GSE110451.
QUANTIFICATION AND STATISTICAL ANALYSIS
All results are presented in the form of mean±s.e.m. or mean±s.d. Sample sizes for in vivo experiments are noted in the corresponding figures or figure legends. Log-transformation were performed to achieve better visualization for samples with large standard deviation. Differences among growth curves and IC50 inhibition curves were assessed using repeated measure analysis of variance tests. In experiments containing two groups, 2-tailed student’s t-tests were performed with the assumption of equal variation. In experiments consisting of more than two groups, the differences between means of different experimental groups were analyzed using LSD tests. Results using other statistical analysis were noted in respective legends.
Gene Set Variation Analyses were performed using the GSVA package of the R program (Hänzelmann et al., 2013). Default settings are used. Transcription factor target gene sets were downloaded from the MSigDB database (the C3 TFT collection) (Subramanian et al., 2005). The generated GSVA scores of each pathway were compared between bone metastases and other metastases in GSE14020 using the SAM package of R. In some analyses, we re-scaled GSVA scores linearly between 0 and 1 by (max_score – gsva.score_i)/(max_score – min_score), where gsva_score_i represents the score of the i’th tumor, and max_ and min_scores represent the maximum and minimum scores of all tumors, respectively.
Survival analyses were performed using the “survival” package of the R program. The “survdiff” function was used to compute log-rank p values between different groups. And the “survfit” function was used to generate Kaplan-Meier curves.
For all boxplots, the line inside the box is the median value; top/bottom bars of the box show 75th/25th percentile; the upper/lower whiskers show largest/smallest values no further than 1.5 × inter-quartile range from the hinge; data points beyond whiskers are possible outliers.
DATA AND SOFTWARE AVAILABILITY
The in vivo Bone Lesion (IVBL) and Orthotopic tumors dataset is available in NIH Gene Expression Omnibus with the accession number GSE110451.
The dataset of ATO treatment on mesenchymal stem cells (MSCs) interacting breast cancer cells is available in NIH Gene Expression Omnibus with the accession number GSE118923.
The Mendeley Dataset of this manuscript is available at: http://dx.doi.org/10.17632/bbbz577rx8.1
Codes data analysis by R programming is available at: https://github.com/lethesea/Targeting-calcium-signaling-in-bone-micrometastases
Supplementary Material
SIGNIFICANCE.
Breast cancer bone metastasis often occurs asynchronously, years after primary tumor resection and adjuvant therapies, suggesting mechanisms driving therapeutic resistance and tumor re-growth specifically in the bone ME. We discovered that Ca influx from the osteogenic niche to cancer cells is essential for proliferation of early-stage bone metastasis, in addition to previously identified role of the mTOR signaling. We performed target-driven search for therapeutic agents inhibiting both pathways and identified danusertib and arsenic trioxide as potent candidates. Danusertib is currently under clinical development. Arsenic trioxide is an FDA-approved drug for leukemia. The preferential efficacies of these drugs on BMM – argue for immediate applications to eliminate latent cancer cells in the bone marrow and reduce metastasis recurrences.
HIGHLIGHTS.
Calcium signaling is enhanced in bone metastasis as compared to other metastases
Cancer cells rely on direct calcium influx from osteogenic cells to increase [Ca2+]
Gap junctions mediate Ca2+ flow from osteogenic cells to cancer cells
As2O3 suppresses latent bone metastasis by inhibiting calcium signaling
Wang et al. report that cancer cells obtain Ca from the osteogenic niche through gap junctions and that Ca signaling together with mTOR signaling promotes bone metastasis progression. They identify that As2O3 and danusertib affect Ca signaling and preferentially target cancer cells in the bone microenvironment.
ACKNOWLEDGEMENTS
We thank Zhang Laboratory members for helpful input. We thank Max Wicha, Eric Chang, Dasgupta Subhamoy, Robin. L. Anderson, Thomas Westbrook, and Florent Elefteriou for reagents. X.H.-F.Z. is supported by US Department of Defense DAMD W81XWH-16-1-0073, NCI CA183878, Breast Cancer Research Foundation, and McNair Medical Institute. H.W. is supported in part by US Department of Defense DAMD W81XWH-13-1-0296. Z. and S.T.C.W. are supported by NIH U01188388, NIH U54CA149196, CPRIT RP110532-C1, and John S Dunn Research Foundation. We also acknowledge the Pathology Core of Lester and Sue Smith Breast Center and the Dan L. Duncan Cancer Center, and Cell Sorting Core (CCSC) at Baylor College of Medicine.
Footnotes
DECLARATION OF INTERESTS
The authors declare no competing interests.
Publisher's Disclaimer: This is a PDF file of an unedited manuscript that has been accepted for publication. As a service to our customers we are providing this early version of the manuscript. The manuscript will undergo copyediting, typesetting, and review of the resulting proof before it is published in its final citable form. Please note that during the production process errors may be discovered which could affect the content, and all legal disclaimers that apply to the journal pertain.
REFERENCES
- Aasen T, Mesnil M, Naus CC, Lampe PD, and Laird DW (2016). Gap junctions and cancer: communicating for 50 years. Nat. Rev. Cancer 16, 775–788. [DOI] [PMC free article] [PubMed] [Google Scholar]
- Baselga J, Campone M, Piccart M, Burris HA 3rd, Rugo HS, Sahmoud T, Noguchi S, Gnant M, Pritchard KI, Lebrun F, et al. (2012). Everolimus in postmenopausal hormone-receptor-positive advanced breast cancer. N. Engl. J. Med 366, 520–529. [DOI] [PMC free article] [PubMed] [Google Scholar]
- Berridge MJ, Bootman MD, and Roderick HL (2003). Calcium: Calcium signalling: dynamics, homeostasis and remodelling. Nat. Rev. Mol. Cell Biol 4, 517–529. [DOI] [PubMed] [Google Scholar]
- Boyce BF, Yoneda T, and Guise TA (1999). Factors regulating the growth of metastatic cancer in bone. Endocr. Relat. Cancer 6, 333–347. [DOI] [PubMed] [Google Scholar]
- Buchthal B, Lau D, Weiss U, Weislogel JM, and Bading H (2012). Nuclear calcium signaling controls methyl-CpG-binding protein 2 (MeCP2) phosphorylation on serine 421 following synaptic activity. J. Biol. Chem 287, 30967–30974. [DOI] [PMC free article] [PubMed] [Google Scholar]
- Chen Q, Boire A, Jin X, Valiente M, Er EE, Lopez-Soto A, S. Jacob L, Patwa R, Shah H, Xu K, et al. (2016). Carcinoma–astrocyte gap junctions promote brain metastasis by cGAMP transfer. Nature 533, 493–498. [DOI] [PMC free article] [PubMed] [Google Scholar]
- Chen T-W, Wardill TJ, Sun Y, Pulver SR, Renninger SL, Baohan A, Schreiter ER, Kerr RA, Orger MB, Jayaraman V, et al. (2013). Ultrasensitive fluorescent proteins for imaging neuronal activity. Nature 499, 295–300. [DOI] [PMC free article] [PubMed] [Google Scholar]
- Chen WG, Chang Q, Lin Y, Meissner A, West AE, Griffith EC, Jaenisch R, and Greenberg ME (2003). Derepression of BDNF Transcription Involves Calcium-Dependent Phosphorylation of MeCP2. Science (80-. ). 302, 885 LP–889. [DOI] [PubMed] [Google Scholar]
- Chou WC, Chen HY, Yu SL, Cheng L, Yang PC, and Dang CV (2005). Arsenic suppresses gene expression in promyelocytic leukemia cells partly through Sp1 oxidation. Blood 106, 304–310. [DOI] [PMC free article] [PubMed] [Google Scholar]
- Clapham DE (2007). Calcium Signaling. Cell 131, 1047–1058. [DOI] [PubMed] [Google Scholar]
- Cohen S, Gabel HW, Hemberg M, Hutchinson AN, Sadacca LA, Ebert DH, Harmin DA, Greenberg RS, Verdine VK, Zhou Z, et al. (2011). Genome-Wide Activity-Dependent MeCP2 Phosphorylation Regulates Nervous System Development and Function. Neuron 72, 72–85. [DOI] [PMC free article] [PubMed] [Google Scholar]
- Dubois C, Vanden Abeele F, Lehen’kyi V, Gkika D, Guarmit B, Lepage G, Slomianny C, Borowiec A, Bidaux G, Benahmed M, et al. (2014). Remodeling of Channel-Forming ORAI Proteins Determines an Oncogenic Switch in Prostate Cancer. Cancer Cell 26, 19–32. [DOI] [PubMed] [Google Scholar]
- Ell B, and Kang Y (2012). SnapShot: Bone metastasis. Cell 151. [DOI] [PubMed] [Google Scholar]
- Feng M, Grice DM, Faddy HM, Nguyen N, Leitch S, Wang Y, Muend S, Kenny PA, Sukumar S, Roberts-Thomson SJ, et al. (2010). Store-independent activation of orai1 by SPCA2 in mammary tumors. Cell 143, 84–98. [DOI] [PMC free article] [PubMed] [Google Scholar]
- Fournier PGJ, Juárez P, Jiang G, Clines GA, Niewolna M, Kim HS, Walton HW, Peng XH, Liu Y, Mohammad KS, et al. (2015). The TGF-β Signaling Regulator PMEPA1 Suppresses Prostate Cancer Metastases to Bone. Cancer Cell 27, 809–821. [DOI] [PMC free article] [PubMed] [Google Scholar]
- Fox E, Razzouk BI, Widemann BC, Xiao S, O’Brien M, Goodspeed W, Reaman GH, Blaney SM, Murgo AJ, Balis FM, et al. (2008). Phase 1 trial and pharmacokinetic study of arsenic trioxide in children and adolescents with refractory or relapsed acute leukemia, including acute promyelocytic leukemia or lymphoma. Blood 111, 566–573. [DOI] [PMC free article] [PubMed] [Google Scholar]
- Fraedrich K, Schrader J, Ittrich H, Keller G, Gontarewicz A, Matzat V, Kromminga A, Pace A, Moll J, Bläker M, et al. (2012). TarGeting aurora kinases with danusertib (PHA-739358) inhibits growth of liver metastases from gastroenteropancreatic neuroendocrine tumors in an orthotopic xenograft model. Clin. Cancer Res 18, 4621–4632. [DOI] [PubMed] [Google Scholar]
- Ghajar CM, Peinado H, Mori H, Matei IR, Evason KJ, Brazier H, Almeida D, Koller A, Hajjar KA, Stainier DYR, et al. (2013). The perivascular niche regulates breast tumour dormancy. Nat. Cell Biol 15, 807–817. [DOI] [PMC free article] [PubMed] [Google Scholar]
- Di Giorgio E, Franforte E, Cefalù S, Rossi S, Dei Tos AP, Brenca M, Polano M, Maestro R, Paluvai H, Picco R, et al. (2017). The co-existence of transcriptional activator and transcriptional repressor MEF2 complexes influences tumor aggressiveness. PLoS Genet. 13. [DOI] [PMC free article] [PubMed] [Google Scholar]
- Hänzelmann S, Castelo R, and Guinney J (2013). GSVA: gene set variation analysis for microarray and RNA-Seq data. BMC Bioinformatics 14, 7. [DOI] [PMC free article] [PubMed] [Google Scholar]
- Huang CK, Tsai MY, Luo J, Kang HY, Lee SO, and Chang C (2013). Suppression of androgen receptor enhances the self-renewal of mesenchymal stem cells through elevated expression of EGFR. Biochim Biophys Acta 1833, 1222–1234. [DOI] [PMC free article] [PubMed] [Google Scholar]
- Ishikawa M, Iwamoto T, Nakamura T, Doyle A, Fukumoto S, and Yamada Y (2011). Pannexin 3 functions as an ER Ca 2+ channel, hemichannel, and gap junction to promote osteoblast differentiation. J. Cell Biol 193, 1257–1274. [DOI] [PMC free article] [PubMed] [Google Scholar]
- Jiang JX, Siller-Jackson AJ, and Burra S (2007). Roles of gap junctions and hemichannels in bone cell functions and in signal transmission of mechanical stress. Front. Biosci 12, 1450–1462. [DOI] [PMC free article] [PubMed] [Google Scholar]
- Kang Y, Siegel PM, Shu W, Drobnjak M, Kakonen SM, Cordon-Cardo C, Guise TA, and Massague J (2003). A multigenic program mediating breast cancer metastasis to bone. Cancer Cell 3, 537–549. [DOI] [PubMed] [Google Scholar]
- Keiser J, Manneck T, and Vargas M (2011). Interactions of mefloquine with praziquantel in the schistosoma mansoni mouse model and in vitro. J. Antimicrob. Chemother 66, 1791–1797. [DOI] [PubMed] [Google Scholar]
- Kennecke H, Yerushalmi R, Woods R, Cheang MC, Voduc D, Speers CH, Nielsen TO, and Gelmon K (2010). Metastatic behavior of breast cancer subtypes. J. Clin. Oncol 28, 3271–3277. [DOI] [PubMed] [Google Scholar]
- King TJ, and Lampe PD (2004). The gap junction protein connexin32 is a mouse lung tumor suppressor. Cancer Res. 64, 7191–7196. [DOI] [PubMed] [Google Scholar]
- Kumar A, Coleman I, Morrissey C, Zhang X, True LD, Gulati R, Etzioni R, Bolouri H, Montgomery B, White T, et al. (2016). Substantial interindividual and limited intraindividual genomic diversity among tumors from men with metastatic prostate cancer. Nat. Med 22, 369–378. [DOI] [PMC free article] [PubMed] [Google Scholar]
- Li H, Zhong X, Chau KF, Santistevan NJ, Guo W, Kong G, Li X, Kadakia M, Masliah J, Chi J, et al. (2014). Cell cycle-linked MeCP2 phosphorylation modulates adult neurogenesis involving the Notch signalling pathway. Nat. Commun 5, 5601. [DOI] [PMC free article] [PubMed] [Google Scholar]
- Liberti WA, Markowitz JE, Perkins LN, Liberti DC, Leman DP, Guitchounts G, Velho T, Kotton DN, Lois C, and Gardner TJ (2016). Unstable neurons underlie a stable learned behavior. Nat. Neurosci 19, 1665–1671. [DOI] [PMC free article] [PubMed] [Google Scholar]
- Luo X, Fu Y, Loza AJ, Murali B, Leahy KM, Ruhland MK, Gang M, Su X, Zamani A, Shi Y, et al. (2016). Stromal-Initiated Changes in the Bone Promote Metastatic Niche Development. Cell Rep. 14, 82–92. [DOI] [PMC free article] [PubMed] [Google Scholar]
- Macian F (2005). NFAT proteins: key regulators of T-cell development and function. Nat. Rev. Immunol 5, 472–484. [DOI] [PubMed] [Google Scholar]
- Mackiewicz-Wysocka M, Pankowska M, and Wysocki PJ (2012). Progress in the treatment of bone metastases in cancer patients. Expert Opin. Investig. Drugs 21, 785–795. [DOI] [PubMed] [Google Scholar]
- Massagué J, and Obenauf AC (2016). Metastatic colonization by circulating tumour cells. Nature 529, 298–306. [DOI] [PMC free article] [PubMed] [Google Scholar]
- McKinsey TA, Zhang CL, and Olson EN (2002). MEF2: A calcium-dependent regulator of cell division, differentiation and death. Trends Biochem. Sci 27, 40–47. [DOI] [PubMed] [Google Scholar]
- Meyer RA, Laird DW, Revel JP, and Johnson RG (1992). Inhibition of gap junction and adherens junction assembly by connexin and A-CAM antibodies. J. Cell Biol 119, 179–189. [DOI] [PMC free article] [PubMed] [Google Scholar]
- Monteith GR, McAndrew D, Faddy HM, and Roberts-Thomson SJ (2007). Calcium and cancer: targeting Ca2+ transport. Nat. Rev. Cancer 7, 519–530. [DOI] [PubMed] [Google Scholar]
- Morecki S, Moshel Y, Gelfend Y, Pugatsch T, and Slavin S (1997). Induction of graft vs. tumor effect in a murine model of mammary adenocarcinoma. Int. J. Cancer 71, 59–63. [DOI] [PubMed] [Google Scholar]
- Osswald M, Jung E, Sahm F, Solecki G, Venkataramani V, Blaes J, Weil S, Horstmann H, Wiestler B, Syed M, et al. (2015). Brain tumour cells interconnect to a functional and resistant network. Nature. [DOI] [PubMed] [Google Scholar]
- Pi HJ, Otmakhov N, El Gaamouch F, Lemelin D, De Koninck P, and Lisman J (2010). CaMKII control of spine size and synaptic strength: Role of phosphorylation states and nonenzymatic action. Proc. Natl. Acad. Sci 107, 14437–14442. [DOI] [PMC free article] [PubMed] [Google Scholar]
- Plante I, Stewart MKG, Barr K, Allan AL, and Laird DW (2011). Cx43 suppresses mammary tumor metastasis to the lung in a Cx43 mutant mouse model of human disease. Oncogene 30, 1681–1692. [DOI] [PubMed] [Google Scholar]
- Plotkin LI, and Bellido T (2013). Beyond gap junctions: Connexin43 and bone cell signaling. Bone 52, 157–166. [DOI] [PMC free article] [PubMed] [Google Scholar]
- Prevarskaya N, Skryma R, and Shuba Y (2011). Calcium in tumour metastasis: new roles for known actors. Nat. Rev. Cancer 11, 609–618. [DOI] [PubMed] [Google Scholar]
- Price TT, Burness ML, Sivan A, Warner MJ, Cheng R, Lee CH, Olivere L, Comatas K, Magnani J, Kim Lyerly H, et al. (2016). Dormant breast cancer micrometastases reside in specific bone marrow niches that regulate their transit to and from bone. Sci Transl Med 8, 340ra73. [DOI] [PMC free article] [PubMed] [Google Scholar]
- Rajgopal Govindarajan SC, Johnson KE, Falk MM, Margaret J Wheelock KRJ, And, and Mehta PP (2010). Assembly of Connexin43 into Gap Junctions Is Regulated Differentially by E-Cadherin and N-Cadherin in Rat Liver Epithelial Cells. Mol. Biol. Cell 21, 4325–4337. [DOI] [PMC free article] [PubMed] [Google Scholar]
- Raynal NJM, Lee JT, Wang Y, Beaudry A, Madireddi P, Garriga J, Malouf GG, Dumont S, Dettman EJ, Gharibyan V, et al. (2016). Targeting calcium signaling induces epigenetic reactivation of tumor suppressor genes in cancer. Cancer Res. 76, 1494–1505. [DOI] [PMC free article] [PubMed] [Google Scholar]
- Roscoe W, Veitch GIL, Gong XQ, Pellegrino E, Bai D, McLachlan E, Shao Q, Kidder GM, and Laird DW (2005). Oculodentodigital dysplasia-causing connexin43 mutants are non-functional and exhibit dominant effects on wild-type connexin43. J. Biol. Chem 280, 11458–11466. [DOI] [PubMed] [Google Scholar]
- Ross MH, Esser AK, Fox GC, Schmieder AH, Yang X, Hu G, Pan D, Su X, Xu Y, Novack DV, et al. (2017). Bone-induced expression of integrin β3 enables targeted nanotherapy of breast cancer metastases. Cancer Res. [DOI] [PMC free article] [PubMed] [Google Scholar]
- Sethi N, Dai X, Winter CG, and Kang Y (2011). Tumor-Derived Jagged1 Promotes Osteolytic Bone Metastasis of Breast Cancer by Engaging Notch Signaling in Bone Cells. Cancer Cell 19, 192–205. [DOI] [PMC free article] [PubMed] [Google Scholar]
- Shahbazian MD, Young JI, Yuva-Paylor LA, Spencer CM, Antalffy BA, Noebels JL, Armstrong DL, Paylor R, and Zoghbi HY (2002). Mice with truncated MeCP2 recapitulate many Rett syndrome features and display hyperacetylation of histone H3. Neuron 35, 243–254. [DOI] [PubMed] [Google Scholar]
- Sharma S, Findlay GM, Bandukwala HS, Oberdoerffer S, Baust B, Li Z, Schmidt V, Hogan PG, Sacks DB, and Rao A (2011). Dephosphorylation of the nuclear factor of activated T cells (NFAT) transcription factor is regulated by an RNA-protein scaffold complex. Proc. Natl. Acad. Sci 108, 11381–11386. [DOI] [PMC free article] [PubMed] [Google Scholar]
- Shaw RM, Fay AJ, Puthenveedu MA, von Zastrow M, Jan YN, and Jan LY (2007). Microtubule Plus-End-Tracking Proteins Target Gap Junctions Directly from the Cell Interior to Adherens Junctions. Cell 128, 547–560. [DOI] [PMC free article] [PubMed] [Google Scholar]
- Shen ZX, Chen GQ, Ni JH, Li XS, Xiong SM, Qiu QY, Zhu J, Tang W, Sun GL, Yang KQ, et al. (1997). Use of arsenic trioxide (As2O3) in the treatment of acute promyelocytic leukemia (APL): II. Clinical efficacy and pharmacokinetics in relapsed patients. Blood 89, 3354–3360. [PubMed] [Google Scholar]
- Shibasaki F, Price ER, Milan D, and McKeon F (1996). Role of kinases and the phosphatase calcineurin in the nuclear shuttling of transcription factor NF-AT4. Nature 382, 370–373. [DOI] [PubMed] [Google Scholar]
- Smid M, Wang Y, Zhang Y, Sieuwerts AM, Yu J, Klijn JG, Foekens JA, and Martens JW, (2008). Subtypes of breast cancer show preferential site of relapse. Cancer Res. 68, 3108–3114. [DOI] [PubMed] [Google Scholar]
- Subramanian A, Tamayo P, Mootha VK, Mukherjee S, Ebert BL, Gillette MA, Paulovich A, Pomeroy SL, Golub TR, Lander ES, et al. (2005). Gene set enrichment analysis: A knowledge-based approach for interpreting genome-wide expression profiles. Proc. Natl. Acad. Sci 102, 15545–15550. [DOI] [PMC free article] [PubMed] [Google Scholar]
- Temme A, Buchmann A, Gabriel HD, Nelles E, Schwarz M, and Willecke K (1997). High incidence of spontaneous and chemically induced liver tumors in mice deficient for connexin32. Curr. Biol 7, 713–716. [DOI] [PubMed] [Google Scholar]
- Thebault S, Flourakis M, Vanoverberghe K, Vandermoere F, Roudbaraki M, Lehen’kyi V, Slomianny C, Beck B, Mariot P, Bonnal J-L, et al. (2006). Differential role of transient receptor potential channels in Ca2+ entry and proliferation of prostate cancer epithelial cells. Cancer Res. 66, 2038–2047. [DOI] [PubMed] [Google Scholar]
- Tripathi MK, Deane NG, Zhu J, An H, Mima S, Wang X, Padmanabhan S, Shi Z, Prodduturi N, Ciombor KK, et al. (2014). Nuclear factor of activated T-cell activity is associated with metastatic capacity in colon cancer. Cancer Res. 74, 6947–6957. [DOI] [PMC free article] [PubMed] [Google Scholar]
- Wan L, Pantel K, and Kang Y (2013). Tumor metastasis: moving new biological insights into the clinic. Nat. Med 19, 1450–1464. [DOI] [PubMed] [Google Scholar]
- Wang H, Yu C, Gao X, Welte T, Muscarella AM, Tian L, Zhao H, Zhao Z, Du S, Tao J, et al. (2015). The osteogenic niche promotes early-stage bone colonization of disseminated breast cancer cells. Cancer Cell 27, 193–210. [DOI] [PMC free article] [PubMed] [Google Scholar]
- Wang H, Tian L, Goldstein A, Liu J, Lo H-C, Sheng K, Welte T, Wong STC, Gugala Z, Stossi F, et al. (2017). Bone-in-culture array as a platform to model early-stage bone metastases and discover anti-metastasis therapies. Nat. Commun 8, 15045. [DOI] [PMC free article] [PubMed] [Google Scholar]
- Waning DL, Mohammad KS, Reiken S, Xie W, Andersson DC, John S, Chiechi A, Wright LE, Umanskaya A, Niewolna M, et al. (2015). Excess TGF-β mediates muscle weakness associated with bone metastases in mice. Nat. Med 21, 1262–1271. [DOI] [PMC free article] [PubMed] [Google Scholar]
- Weilbaecher KN, Guise TA, and McCauley LK (2011). Cancer to bone: a fatal attraction. Nat. Rev. Cancer 11, 411–425. [DOI] [PMC free article] [PubMed] [Google Scholar]
- Wu P, Wang Y, Davis ME, Zuckerman JE, Chaudhari S, Begg M, and Ma R (2015). Store-Operated Ca2+ Channels in Mesangial Cells Inhibit Matrix Protein Expression. J. Am. Soc. Nephrol 26, 2691–2702. [DOI] [PMC free article] [PubMed] [Google Scholar]
- Yu C, Wang H, Muscarella A, Goldstein A, Zeng H-C, Bae Y, Lee BHI, and Zhang XH-F (2016). Intra-iliac Artery Injection for Efficient and Selective Modeling of Microscopic Bone Metastasis. J. Vis. Exp 1–7. [DOI] [PMC free article] [PubMed] [Google Scholar]
- Zhang XH-F, Giuliano M, Trivedi MV, Schiff R, and Osborne CK (2013a). Metastasis Dormancy in Estrogen Receptor–Positive Breast Cancer. Clin. Cancer Res 19, 6389–6397. [DOI] [PMC free article] [PubMed] [Google Scholar]
- Zhang XHF, Wang Q, Gerald W, Hudis CA, Norton L, Smid M, Foekens JA, and Massagué J (2009). Latent Bone Metastasis in Breast Cancer Tied to Src-Dependent Survival Signals. Cancer Cell 16, 67–78. [DOI] [PMC free article] [PubMed] [Google Scholar]
- Zhang XHF, Jin X, Malladi S, Zou Y, Wen YH, Brogi E, Smid M, Foekens JA, and Massagué J (2013b). Selection of bone metastasis seeds by mesenchymal signals in the primary tumor stroma. Cell 154, 1060–1073. [DOI] [PMC free article] [PubMed] [Google Scholar]
- Zheng H, Bae Y, Kasimir-Bauer S, Tang R, Chen J, Ren G, Yuan M, Esposito M, Li W, Wei Y, et al. (2017). Therapeutic Antibody Targeting Tumor- and Osteoblastic Niche-Derived Jagged1 Sensitizes Bone Metastasis to Chemotherapy. Cancer Cell 32, 731–747.e6. [DOI] [PMC free article] [PubMed] [Google Scholar]
- Zhu Q, Zhang JW, Zhu HQ, Shen YL, Flexor M, Jia PM, Yu N, Cai X, Waxman S, Lanotte M, et al. (2002). Synergic effects of arsenic trioxide and cAMP during acute promyelocytic leukemia cell maturation subtends a novel signaling crosstalk. Blood 99, 1014–1022. [PubMed] [Google Scholar]
Associated Data
This section collects any data citations, data availability statements, or supplementary materials included in this article.