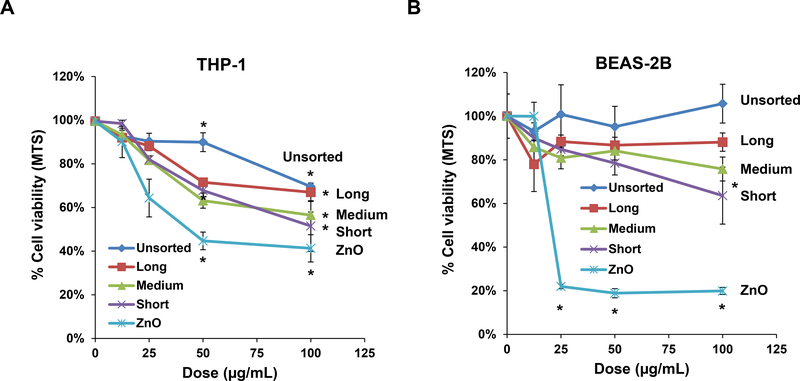
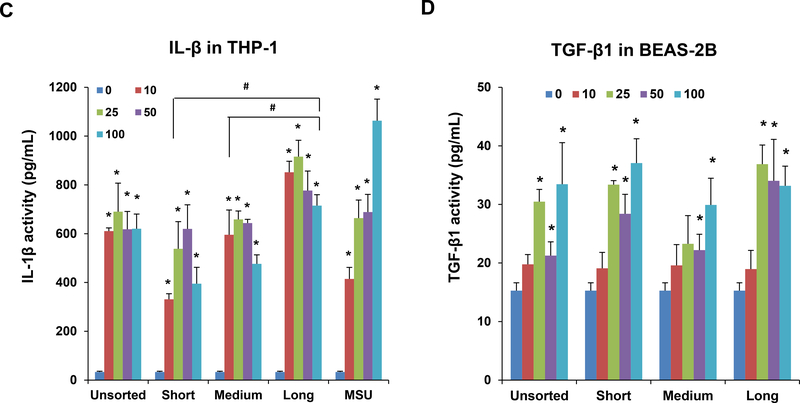
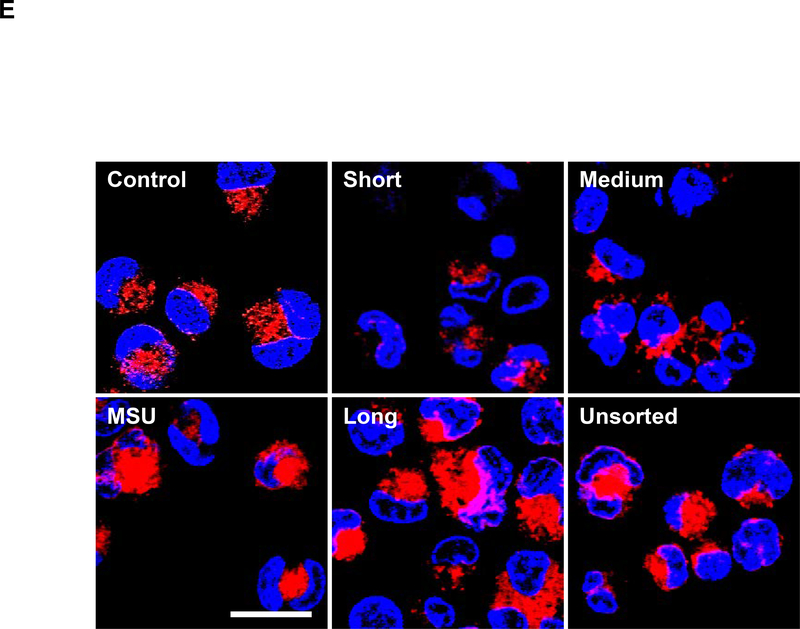
Figure 2: Cytotoxicity and pro-inflammatory cytokine production in THP-1 and BEAS-2B cells exposed to SWCNTs.
The MTS assay was used to assess the cytotoxic effects of SWNCTs in (A) THP-1 and (B) BEAS-2B cells. Both cell types were exposed to 12.5, 25, 50, and 100 μg/mL for each category of sorted and unsorted SWCNTs for 24 h. The media were replaced with the MTS working solution, and following the removal of the supernatants, absorbance was read at 490 nm in a microplate reader (SpectroMax M5e, Molecular Devices, Sunnyvale, CA, USA). All the MTS values were normalized with respect to the non-treated control, which was regarded as representing 100% viability. The supernatants were used to quantify the IL-1β (C) and TGF-β1 (D) levels by ELISA. *p < 0.05 compared to control; # p<0.05 compared between the two groups indicated for all dose levels respectively. (E) Confocal microscopy demonstrating the lysosomal damage in THP-1 cells by Magic Red staining. THP-1 cells were seeded into 8-well chamber slides and incubated with 100 μg/mL of sorted and unsorted SWNCT suspensions in complete RPMI 1640 for 24 h. After fixation and permeabilization, cells were stained with Magic Red (ImmunoChemistry Technologies) and Hoechst 33342 dye, followed by visualization under a confocal 1P/FCS inverted microscope. Monosodium urate (MSU) crystals were used as a positive control, demonstrating that the punctate Magic Red staining seen in intact lysosomes (control cells) changes to diffuse cytosolic fluorescence after damage to the lysosomal membrane. The scale bar represents 2 μm in length.


