Abstract
Hepatocellular carcinoma (HCC) is a major cause of cancer-related death worldwide. Up to date, HCC pathogenesis has not been fully understood. The aim of the present study was to identify crucial genes and pathways associated with HCC by bioinformatics methods. The differentially expressed genes (DEGs) between 14 HCC tissues and corresponding non-cancerous tissues were identified using limma package. Gene Ontology (GO) and KEGG pathway enrichment analysis of DEGs were performed by clusterProfiler package. The protein–protein interaction (PPI) network of DEGs was constructed and visualized by STRING database and Cytoscape software, respectively. The crucial genes in PPI network were identified using a Cytoscape plugin, CytoNCA. Furthermore, the effect of the expression level of the crucial genes on HCC patient survival was analyzed by an interactive web-portal, UALCAN. A total of 870 DEGs including 237 up-regulated and 633 down-regulated genes were identified in HCC tissues. KEGG pathway analysis revealed that DEGs were mainly enriched in complement and coagulation cascades pathway, chemical carcinogenesis pathway, retinol metabolism pathway, fatty acid degradation pathway, and valine, leucine and isoleucine degradation pathway. PPI network analysis showed that CDK1, CCNB1, CCNB2, MAD2L1, ACACB, IGF1, TOP2A, and EHHADH were crucial genes. Survival analysis suggested that the high expression of CDK1, CCNB1, CCNB2, MAD2L1, and TOP2A significantly decreased the survival probability of HCC patients. In conclusion, the identification of the above crucial genes and pathways will not only contribute to elucidating the pathogenesis of HCC, but also provide prognostic markers and therapeutic targets for HCC.
Keywords: hepatocellular carcinoma, Crucial gene, Pathway, Survival analysis
Introduction
Hepatocellular carcinoma (HCC) is the most frequent primary liver malignancy and a major cause of cancer-related death worldwide, especially in developing countries [1]. The mean survival time of HCC patients without intervention is estimated between 6 and 20 months. Although surgical resection, orthotopic liver transplantation, radiofrequency thermal ablation and sorafenib have been used to treat HCC, treatment outcomes are still unsatisfactory due to postsurgical recurrence and drug resistance [2–4]. Therefore, a further investigation into the underlying mechanisms of HCC initiation and progression is urgently needed, which will contribute to the discovery of novel diagnostic and therapeutic targets for HCC.
In the past decades, there have been many reports of genes and pathways involved in HCC initiation and progression [5–8]. For instances, Villanueva et al. [5] used genome-wide methylation profiling not only to discover many genes that are aberrantly methylated in HCC, such as RSSFA1, IGF2, APC, RASSF5, SFRP5, NEFH, SEPT9, EFNB2 and FGF6, but also to point to signaling pathways clearly deregulated by DNA methylation in HCC, such as IGF, PI3K, TGF-b, and WNT signaling pathways. Zhao et al. [6] found that methylation-induced ASPP1 and ASPP2 silence promoted tumor growth in HCC, which might serve as potential treatment targets. Wu et al. [7] observed that the expression level of OCIAD2 in the tumor tissues was much lower than that in the corresponding adjacent normal tissues, and OCIAD2 suppressed tumor growth and invasion via AKT pathway in HCC. Lee et al. [8] found that TonEBP promoted hepatocellular carcinogenesis, recurrence and metastasis, and targeting TonEBP may be an attractive strategy to prevent recurrence as well as hepatocarcinogenesis and metastasis.
Although an increasing number of studies aimed to clarify the molecular mechanism of HCC initiation and progression, the progress of the relevant studies is not obvious. Gene expression microarray technology has been used to simultaneously detect the expression level of thousands of genes in cells and tissues, which helps researchers discover the crucial genes and pathways associated with disease. In the present study, we utilized this high-throughput technology to screen differential expression genes (DEGs) between HCC tissues and corresponding non-cancerous tissues, and then identified the crucial genes and pathways associated with HCC by bioinformatics methods. In addition, the effect of the expression level of the crucial genes on HCC patient survival was evaluated by UALCAN (http://ualcan.path.uab.edu) [9].
Materials and methods
Microarray data
The raw microarray data of GSE84402 including 14 HCC tissues and corresponding non-cancerous tissues were obtained from the Gene Expression Omnibus (GEO) database (http://www.ncbi.nlm.nih.gov/geo/). These data were based on GPL570 platform (Affymetrix Human Genome U133 Plus 2.0 Array) and contributed by Wang et al [10].
Data preprocessing was performed using the affy package V1.56.0 and the Robust Multichip Averaging (RMA) algorithm in R V3.4.4 [11]. The probeset IDs were converted into the corresponding gene symbol using the annotation information derived from platform GPL570. If multiple probe sets correspond to one gene, the mean expression values of those probesets were obtained.
Identification of DEGs
The limma package V3.34.9 in R was used to identify DEGs in HCC tissues compared with corresponding non-cancerous tissues [12]. The t test and Benjamini–Hochberg method were used to calculate the P-value and FDR, respectively. The DEGs were screened out according to adjusted P-value <0.05 and | logFC | ≥1.
Gene Ontology (GO) and pathway enrichment analysis of DEGs
The clusterProfiler V3.6.0 is an ontology-based R package that not only automates the process of biological-term classification and the enrichment analysis of gene clusters, but also provides a visualization module for displaying analysis results [13]. In the present study, the clusterProfiler package was used to identify and visualize the GO terms and KEGG pathways enriched by DEGs. P-value <10−6 was set as the cut-off criterion for the significant enrichment.
Analysis of the protein–protein interaction (PPI) network of DEGs
STRING database (www.string-db.org) collected and integrated known and predicted protein–protein association data for a large number of organisms, including Homo sapiens [14]. In the present study, STRING was used to construct the PPI network of DEGs with minimum required interaction score 0.7. Cytoscape software V3.5.1 was used to display the PPI network [15]. CytoNCA V2.1.6 was a cytoscape plugin for centrality analysis of protein interaction networks, which could be utilized to identify crucial nodes (genes) in the network [16]. In the present study, the crucial genes were identified based on four different centrality measures, including eigenvector centrality (EGC), degree centrality (DC), betweenness centrality (BC), and closeness centrality (CC). According to the centrality values of genes in the PPI network, the top 3 ranked genes were identified as the crucial genes.
The effect of the expression level of the crucial genes on HCC patient survival
UALCAN is a user-friendly, interactive web resource for analyzing cancer transcriptome data from The Cancer Genome Atlas (TCGA). It uses TCGA level 3 RNA-seq and clinical data from 31 cancer types to carry out the following work: (a) analyze relative expression of genes across tumor and normal samples, as well as in various tumor sub-groups based on individual cancer stages, tumor grade, race, body weight, or other clinicopathologic features; (b) assess the effect of gene expression level and clinicopathologic features on patient survival; and (c) identify the top up- and down-regulated genes in individual cancer types. In the present study, it was utilized not only to validate the expression level of the crucial genes, but also to estimate the effect of the expression level of the crucial genes on HCC patient survival by Kaplan–Meier curve and Log-rank test.
Results
Identification of DEGs
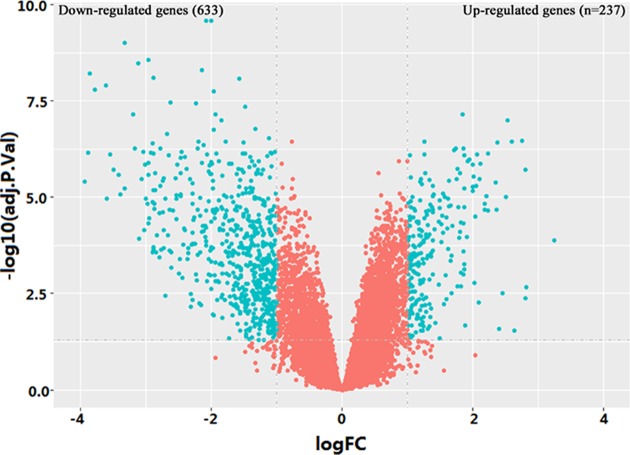
A total of 870 DEGs were identified, including 237 up-regulated genes and 633 down-regulated genes in HCC tissues (Figure 1). The top 10 up-regulated DEGs were GPC3, CTHRC1, GINS1, PEG10, TOP2A, SPINK1, CDKN3, CCNB1, RRM2, and TRIM71. The top 10 down-regulated DEGs were SLC22A1, MT1M, GYS2, OIT3, FCN3, APOF, LINC00844, GBA3, CRHBP, and CYP1A2 (Table 1).
Figure 1. Volcano plot of microarray data (upper-left and upper-right blue dots stand for down- and up-regulated genes in HCC, respectively.
Table 1. The top 10 up- and down-regulated genes in HCC.
| Gene symbol | logFC | adj.P.Val | Expression | Gene symbol | logFC | adj.P.Val | Expression |
|---|---|---|---|---|---|---|---|
| GPC3 | 3.24 | 0.00013 | up | SLC22A1 | -4.14 | 2.60E-06 | down |
| CTHRC1 | 2.82 | 0.0021 | up | MT1M | -3.93 | 3.94E-06 | down |
| GINS1 | 2.80 | 1.89E-06 | up | GYS2 | -3.87 | 7.10E-07 | down |
| PEG10 | 2.80 | 0.0042 | up | OIT3 | -3.85 | 6.20E-09 | down |
| TOP2A | 2.75 | 3.50E-07 | up | FCN3 | -3.77 | 1.60E-08 | down |
| SPINK1 | 2.63 | 0.028 | up | APOF | -3.60 | 1.23E-08 | down |
| CDKN3 | 2.60 | 3.64E-07 | up | LINC00844 | -3.59 | 1.10E-05 | down |
| CCNB1 | 2.53 | 1.01E-07 | up | GBA3 | -3.54 | 7.87E-07 | down |
| RRM2 | 2.50 | 1.01E-05 | up | CRHBP | -3.49 | 1.93E-06 | down |
| TRIM71 | 2.45 | 0.0030 | up | CYP1A2 | -3.41 | 2.68E-06 | down |
GO and KEGG pathway enrichment analysis of DEGs
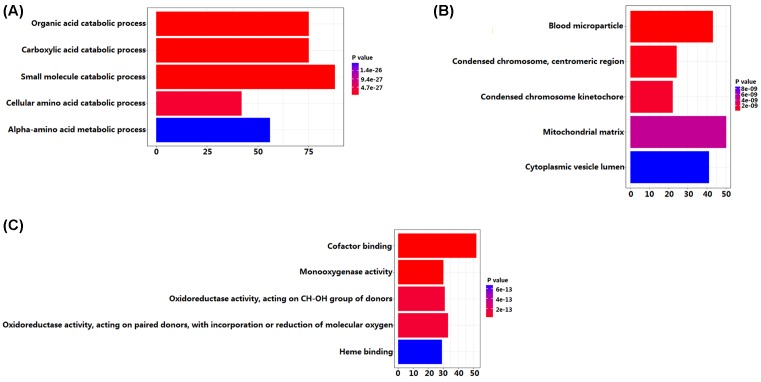
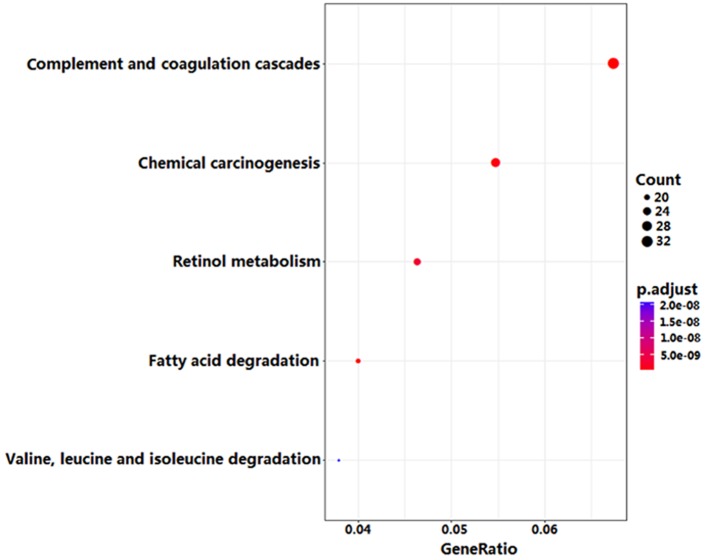
GO enrichment analysis showed that DEGs were significantly enriched in 79 biological processes (BPs), 17 molecule functions (MFs) and 9 cellular components (CCs). The top 5 BPs included ‘organic acid catabolic process’, ‘carboxylic acid catabolic process’, ‘small molecule catabolic process’, ‘cellular amino acid catabolic process’, and ‘alpha-amino acid metabolic process’. The top 5 MFs included ‘cofactor binding’, ‘monooxygenase activity’, ‘oxidoreductase activity, acting on CH-OH group of donors’, ‘oxidoreductase activity, acting on paired donors, with incorporation or reduction of molecular oxygen’, and ‘heme binding’. The top 5 CCs included ‘blood microparticle’, ‘condensed chromosome, centromeric region’, ‘condensed chromosome kinetochore’, ‘mitochondrial matrix’, and ‘cytoplasmic vesicle lumen’ (Figure 2). Furthermore, KEGG pathway enrichment analysis indicated that DEGs were significantly enriched in 11 pathways. The top 5 pathways included ‘complement and coagulation cascades pathway’, ‘chemical carcinogenesis pathway’, ‘retinol metabolism pathway’, ‘fatty acid degradation pathway’ and ‘valine, leucine and isoleucine degradation pathway’ (Figure 3).
Figure 2. The top 5 GO terms enriched by DEGs (A, biological process; B, cellular component; C, molecule function).
Figure 3. The top 5 KEGG pathways enriched by DEGs.
PPI network of DEGs
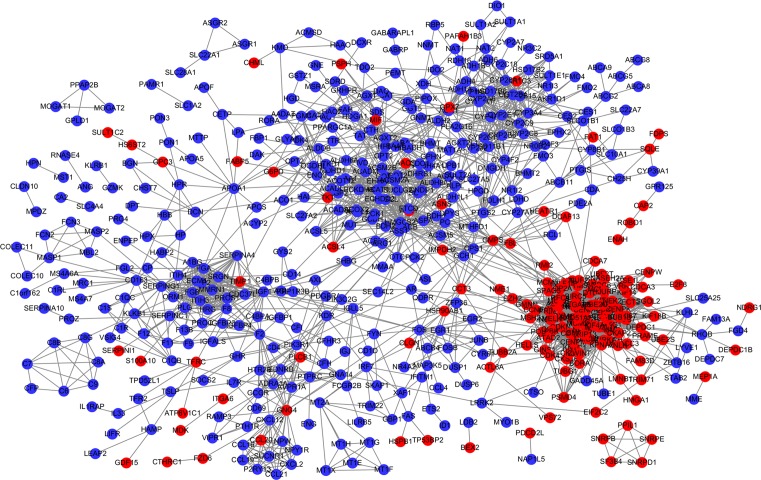
The PPI network of DEGs were constructed, including 556 nodes (genes) and 3570 edges (interactions) (Figure 4). The centrality analysis of nodes in the PPI network showed that CDK1, CCNB1, CCNB2, MAD2L1, ACACB, IGF1, TOP2A, and EHHADH were crucial genes (Table 2). Therein the expression levels of CDK1, CCNB1, CCNB2, MAD2L1, and TOP2A were up-regulated in HCC. The expression levels of ACACB, IGF1, and EHHADH were down-regulated in HCC.
Figure 4. PPI network plot of DEGs (red and blue nodes stand for up- and down- regulated genes in HCC, respectively).
Table 2. The top 3 genes ranked by the node centrality of the PPI network.
| Rank | Eigenvector centrality | Degree centrality | Betweenness centrality | Closeness centrality | ||||
|---|---|---|---|---|---|---|---|---|
| Gene symbol | Expression in HCC | Gene symbol | Expression in HCC | Gene symbol | Expression in HCC | Gene symbol | Expression in HCC | |
| 1 | CDK1 | up-regulated | CDK1 | up-regulated | ACACB | down-regulated | ACACB | down-regulated |
| 2 | CCNB1 | up-regulated | MAD2L1 | up-regulated | IGF1 | down-regulated | TOP2A | up-regulated |
| 3 | CCNB2 | up-regulated | CCNB1 | up-regulated | EHHADH | down-regulated | EHHADH | down-regulated |
Validation of the expression level of the crucial genes
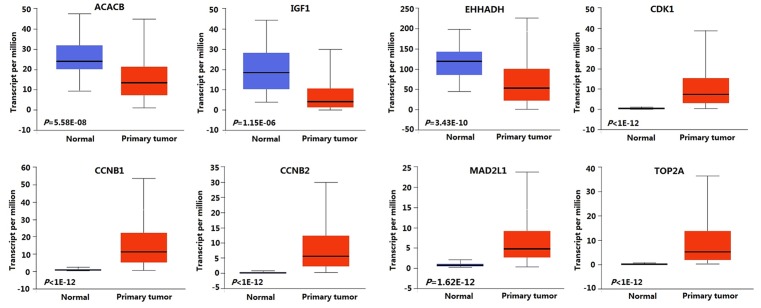
UALCAN was used to validate the expression level of the crucial genes. The results showed that ACACB, IGF1, and EHHADH were significantly down-regulated in HCC, and CDK1, CCNB1, CCNB2, MAD2L1, and TOP2A were significantly up-regulated in HCC, which was consistent with the microarray results (Figure 5).
Figure 5. Boxplots showing the expression level of crucial genes in normal and HCC samples.
The effect of the expression level of the crucial genes on HCC patient survival
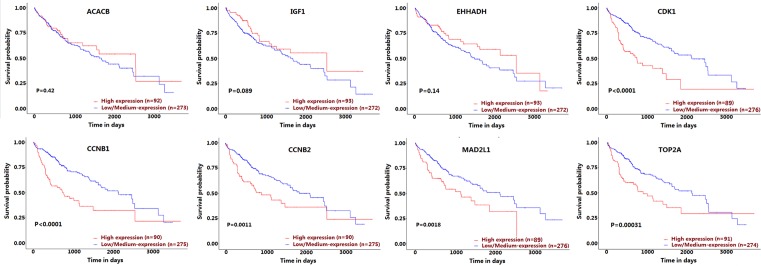
Survival analysis based on TCGA data showed that the high expression of CDK1, CCNB1, CCNB2, MAD2L1, and TOP2A genes significantly decreased the survival probability of HCC patients (Figure 6).
Figure 6. Kaplan–Meier plots showing the association of the expression level of crucial genes with HCC patient survival.
Discussion
In the present study, we explored the crucial genes and pathway associated with HCC by bioinformatics methods. By comparing gene expression profiles between 14 HCC tissues and corresponding non-cancerous tissues, we found 870 DEGs, including 237 up-regulated genes and 633 down-regulated genes in HCC tissues. Subsequently, GO and KEGG pathway enrichment analysis were performed to understand the biological functions of DEGs and pathways associated with HCC. GO analysis showed that DEGs were mainly involved in ‘organic acid catabolic process’, ‘carboxylic acid catabolic process’, ‘small molecule catabolic process’, ‘cellular amino acid catabolic process’, ‘alpha-amino acid metabolic process’, ‘cofactor binding’, ‘monooxygenase activity’, ‘oxidoreductase activity, acting on CH-OH group of donors’, ‘oxidoreductase activity, acting on paired donors, with incorporation or reduction of molecular oxygen’, and ‘heme binding’. KEGG pathway analysis showed that DEGs were mainly enriched in the following five pathways: ‘complement and coagulation cascades pathway’, ‘chemical carcinogenesis pathway’, ‘retinol metabolism pathway’, ‘fatty acid degradation pathway’, and “valine, leucine and isoleucine degradation pathway’.
According to the centrality of nodes in the PPI network, we identified the crucial DEGs, including CDK1, CCNB1, CCNB2, MAD2L1, ACACB, IGF1, TOP2A, and EHHADH. Subsequently, the expression level of the crucial genes was further validated based on TCGA data. ACACB, IGF1, and EHHADH were significantly down-regulated in HCC, and CDK1, CCNB1, CCNB2, MAD2L1, and TOP2A were significantly up-regulated in HCC, which was consistent with the microarray results. In these crucial genes, CDK1, CCNB1, CCNB2, MAD2L1, IGF1, TOP2A, and EHHADH had also been reported to be associated with HCC initiation and progression. Zhao et al. [17] found that CDK1 played an important role in the regulation of apoptin-induced apoptosis of HCC cells. Gao et al. [18] demonstrated that KPNA2 could accelerate cell cycle progression by up-regulating the expression of CCNB2 and CDK1 in HCC. Sun et al. [19] confirmed that the overexpression of p42.3 could up-regulate the expression of PCNA, CCNB1 and MAD2L1, and promote cell growth and tumorigenicity in HCC. Tang et al. [20] found that CAV1 conferred resistance of hepatoma cells to anoikis by activating IGF-1 pathway, providing a potential therapeutic target for HCC metastasis. Wong et al. [21] found that TOP2A overexpression in HCC correlated with early age onset, shorter patients survival, and chemoresistance. Suto et al. [22] observed decreased expression of EHHADH in HCC by the immunohistochemical staining technique. Although the role of ACACB in HCC was still not reported, previous studies indicated that ACACB played an important role in the initiation and progression of other cancers [23–25]. For instance, Jeon et al. [23] found that knockdown of ACACB could compensate for AMPK activation and facilitate anchorage-independent growth and solid tumor formation in vivo, whereas the activation of ACACB could attenuate these processes. Ho et al. [24] observed that the expression level of ACACB was significantly different between osteosarcoma and normal bone samples. The above findings suggested that ACACB might be a novel gene associated with HCC. To explore prognostic biomarkers for HCC, we utilized UALCAN to analyze the effect of the expression level of the crucial genes on HCC patient survival, and found that the high expressions of CDK1, CCNB1, CCNB2, MAD2L1, and TOP2A were associated with poor survival of HCC patients.
Taken together, our study finds the crucial genes and pathways associated with HCC, which will not only contribute to elucidating the pathogenesis of HCC, but also provide prognostic markers and therapeutic targets for HCC.
Abbreviations
- DEG
differentially expressed gene
- HCC
hepatocellular carcinoma
- PPI
protein–protein interaction
Author Contribution
Xueren Gao designed this study and wrote the manuscript. Xixi Wang and Shulong Zhang performed the statistical analysis.
Funding
The authors declare that there are no sources of funding to be acknowledged.
Competing Interests
The authors declare that there are no competing interests associated with the manuscript.
References
- 1.El-Serag H.B. (2012) Epidemiology of viral hepatitis and hepatocellular carcinoma. Gastroenterology 142, 1264–1273 10.1053/j.gastro.2011.12.061 . [DOI] [PMC free article] [PubMed] [Google Scholar]
- 2.Wang C.H., Wey K.C., Mo L.R., Chang K.K., Lin R.C. and Kuo J.J. (2015) Current trends and recent advances in diagnosis, therapy, and prevention of hepatocellular carcinoma. Asian Pac. J. Cancer Prev. 16, 3595–3604 10.7314/APJCP.2015.16.9.3595 . [DOI] [PubMed] [Google Scholar]
- 3.Tsoulfas G., Kawai T., Elias N., Ko S.C., Agorastou P., Cosimi A.B.. et al. (2011) Long-term experience with liver transplantation for hepatocellular carcinoma. J. Gastroenterol. 46, 249–256 10.1007/s00535-010-0302-9 . [DOI] [PubMed] [Google Scholar]
- 4.Liang Y., Zheng T., Song R., Wang J., Yin D., Wang L.. et al. (2013) Hypoxia-mediated sorafenib resistance can be overcome by EF24 through Von Hippel-Lindau tumor suppressor-dependent HIF-1α inhibition in hepatocellular carcinoma. Hepatology 57, 1847–1857 10.1002/hep.26224 . [DOI] [PubMed] [Google Scholar]
- 5.Villanueva A., Portela A., Sayols S., Battiston C., Hoshida Y., Méndez-González J.. et al. (2015) DNA methylation-based prognosis and epidrivers in hepatocellular carcinoma. Hepatology 61, 1945–1956 10.1002/hep.27732 . [DOI] [PubMed] [Google Scholar]
- 6.Zhao J., Wu G., Bu F., Lu B., Liang A., Cao L.. et al. (2010) Epigenetic silence of ankyrin-repeat-containing, SH3-domain-containing, and proline-rich-region- containing protein 1 (ASPP1) and ASPP2 genes promotes tumor growth in hepatitis B virus-positive hepatocellular carcinoma. Hepatology 51, 142–153 10.1002/hep.23247 . [DOI] [PubMed] [Google Scholar]
- 7.Wu D., Yang X., Peng H., Guo D., Zhao W., Zhao C.. et al. (2017) OCIAD2 suppressed tumor growth and invasion via AKT pathway in Hepatocelluar carcinoma. Carcinogenesis 38, 910–919 10.1093/carcin/bgx073 . [DOI] [PMC free article] [PubMed] [Google Scholar]
- 8.Lee J.H., Suh J.H., Choi S.Y., Kang H.J., Lee H.H., Ye B.J.. et al. (2018) Tonicity-responsive enhancer-binding protein promotes hepatocellular carcinogenesis, recurrence and metastasis. Gut, in press 10.1136/gutjnl-2017-315348. [DOI] [PMC free article] [PubMed] [Google Scholar]
- 9.Chandrashekar D.S., Bashel B., Balasubramanya S.A.H., Creighton C.J., Ponce-Rodriguez I., Chakravarthi B.V.S.K.. et al. (2017) UALCAN: a portal for facilitating tumor subgroup gene expression and survival analyses. Neoplasia 19, 649–658 10.1016/j.neo.2017.05.002 . [DOI] [PMC free article] [PubMed] [Google Scholar]
- 10.Wang H., Huo X., Yang X.R., He J., Cheng L., Wang N.. et al. (2017) STAT3-mediated upregulation of lncRNA HOXD-AS1 as a ceRNA facilitates liver cancer metastasis by regulating SOX4. Mol. Cancer 16, 136 10.1186/s12943-017-0680-1 . [DOI] [PMC free article] [PubMed] [Google Scholar]
- 11.Gautier L., Cope L., Bolstad B.M. and Irizarry R.A. (2004) affy–analysis of Affymetrix GeneChip data at the probe level. Bioinformatics 20, 307–315 10.1093/bioinformatics/btg405 . [DOI] [PubMed] [Google Scholar]
- 12.Ritchie M.E., Phipson B., Wu D., Hu Y., Law C.W., Shi W.. et al. (2015) limma powers differential expression analyses for RNA-sequencing and microarray studies. Nucleic Acids Res. 43, e47 10.1093/nar/gkv007 . [DOI] [PMC free article] [PubMed] [Google Scholar]
- 13.Yu G., Wang L.G., Han Y. and He Q.Y. (2012) clusterProfiler: an R package for comparing biological themes among gene clusters. OMICS 16, 284–287 10.1089/omi.2011.0118 . [DOI] [PMC free article] [PubMed] [Google Scholar]
- 14.Szklarczyk D., Morris J.H., Cook H., Kuhn M., Wyder S., Simonovic M.. et al. (2017) The STRING database in 2017: quality-controlled protein-protein association networks, made broadly accessible. Nucleic Acids Res. 45, D362–D368 10.1093/nar/gkw937 . [DOI] [PMC free article] [PubMed] [Google Scholar]
- 15.Shannon P., Markiel A., Ozier O., Baliga N.S., Wang J.T., Ramage D.. et al. (2003) Cytoscape: a software environment for integrated models of biomolecular interaction networks. Genome Res. 13, 2498–2504 10.1101/gr.1239303 . [DOI] [PMC free article] [PubMed] [Google Scholar]
- 16.Tang Y., Li M., Wang J., Pan Y. and Wu F.X. (2015) CytoNCA: a cytoscape plugin for centrality analysis and evaluation of protein interaction networks. Biosystems 127, 67–72 10.1016/j.biosystems.2014.11.005 . [DOI] [PubMed] [Google Scholar]
- 17.Zhao J., Han S.X., Ma J.L., Ying X., Liu P., Li J.. et al. (2013) The role of CDK1 in apoptin-induced apoptosis in hepatocellular carcinoma cells. Oncol. Rep. 30, 253–259 10.3892/or.2013.2426 . [DOI] [PubMed] [Google Scholar]
- 18.Gao C.L., Wang G.W., Yang G.Q., Yang H. and Zhuang L. (2018) Karyopherin subunit-α 2 expression accelerates cell cycle progression by upregulating CCNB2 and CDK1 in hepatocellular carcinoma. Oncol Lett. 15, 2815–2820 . [DOI] [PMC free article] [PubMed] [Google Scholar]
- 19.Sun W., Dong W.W., Mao L.L., Li W.M., Cui J.T., Xing R.. et al. (2013) Overexpression of p42.3 promotes cell growth and tumorigenicity in hepatocellular carcinoma. World J. Gastroenterol. 19, 2913–2920 10.3748/wjg.v19.i19.2913 . [DOI] [PMC free article] [PubMed] [Google Scholar]
- 20.Tang W., Feng X., Zhang S., Ren Z., Liu Y., Yang B.. et al. (2015) Caveolin-1 confers resistance of hepatoma cells to anoikis by activating IGF-1 pathway. Cell. Physiol. Biochem. 36, 1223–1236 10.1159/000430292 . [DOI] [PubMed] [Google Scholar]
- 21.Wong N., Yeo W., Wong W.L., Wong N.L., Chan K.Y., Mo F.K.. et al. (2009) TOP2A overexpression in hepatocellular carcinoma correlates with early age onset, shorter patients survival and chemoresistance. Int. J. Cancer 124, 644–652 10.1002/ijc.23968 . [DOI] [PubMed] [Google Scholar]
- 22.Suto K., Kajihara-Kano H., Yokoyama Y., Hayakari M., Kimura J., Kumano T.. et al. (1999) Decreased expression of the peroxisomal bifunctional enzyme and carbonyl reductase in human hepatocellular carcinomas. J. Cancer Res. Clin. Oncol. 125, 83–88 10.1007/s004320050246 . [DOI] [PubMed] [Google Scholar]
- 23.Jeon S.M., Chandel N.S. and Hay N. (2012) AMPK regulates NADPH homeostasis to promote tumour cell survival during energy stress. Nature 485, 661–665 10.1038/nature11066 . [DOI] [PMC free article] [PubMed] [Google Scholar]
- 24.Ho X.D., Phung P., Q, Le V., H, Nguyen V., Reimann E., Prans E.. et al. (2017) Whole transcriptome analysis identifies differentially regulated networks between osteosarcoma and normal bone samples. Exp. Biol. Med.wood) 242, 1802–1811 10.1177/1535370217736512 . [DOI] [PMC free article] [PubMed] [Google Scholar]
- 25.Ding Z.H., Qi J., Shang A.Q., Zhang Y.J., Wei J., Hu L.Q.. et al. (2017) Docking of CDK1 with antibiotic drugs revealed novel therapeutic value in breast ductal cancer in situ. Oncotarget 8, 61998–62010 . [DOI] [PMC free article] [PubMed] [Google Scholar]


