

Abstract
It is generally accepted that infants initially discriminate native and non-native contrasts and that perceptual reorganization within the first year of life results in decreased discrimination of non-native contrasts, and improved discrimination of native contrasts. However, recent findings from Narayan and colleagues (2010) surprisingly suggested that some acoustically subtle native-language contrasts might not be discriminated until the end of the first year of life. We first provide countervailing evidence that young English-learning infants can discriminate the Filipino contrast tested by Narayan et al. when tested in a more sensitive paradigm. Next, we show that young infants learning either English or French can also discriminate comparably subtle non-native contrasts from Tamil. These findings show that Narayan et al.’s null findings were due to methodological choices and indicate that young infants are sensitive to even subtle acoustic contrasts that cue phonetic distinctions cross-linguistically. Based on experimental results and acoustic analyses, we argue that instead of specific acoustic metrics, infant discrimination results themselves are the most informative about the salience of phonetic distinctions.
Introduction
Infants’ perceptual system undergoes a gradual reorganization as a result of their native language experience. In the first half of the first year of life, infants discriminate a wide range of native and non-native phonetic contrasts (Anderson et al., 2003; Eimas, 1974, 1975; Eimas et al., 1971; Jusczyk, 1997; Streeter, 1976; Trehub, 1976; Werker et al., 1981; Werker & Tees, 1984, 1999). Language experience then serves to maintain (Anderson et al., 2003; Best, 1995; Kuhl, 1998; Tsushima et al., 1994; Werker & Tees, 1984), or enhance the perception of native language categories (Kuhl et al., 2006; Polka et al., 2001; Rivera-Gaxiola et al., 2005; Sundara et al., 2006; Tsao et al., 2006), or realign boundaries between phonetic categories (Aslin et al., 1981; Burns et al., 2007). At the same time, infants’ ability to discriminate non-native contrasts declines, in some cases because one or more of the sounds are absent in the native input (Anderson et al., 2003; Kuhl et al., 2006; Werker & Tees, 1984), in others because the distributions of the phonetic forms overlap in the native language (Feldman et al., 2013). Together these developmental patterns are best explained by Attunement theories of perceptual development (Aslin & Pisoni, 1980; Aslin, Werker & Morgan, 2002), where language experience serves to modify existing category boundaries, but not to induce them.
Recently, Narayan, Werker & Beddor (2010) presented a novel developmental pattern in the perception of phonetic categories. They showed that English- and Filipino-learning 6- to 8-month-olds discriminate Filipino /ma/-/na/, but not the subtle /na/-/ŋa/ contrast. Younger infants, English-learning 4- to 5-month-olds as well, successfully discriminated /ma/-/na/, but not /na/-/ŋa/. Only Filipino-learning 10- to 12-month-olds, who are exposed to /ŋ/ in syllable-initial position, the position in which infants were tested, succeeded at this task. Based on these results, Narayan et al. claim that only with language experience are infants able to distinguish subtle phonetic contrasts like Filipino /na/-/ŋa/.
Although Narayan et al.’s (2010) data clearly show that discrimination improves with language experience, their claim that such experience is necessary for discrimination is problematic on methodological grounds. Narayan et al. use a habituation procedure to test infants, but interpreting null results from habituation procedures is known to be problematic (e.g., Werker et al., 1998). Infants get one trial to demonstrate discrimination; and the novelty of the new stimulus itself is their only reward. For this reason, habituation procedures are not typically used to assess the limits of infants’ discrimination abilities.
To compound matters, Narayan et al. (2010) used a non-infant-controlled procedure in which stimuli were presented for fixed periods of time, regardless of the infant’s behavior. Procedures that use looking time to assess preference implicitly assume that subjects recognize a contingency between their own looking behavior and stimulus presentation. In studies of visual preference (e.g., Fantz, 1958, 1964), this is straightforward: looking away removes the stimulus from the visual field. Studies of auditory preference face additional complications: in everyday life, averting one’s gaze does not cause sound to stop. As a result, a variety of procedures have been devised to facilitate infants’ understanding of within-experiment contingencies between looking and auditory stimuli. For example, in conditioned head turn procedures (Werker, Polka, & Pegg, 1997), looking while hearing a particular stimulus is required for reinforcement, whereas in infant-controlled preference procedures, the auditory stimuli for a trial stop shortly after the infant looks away from a central screen. By contrast, in non-infant-controlled procedures there is no such facilitation. Under such conditions, some infants may grasp the contingency, and others may not. A failure by some infants to learn the contingency is likely to yield significant differences for robust effects but not more subtle ones.
Narayan et al.’s (2010) claims are also problematic for theoretical reasons. A developmental time course where the ability to distinguish certain contrasts is induced by language experience is prima facie consistent with Learning theories of perceptual development (Aslin & Pisoni, 1980; Aslin, Werker & Morgan, 2002). However, Narayan et al. claim that their findings support Attunement theories. They do so by arguing that infants are initially sensitive to coarse but not fine differences in a two-dimensional acoustic space and refine these abilities only with language experience. This initial coarse sensitivity allows them to discriminate /ma/-/na/ but not the subtle /na/-/ŋa/ contrast. Thus, Narayan et al. blur the distinction between Perceptual Learning and Attunement theories.
In Experiment 1, we reassess Narayan et al.’s (2010) claim that young infants are unable to distinguish /na/-/ŋa/ without language experience. In Experiment 2, we test young infants on two additional subtle phonetic contrasts - dental vs. retroflex place differences for nasals (/n̪/-/ɳ/) and laterals (/l/-/ɭ/). Our results show that 6-month-olds successfully discriminate all three subtle phonetic contrasts, even in the absence of language experience. Our findings are best explained by Attunement Theories where language experience serves to maintain or modify existing categories, but not to induce them. Nonetheless, these contrasts are not equally easy for infants to discriminate (see also Aslin et al., 2002). In Experiment 3, we explore alternative ways to compare the psychoacoustic salience of contrasts.
Experiment 1
In Experiment 1, we tested the hypothesis that the younger infants tested by Narayan et al. (2010) failed due to methodological reasons. Like Narayan et al. we used visual habituation; however, its implementation was different in three ways. Most importantly, we used a fully infant-controlled paradigm unlike Narayan et al.’s implementation, which was not contingent on infant looking. To provide greater opportunity for infants’ understanding of the looking-hearing contingency, we used a more stringent habituation criterion (50% vs. 60%). We also included longer habituation trials (19 s vs. 14 s), more tokens (15 vs. 9) and a somewhat shorter ISI (800 ms vs. 1000 ms). We tested English-learning 6-month-olds as well as 4-month-olds on Narayan et al.’s stimuli.
Materials and methods
Participants
Two groups of English-learning infants, 22 4-month-olds (12 girls, mean age: 4;10, range: 3;21 – 4;27) and 22 6-month-olds (11 girls, mean age: 6;0, range: 5;12 – 6;21) participated in the study. Only infants with at least 90% exposure to English on a parental language questionnaire were included. English-learning 4-month-olds had an average of 99.5% exposure to English. The other languages these infants were exposed to was Spanish (6) and Hungarian (1). English-learning 6-month-olds had an average of 98.4% exposure to English. The other language(s) these infants were exposed to were Spanish (3), Farsi (2), Italian (1) and Filipino (1). Eleven additional infants were tested but excluded because the parent moved the infant out of camera view (2), fussiness/crying (5), never looking at the screen (1), not habituating in 25 trials (1) or not dishabituating to the post-test trial (2).
Stimuli
Three tokens each of /na/ and /ŋa/ produced by the female Filipino speaker used by Narayan et al. (2010) served as stimuli for this experiment. The acoustic properties of these syllables are presented in Figure 1. We generated 19-second stimulus files, each containing five instances of the three exemplars in random order (15 tokens) with an average inter-stimulus-interval (ISI) of 801 ms (range 649:958).
Figure 1.

F2 and F3 frequencies measured at consonant-vowel juncture for dental (Dna, Dla) and retroflex (Rna, Rla) Tamil nasals and laterals. Additionally, the nasals (ma, na, nga) from Narayan et al.’s study are presented for reference.
Procedure
Infants sat on their caregiver’s lap facing a monitor in a soundproof booth. Loudspeakers were located below the screen on each side, and a video camera filmed the infant’s behavior. An experimenter observed the infant from an adjacent control room on a monitor connected to the camera. Stimulus presentation was controlled by Habit X (Cohen, Atkinson & Chaput, 2004).
A fully infant-controlled version of the visual fixation procedure (Werker et al., 1998; Sundara & Scutellaro, 2011) was used to test infants. At the beginning of each trial, a looming bulls-eye appeared on the monitor to attract the infant’s attention. Once the infant looked at the attention-getter, a black-and-white checkerboard appeared, accompanied by auditory stimuli. Infants’ listening time was recorded manually on-line. Trial length was infant-controlled, ending when the infant looked away from the screen for more than one second or at the end of the trial (max = 19 sec). Trials with listening times less than two seconds were repeated. The attention-getter reappeared at the beginning of each new trial. Throughout testing, the caregiver and the experimenter listened to music over sound-attenuating headphones.
The experiment comprised four phases: pre-test, habituation, test, and post-test. Pre- and post-tests consisted of a single trial in which infants listened to a female voice repeating the syllable ‘pok’; these trials were used to assess participants’ general interest in the task. Infants who failed to dis-habituate to the post-test trial (that is, did not listen longer to the “pok” trial compared to the average of the last 3 habituation trials) were excluded from analysis, as is standard practice.
During the habituation phase, half the infants heard /na/ while the other half heard /ŋa/. Habituation continued until the listening time for the last three consecutive trials dropped below 50% of the listening time to the longest three consecutive trials. Infants who failed to reach the habituation criterion within 25 trials were excluded from the analysis. During the test phase, two trials were presented: a “no-change” trial, in which infants heard tokens belonging to the no-change category to which they had been habituated, and a “change” trial, in which infants were presented with tokens belonging to the other category. The order of presentation of “no-change” and “change” trials was counterbalanced across infants.
Results & Discussion
Infants’ mean listening times during pre-test, post-test and habituation trials, as well as the mean number of trials to habituation are presented in Table 1. Infants’ habituation times were compared in a two-tailed independent samples t-test and showed, unsurprisingly, that 4-month-olds took longer to habituate than 6-month-olds (p=0.001).
Table 1.
Average listening times to habituation, pre-, post-test stimuli (sec) and number of trials to habituate, English-learning 4- and 6-month-olds tested on Narayan et al.’s Filipino contrast in Experiment 1. Standard errors are shown in parentheses.
| Narayan et al.’s Filipino /na/-/ŋa/ contrast | ||
|---|---|---|
|
| ||
| English 4-month-olds | English 6-month-olds | |
| Pre-test | 13.6 (0.6) | 11.4 (0.9) |
| Habituation time | 120.9 (10.2) | 77 (7.5) |
| Trials to habituate | 11.5 (0.8) | 11.2 (0.8) |
| Post-test | 11.8 (1.0) | 11.2 (1.5) |
Listening times to no-change and change trials are presented in Figure 2. Infant listening time (ms) was analyzed using a linear mixed effects regression model, lmer, with the lme4 package in R version 3.3.0 (Bates, Maechler, Bolker, & Walker, 2015). Model comparison was done using likelihood ratio tests. Model fit is reported using marginal and conditional R2 (Nakagawa & Schielzeth, 2013) generated using piecewise SEM (Lefcheck, 2015).
Figure 2.

Average listening time (sec, ±SE) to no-change and change trials for English-learning 4- and 6-month-olds tested on Narayan et al’s Filipino contrast.
The full model included the fixed effects of Age (4-mo~6-mo) and Habituation Stimuli (alveolar~velar) and crucially, Trial-Type (No-Change~Change); it also included all two-way interactions and the three-way interaction. The model also included a random intercept for each subject. This random intercept allowed us to factor in the variation in baseline listening times across infants. In the full model, the fixed effects alone in the model accounted for 23% of the variance (marginal R2), and the fixed and random effects together accounted for 55% of the variance (conditional R2).
Habituation Stimuli (and its interactions) did not contribute significantly to model fit, χ2(4) = 4.2, p =0.4. Age, however, did. Specifically, while removing the interactions involving Age did not reduce model fit, χ2(3) = 1.9, p =0.58, removing the main effect of Age significantly reduced model fit, both when compared to the full model, χ2(4) = 14, p =0.007 and when compared to a reduced model without the interactions with Age, χ2(1) = 12, p =0.0005. In the model without Age and its interactions, the fixed effects alone accounted for 6.4% of the variance (marginal R2), whereas together, the fixed and random effects accounted for 54% of the variance (conditional R2). The effect of Age can be seen in Figure 2 – 6-month-olds have much shorter overall listening times than 4-month-olds.
Note that contrast discrimination is demonstrated by a significant increase in listening time during the presentation of the change trial compared to the no-change trial. Removing just the interactions of Trial-Type did not reduce model fit, χ2(3) = 4.5, p =0.20. Crucially, removing the main effect of Trial-Type significantly reduced model fit. This reduction in fit was observed both when compared to the full model, χ2(4) = 13, p =0.01 and when compared to a reduced model without interactions involving Trial-Type, χ2(1) = 8.5, p =0.004. In the model without Trial-Type and its interactions, the fixed effects alone accounted for 16.5% of the variance (marginal R2), whereas together, the fixed and random effects accounted for 44% of the variance (conditional R2). Thus, young English-learning infants, 4- and 6-month-olds, were successful at discriminating Narayan et al.’s (2010) Filipino /na/-/ŋa/ stimuli.
What caused infants in our experiment to succeed, when they failed in Narayan et al.’s (2010) paradigm? One possibility we can rule out is that infants in our paradigm had greater exposure to the habituating category given the shorter ISI and the more stringent habituation criteria: The 6-mo-olds in our experiment listened for an average of 77 secs or 61 repetitions during habituation (15 repetitions in 19s). Although Narayan et al. do not report average habituation duration, they state that infants heard the habituation stimuli for at least 2 minutes (pp. 412). Based on this, we can estimate that in Narayan et al. infants heard a minimum of 81 repetitions during habituation. Therefore, infants in our experiment heard fewer habituating stimuli than the infants tested by Narayan et al. The rate of stimulus presentation was slightly higher in our experiment (1 every 1.3 compared to 1.5 seconds), but this small difference is again unlikely to account for the difference in discrimination. We can only speculate then that infants succeeded in our experiment because the fully infant-controlled procedure that we used was more sensitive than the non-infant-controlled procedure used by Narayan et al. (see also Kuhl et al., 2003).
These results also challenge the interpretation of other null results using procedures similar to that of Narayan et al. (2010). For instance, Mazuka, Hasegawa, and Tsuji (2014) found that Japanese-learning 4.5-month-olds failed to discriminate a non-native vowel contrast which Japanese-learning 10-month-olds could discriminate, and speculated that discrimination of non-native contrasts may improve even in the absence of relevant experience. Our findings, in contrast, suggest that 4.5-month-olds’ apparent failure to discriminate this contrast may also have been a methodological artifact.
Given that English-learning infants were successful at discriminating a subtle non-native contrast, we predict that Filipino-learning 6- to 8-month-olds are also likely to succeed in discriminating this native contrast, if tested with our procedure. Thus, Narayan et al.’s (2010) results that older Filipino-learning infants’ succeeded in discriminating Filipino /na/-/ŋa/, even when tested with a less sensitive procedure, is simply another illustration of the facilitatory role of language experience (e.g., Kuhl et al., 2006; Polka et al., 2001; Sundara et al., 2006; Tsao et al., 2006).
Experiment 2
In Experiment 2, we tested English- and French-learning 6-month-olds’ discrimination of dental vs. retroflex place differences for nasals and laterals. As detailed below, these place differences for nasals and laterals are at least as subtle as the Filipino alveolar-velar distinction tested by Narayan et al. based on (a) the prevalence of these phonetic contrasts cross-linguistically, (b) the extent of articulatory differences, (c) acoustic distance in F2-F3 space, and (d) perceptual distance.
Traditionally, phonetic contrasts with reduced psychoacoustic distinctiveness are thought to be limited in their distribution across the world’s language inventories (Liljencrants & Lindblom, 1972). Of the 451 languages in the UCLA Phonological Segment Inventory Database (UPSID, Maddieson, 1984), 95% have the /m/-/n/ contrast, whereas only 50% have the /n/-/ŋ/ contrast. In the same database, 2.7% languages have dental vs. retroflex distinctions for nasals (12 languages), and only 1.6% for laterals (7 languages). Based on the distribution of segments across languages, the two contrasts tested in Experiment 2 are even less psychoacoustically salient than the /n/-/ŋ/ contrast tested by Narayan et al.
The stimuli we used came from Tamil, a Dravidian language spoken predominantly in Southern India and Sri Lanka. In Tamil, dental consonants are produced with tongue-tip or blade contact against the back wall of the upper front teeth, whereas retroflex consonants are produced by curling the tongue tip back and forming a closure in the post-alveolar/palatal region (McDonough & Johnson, 1997; Ladefoged & Bhaskarrao, 1983; Narayanan, Byrd & Kaun, 1999). Based on static and dynamic palatography, MRI and electromagnetic articulography, we know that dental-retroflex contrasts from Tamil share an active articulator, the tongue tip, but differ in the place of constriction in the vocal tract. This difference in articulation is more subtle than that for alveolar–velar differences like the ones in Filipino which differ in the active articulator – tongue tip or blade vs. the back of the tongue, as well as place of constriction in the vocal tract.
These articulatory differences between dental and retroflex nasals and laterals emerge acoustically as differences in F2 and F3 (Hamann, 2003). Like the /na/-/ŋa/ distinction tested by Narayan et al. (2010) dental and retroflex consonants in Dravidian languages have similar F2 values. Acoustic studies of Tamil and other Dravidian languages show that dental vs. retroflex nasals and laterals are primarily differentiated by the distance between F2 and F3, such that retroflex nasals and laterals have very low F3 values bringing the F2 and F3 close together (Dart & Nihlani, 1999; McDonough & Johnson, 1997; Narayanan et al., 1999; Ramasubramanian & Thosar, 1971). The actual distance between these stimuli in F2-F3 space with a comparison to the distance between the Filipino stimuli is presented in the stimulus section of this experiment.
Perceptual distance is yet another proxy for psychoacoustic distinctiveness. Harnsberger (2001) directly compared the perceptual distance between dental and retroflex nasals tested here and the bilabial, alveolar and velar nasals tested by Narayan et al (2010). He compared the categorization of six Malayalam nasals – bilabial, dental, alveolar, retroflex, palatal and velar – by Malayalam listeners as well as by listeners of 6 other languages, including American English. A multidimensional scaling analysis of categorization data confirmed that for 4 out of 6 non-native listener groups, dental, alveolar and retroflex nasals clustered together, separate from the velars that clustered with the palatals. Listeners of Malayalam, the native group, clustered dental and alveolar nasals, and palatal and velar nasals. Finally, the American English listeners distinguished between all pairs. Thus, for adult listeners cross-linguistically, the perceptual distance between dental-retroflex nasals is at least as small, if not smaller than, the distance between alveolar-velar nasals.
In sum, dental-retroflex distinctions in nasals and laterals (1) are typologically rarer than alveolar-velar place differences, and (2) are reported to manifest in the same F2-F3 space as the Filipino /na/-/ŋa/ distinction. Moreover, articulatory and perceptual evidence shows that these differences are at least as small, if not smaller than, the alveolar-velar nasal place differences tested by Narayan et al. (2010). Further, English and French both have only one alveolar nasal and lateral, these are similar in the two languages (Dart, 1991), and neither includes any sort of dental-retroflex distinction; so neither English- nor French-learning infants have any experience with this subtle place distinction in their native language. If infants are unable to discriminate psychoacoustically less salient contrasts, particularly in F2-F3 space as Narayan et al claim, then English- and French-learning 6-month-olds should fail to discriminate dental-retroflex place differences for nasals and laterals.
To make the stimuli in this experiment comparable to Experiment 1 and Narayan et al. (2010) we presented dental and retroflex nasals and laterals in syllable-initial position. Note that across the world’s languages, including in Tamil, these place distinctions are observed most often between vowels (Rajaram, 2000). Further, the acoustic cues for place difference, particularly nasals, are optimal precisely between vowels (Beddor, 2009). Thus, infants were tested on stimuli in which acoustic cues for the dental-alveolar distinction are not ideal. Unbeknownst to the infants, some of these stimuli, in particular those with syllable-initial retroflex consonants, were not phonotactically licit in Tamil. We take the position that discrimination of place differences in this less-than-optimal syllable-initial position is, nonetheless, subject to the typical pressures of developmental re-organization, particularly in cases where infants have no experience with these contrasts.
Materials and methods
Participants
Eighty-four 6-month-olds participated in the study (English/nasals: n = 22, 9 girls, mean age: 6;3, range: 5;11 – 6;20; English/laterals: n = 20, 8 girls, mean age: 6;3, range: 5;14 – 6;15; French/nasals: n = 22, 13 girls, mean age: 5;29, range: 5;20 – 6;14: French/laterals: n = 21, 12 girls, mean age: 6;1, range: 5;21 – 6;13). Language background was assessed using a parental language questionnaire and only infants with at least 90% exposure to English or French were included. More specifically, English-learning infants had an average of 97.1% exposure to English. The other language(s) these infants were exposed to (some to more than one other language) were Spanish (13), French (2), Italian (2), Japanese (2), Filipino (3), Arabic, (1) Armenian (1), and American Sign Language (1). Twenty-five additional infants (10 English) were tested but excluded due to experimenter error (5), fussiness/crying (6), not habituating (1), or not dishabituating to the post-test trial (13).
Stimuli
A female bilingual speaker of Tamil and American English produced multiple exemplars of each consonant intervocalically (/a_a/ context). The critical consonant (average duration nasals = 64ms; laterals = 134ms) and the following vowel (duration = 278ms) were excised using CoolEdit. To avoid abrupt onsets and offsets a fade-in (nasals: 10ms; laterals: 30ms) and a fade-out (30ms) was applied at the edges. Three exemplars, correctly identified by two native male speakers of Tamil, were selected for each syllable. Figures 3 and 4 provide narrow band spectrograms for the Tamil contrasts. Nineteen-second stimulus files were generated; each containing five instances of the three exemplars in random order (15 tokens) with an average inter-stimulus-interval (ISI) of 872ms (range 750:1001). For pre- and post-test trials, repetitions of the syllable ‘pok’ were recorded by a female native speaker of American English and concatenated (16s, ISI = 800ms).
Figure 3.

Narrow band spectrogram of one typical exemplar of the Tamil dental-retroflex nasal contrast.
Figure 4.

Narrow band spectrogram of one typical exemplar of the Tamil dental-retroflex lateral contrast.
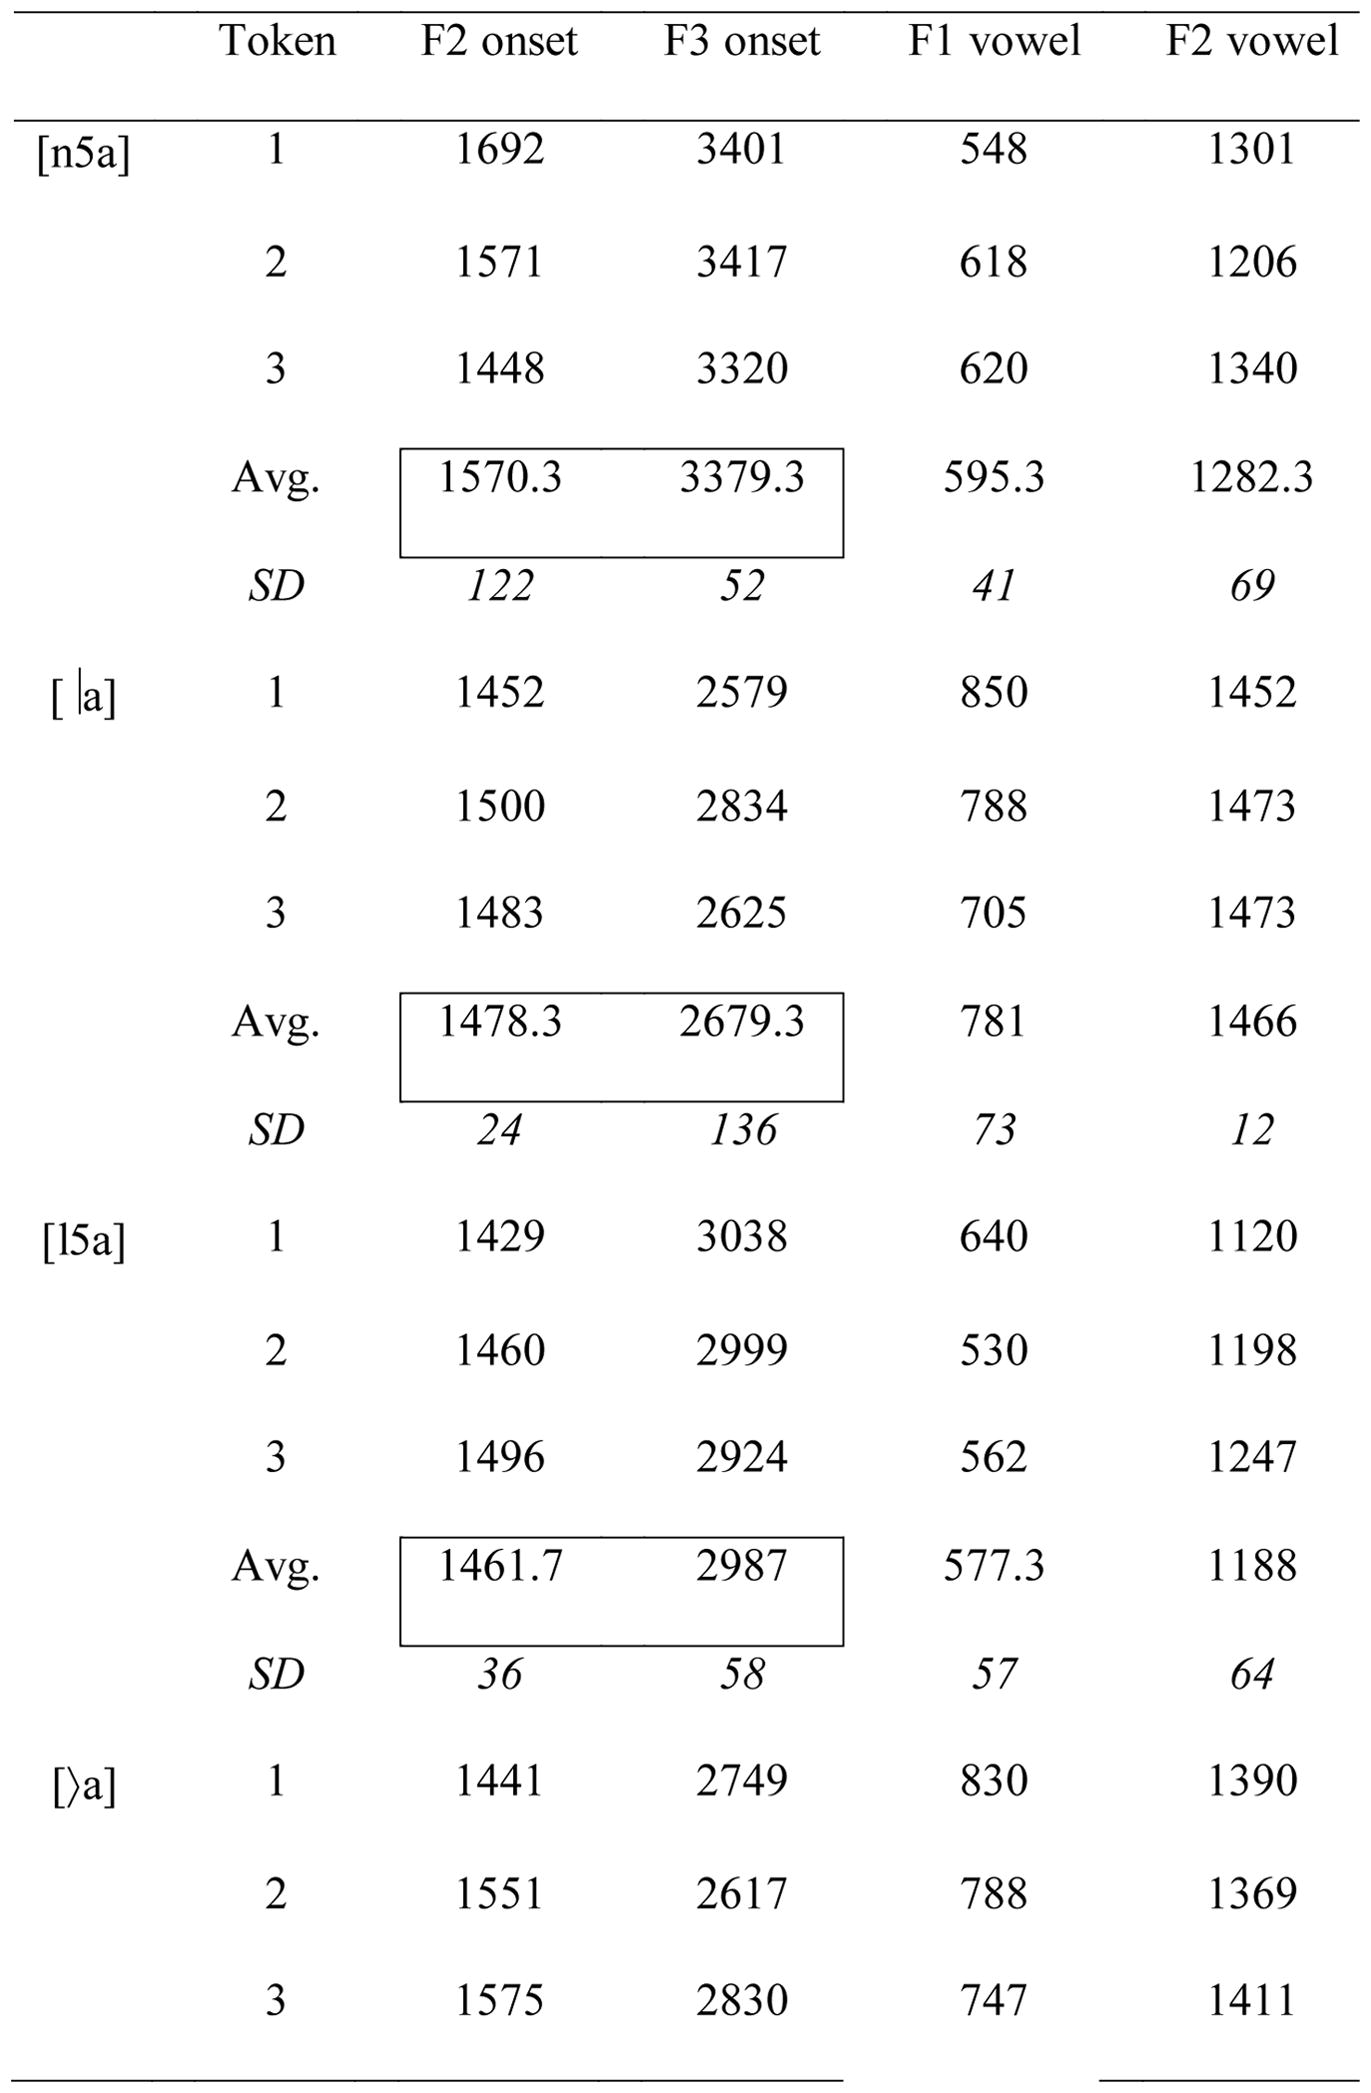
Acoustics
Nasals and laterals were identified by abrupt amplitude changes in the spectrogram. Table 2 and Figure 1 summarize the acoustic characteristics of the tokens used. To enable a comparison of distance across F2 and F3, formants that typically span different ranges in Hz, the axes are plotted in the perceptual Mel scale (Beranek, 1949; see also Iverson & Kuhl, 1995). To quantify acoustic distance, we calculated the Euclidean distance in Mels between every pair of stimuli for each of the contrasts. Unpaired t-tests confirmed that the distance between the dental-retroflex lateral distinction (open vs. filled circles; mean = 40.7; SD = 13.6) and Narayan et al.’s /na/-/ŋa/ distinction (2010; open vs. filled squares; mean = 37.4; SD = 17.8) was comparable (t(16) = 0.4, p = 0.6). Similarly, the distance between the dental-retroflex nasal distinction (open vs. filled triangles; mean = 96.8; SD = 19) and Narayan et al.’s /ma/-/na/ distinction (plus signs vs. open squares; mean = 105; SD = 15.8) was comparable (t(16) = −1, p = 0.3). Finally, the distance between the dental-retroflex distinction for laterals was significantly smaller than that for nasals (t(16) = −7.2, p < 0.001, Cohen’s d = 3.4).
Table 2.
Mean values of F2 and F3 for dental and retroflex nasal and lateral consonants measured in a 15ms window at the consonant vowel juncture, and mean values of F1 and F2 for the following vowels measured over the middle half of the vowel. All values are in Hertz.
|

|
Discrimination of the dental vs. retroflex stimuli by adult listeners
We compared Tamil-, English- and French-speaking adults’ (n = 16 each) discrimination of the lateral and nasal contrasts with an AX task (Anderson et al., 2003) to ensure the contrasts were equally difficult for English and French listeners. Tamil-speaking adults provided a baseline and were recruited from a US university community, and included 13 participants from Tamil Nadu (primarily from Chennai), two from Mumbai, and one from Hyderabad. All reported speaking Tamil on a regular – and in most cases, daily – basis despite living in North America. English-speaking adults were recruited from another North American university community, and French-speaking adults were recruited from Paris; none of the English- or French-speaking participants reported having learned a second language before the age of three.
For each contrast, participants were familiarized with three exemplars of each category. They then listened to pairs of syllables to determine whether the syllables were from the same or different category. Stimuli were presented in 4 blocks, two lateral blocks and two nasal blocks, for a total of 144 trials. Each trial had a 1-second inter-stimulus interval between the two stimuli. Adults in all three groups had mean A′ scores significantly above the 0.5 chance level on both the lateral and the nasal contrast (Tamil/Nasal: M = 0.79, SD = 0.12; t(15) = 9.9, p < 0.0001; Tamil/Lateral: M = 0.93, SD = 0.1; t(15) = 17.3, p < 0.0001; English/Nasal: M = 0.76, SD = 0.07; t(15) = 13.73, p < 0.0001; English/Lateral: M = 0.76, SD = 0.10; t(15) = 9.81, p < 0.0001; French/Nasal: M = 0.64, SD = 0.14; t(15) = 4.19, p = 0.0004; French/Lateral: M = 0.68, SD = 0.08; t(15) = 9.00, p <. 0001).
As expected, the performance of Tamil-speaking adults on the lateral contrast was native-like (criterion native-like A′ = 0.90, Polka, 1992; t(15) = 1.13, p = 0.27). However, their performance on the nasal contrast was significantly worse than is typically expected for native contrasts (t(15) = −3.96, p = 0.001). Further, performance on the nasal contrast was also significantly worse than on the laterals (t(15) = −5.3, p < 0.0001).
Recall that we presented listeners with the dental-retroflex contrasts for nasals and laterals in syllable-initial position even though these contrasts do not occur in syllable-initial position in Tamil (Rajaram, 2000). However, we cannot attribute Tamil-speaking adults’ poorer performance with nasals to this unfamiliar context alone; their performance on the laterals was native-like despite being presented in a similar unfamiliar context. It is more likely that the poorer performance of Tamil-speaking adults on the nasals reflects (a) the shorter duration of the nasal, compared to the lateral and (b) the less than optimal availability of acoustic cues for nasal place in syllable-initial position (Beddor, 2009). Of course, place cues for laterals are also not optimal in syllable-initial position, but compared to nasals, which have greatly reduced energy, laterals themselves tend to have a well-defined formant structure.
Unsurprisingly, the performance of English- and French-speaking adults was significantly worse than is typically expected for native contrasts (English/Lateral: t(15) = −5.04, p = 0.0001; English/Nasal: t(15) = −7.77, p < 0.0001; French/Lateral: t(15) = −11.48, p < 0.0001; French/Nasal: t(15) = −7.71, p < 0.0001). In sum, performance by both non-native groups, on both contrasts, was neither at floor nor at ceiling. Importantly, there was no difference in the discriminability of the nasal and the lateral contrast in either the English group (t < 1) or the French group (t < 1), and no difference between the English and French groups in their discrimination of the nasal versus the lateral contrasts (t < 1).
Procedure
English-learning and French-learning infants were tested in Los Angeles and Paris, respectively. Stimulus presentation was controlled by Habit X (Cohen, Atkinson & Chaput, 2004) in Los Angeles and the Lincoln Baby Lab program (Meints & Woodford, 2008) in Paris. The procedure was identical to Experiment 1.
Results & Discussion
Infants’ mean listening times during pre-test, post-test and habituation trials, as well as the mean number of trials to habituation are presented in Table 3. Infants’ habituation times were compared in a Language (English~French) X Contrast (Lateral~Nasal) X Habituation Stimulus (dental~retroflex) ANOVA. Neither the main effects nor the interaction reached significance (all Fs < 1), indicating that infants did not differ in their total time to habituate across conditions and across languages.
Table 3.
Average listening times to habituation, pre-, post-test stimuli (sec) and number of trials to habituate, for all infant groups tested on nasal and lateral contrasts in Experiment 2. Standard errors are shown in parentheses.
| Tamil Nasals | Tamil Laterals | |||
|---|---|---|---|---|
|
| ||||
| English | French | English | French | |
| Pre-test | 9.6 (1.2) | 8.6 (1.1) | 12.8 (1.0) | 11.5 (1.0) |
| Habituation time | 92.6 (9.2) | 87.2 (9.2) | 104.6 (8.4) | 87.1 (11.4) |
| Trials to habituate | 12.3 (1.0) | 11.3 (0.9) | 12.3 (1.0) | 10.6 (1.1) |
| Post-test | 12.7 (1.2) | 11.5 (0.9) | 12.4 (1.4) | 11.4 (1.0) |
Listening time to change and no-change trials are presented in Figure 5. Infant listening time (ms) was analyzed using a linear mixed effects regression model as in Experiment 1. The full model included the fixed effects of Language (English~French), Contrast (Nasal~Lateral), Habituation Stimulus (dental~retroflex) and crucially, Trial-Type (Change~No-Change); it also included all 6 two-way interactions, 4 3-way interactions and the 4-way interaction. The model also included a random intercept for each subject. The fixed effects alone in the model accounted for 12.9% of the variance (marginal R2), and the fixed and random effects together accounted for 16.6% of the variance (conditional R2).
Figure 5.

Average listening time (sec, ±SE) to no-change and change trials for English and French-learning 6-month-olds tested on the nasal and the lateral contrast.
Habituation Stimulus and its interactions did not contribute significantly to model fit, χ2(8) = 11.6, p =0.17. Neither did Contrast and its interactions, χ2(8) = 7.6, p =0.48, nor Language and its interactions, χ2(8) = 5.0, p =0.76. The only significant effect was of Trial-Type. Recall that contrast discrimination is demonstrated by a significant increase in listening time during the presentation of the change trial compared to the no-change trial. Removing just the interactions of Trial-Type did not reduce model fit, χ2(7) = 4.0, p =0.77. Crucially, removing the main effect of Trial-Type significantly reduced model fit. This reduction in fit was observed both when compared to the full model, χ2(8) = 17.8, p =0.02, and when compared to a reduced model without interactions involving Trial-Type, χ2(1) = 13.7, p =0.0002. In the model without Trial-Type, the fixed effects alone in the model accounted only for 9.5% of the variance (marginal R2), the conditional R2 was unchanged. The absence of any significant interaction with Trial-Type combined with the significant main effect of Trial-Type clearly shows that 6-month-olds successfully discriminate dental-retroflex nasals and laterals.
Experiment 3
In Experiment 1, English-learning 4- and 6-month-olds successfully discriminated Filipino /na/-/ŋa/, indicating a failure to replicate Narayan et al.’s (2010) null results. In Experiment 2, we additionally demonstrated that 6-month-olds were able to discriminate two other subtle phonetic contrasts despite their lack of experience with either. But were all three phonetic contrasts equally discriminable? How does /ma/-/na/ compare to the contrasts tested in these experiments? In Experiment 3, we argue that how well infants discriminate phonetic contrasts, before their abilities are reorganized by language experience, is the most direct measure of the salience of that contrast.
Because Narayan et al. (2010) tested English- and Filipino-learning infants on the /ma/-/na/ and /na/-/ŋa/ contrasts using identical procedures, the fact that infants only succeeded on the former indicates that /ma/-/na/ was easier to discriminate for infants. That is, /ma/-/na/ is more salient than /na/-/ŋa/ for English- and Filipino-learning infants. In Experiments 1 and 2, we tested English-learning 6-month-olds on /na/-/ŋa/, and the dental-retroflex distinction for nasals and laterals also using identical procedures, which was very similar but more sensitive that the one used by Narayan et al. Given infants success on all three contrasts in our Experiments 1 and 2, the relative ease of discrimination of each contrast is what should inform us about its salience.
Unfortunately, while habituation procedures used widely to test infant perception can reveal robust differences in discriminability, they are not well suited for indexing subtle graded differences. To overcome this limitation, we used effect size as a proxy for ease of discrimination. Given the same testing procedure, larger effect sizes correspond to better discrimination, and thus, greater salience of that contrast.
Because we also tested French-learning 6-month-olds on the dental-retroflex distinction for nasals and laterals, we were able to compare the effect sizes for these two contrasts in French-learning infants as well. Given that we have no evidence that French-learning 6-month-olds’ discrimination of these contrasts has been reorganized by language experience, we expected the rankings to replicate those from English-learning infants.
Narayan et al. (2010) define salience in a different way, relying on distance in one particular two-dimensional space: the F2-F3 space. This is problematic for several reasons. First, recent acoustic investigations of Australian languages1 point to the possibility that the F2-F3 space might not be ideal to compare the distinctiveness of subtle place differences for either nasals (Tabain, Butcher, Breen & Beare, 2016a) or laterals (Tabain, Butcher, Breen & Beare, 2016b). Instead, Tabain and colleagues report greater success with measures that index the shape of the acoustic spectrum.
In Experiments 1 and 2 as well, distance in the two-dimensional F2-F3 space did not predict discrimination (or its failure). Recall that the dental-retroflex contrast for nasals was comparable in acoustic distinctiveness to the Filipino /ma/-na/ contrast as measured by distance in F2-F3 space. But the distance in the F2-F3 space was significantly smaller for the dental-retroflex contrast for laterals and the Filipino /na/-/ŋa/ contrast. Hence, infants succeeded in discriminating subtle phonetic contrasts regardless of their distance in F2-F3 space.
However, the two-dimensional F2-F3 space did appropriately rank Filipino /ma/-na/ as being more salient, that is, easier to discriminate than Filipino /na/-/ŋa/. The success of the F2-F3 space in capturing the difference in salience between some but not all contrasts highlights the second, more general problem of linking salience directly to a specific acoustic space. Namely, the choice of the optimal acoustic space and its dimensionality is likely to vary as a function of the phonetic contrasts that are to be compared. For example, salience of vowel contrasts might well correlate with a different two- or three-dimensional F1-F2-(F3) space. In other words, it is highly unlikely that any single n-dimensional space is optimized for every pair of phonetic contrasts. An acoustic definition of salience is therefore always likely to be ad-hoc, and thus, of limited generalizability.
We illustrate this by assessing acoustic similarity of the entire power spectrum of the contrasts under investigation, based on representations widely used in automatic speech recognition – mel frequency cepstral coefficients (MFCCs) and linear prediction coefficients extracted by perceptual linear prediction models (PLPs). Both these representations have been applied to different classes of sounds; they model the non-linear frequency response of the human auditory system, and yield single measures representing the similarity of each consonant pair.
Methods
Effect sizes
We calculated Cohen’s d based on the discrimination results from Experiment 1 and 2. English-learning 6-month-olds contributed data for Filipino /na/-/ŋa/ and dental and retroflex contrasts for nasals and laterals; whereas we had data from French-learning 6-month-olds only for dental and retroflex contrasts for nasals and laterals. Each group of infants has a similar sample size (20 to 22), was tested using the same methodology, and habituated to the same extent (50%). Based on Narayan et al.’s (2010) data on English learning 6- to 8-month-olds tested on Filipino /ma/-/na/, we also derived Cohen’s d for that contrast. Results are summarized in Table 4.
Table 4.
Cohen’s d for each phonetic contrast. The mean and SE for Filipino /ma/ - /na/ is estimated from Narayan et al’s Figure 2. Means and SDs for all other cells are based on data presented in this paper.
| Change trials | No-Change trials | N | Cohen’s d | |||
|---|---|---|---|---|---|---|
|
|
|
|||||
| Mean | SD | Mean | SD | |||
| English infants | ||||||
| Filipino /ma/ - /na/ | 5.82 | 0.27* | 3.82 | 0.27* | 16 | 1.89 |
| Filipino /na/-/ŋa/ | 4.73 | 4.07 | 3.05 | 1.04 | 22 | 0.57 |
| Tamil nasal contrast | 7.19 | 4.96 | 4.94 | 2.85 | 22 | 0.56 |
| Tamil lateral contrast | 7.90 | 5.78 | 5.42 | 3.17 | 20 | 0.53 |
| French infants | ||||||
| Tamil nasal contrast | 7.00 | 4.77 | 4.71 | 2.42 | 22 | 0.61 |
| Tamil lateral contrast | 7.45 | 4.67 | 5.18 | 3.91 | 21 | 0.53 |
These are SEs estimated from Narayan et al. instead of SDs.
Representing the power spectra
First, we used signal processing techniques implemented in Matlab to represent the short-term energy of each syllable as a function of frequency in a feature vector. Specifically, each syllable was represented by Mel Frequency Cepstral Coefficients (MFCCs) and Linear Prediction Cepstral Coefficients (LPCCs) extracted by Perceptual Linear Prediction models. We chose to analyze the complete syllable so as to preserve spectral differences that might be available to infants. With the vowels being matched for quality, the differences are likely based on the consonant and its effects on the adjacent vowel.
MFCCs are n-dimensional vectors (or 3n-dimensions if the first and second order derivatives are included) that represent the power spectrum of the speech signal in a non-linear Mel scale (Davis & Mermelstein, 1980; Hermansky, 1990). Power spectra were generated using a 25ms Hamming window, 32 filters, and a 10ms step size. Recall from Experiment 2 that the Mel scale mimics the frequency resolution of the human auditory system. The power spectrum, after being filtered by a Mel scale filter-bank, is then log transformed to capture the non-linear response of the human auditory system to loudness. Finally, the log-transformed spectrum is again transformed using a discrete cosine transform to obtain cepstral coefficients. As is standard, we retained the first 13 frequency cepstral coefficients and used these to generate two vector representations for each consonant. One was 13-dimensional at each frame, and the other 39 (including first and second order derivatives).
To generate the LPCCs, we obtained the power spectrum of the speech waveform with a Fast Fourier Transform using a Hamming window with 25 ms frames, taken every 10 ms. In PLP models, properties of the human auditory system are captured in a somewhat different way from MFCCs. They incorporate three properties – the human auditory filter integrates energy within a critical band; a different intensity of the signal is required in each filter band to be perceived as equally loud; and that the loudness perceived is best modeled as a power function of the intensity. For our purposes we used a standard 6 (or 8) filter band, weighted according to a human’s equal loudness contour; the dynamic range of the frequency channels were cubic-root compressed. This allowed us to generate a lower dimensional LPCC representation of 6 and 8 orders respectively. These two orders are the default in LPCC representations extracted using PLP models.
Note that we did not apply any algorithms to normalize across talkers (e.g. Relative Spectral Transform (RASTA; Hermansky & Morgan, 1994) or Vocal Tract Length Normalization (VTLN; Cohen, Kamm, & Andreou, 1995) because each contrast was produced by the same talker.
Calculating (dis)similarity
Next, vector similarities were calculated for each phonetic contrast. We did this for each of the 4 vector representations – MFCCs with 13-dimensions, MFCCs with 39-dimensions, LPCCs order 6, and LPCCs order 8. Recall that the durations of the consonants varied. In fact, differences in duration might well be cues that listeners exploit in order to distinguish phonetic contrasts. However, comparing the spectral distance for two sounds that differ in duration, and thus vector size, is problematic because distance computations often assume a fixed number of dimensions. One solution to this problem, popular in low-resource speech recognition (Park & Glass, 2008), is dynamic time warping (DTW). DTW finds the optimal alignment between two time series by non-linearly stretching or shrinking speech samples along the time axis. We applied DTW to the MFCC and LPCC vector representations for each consonant contrast using two different metrics - Euclidean distance and cosine similarity (code: https://github.com/kamperh/speech_dtw/). The results are presented in Tables 5 and 6.
Table 5.
Average between-category Euclidean distance measured using MFCCs of vector length (a) 39 (including deltas and double deltas) and (b) 13, and LPCCs using PLPs of order (c) 8 and (d) 6. Larger distances indicate greater acoustic distinctiveness. MFCCs and PLPs were calculated over the full syllable.
| Euclidean Distance | ||||
|---|---|---|---|---|
|
|
|
|
|
|
| MFCC 39 | MFCC 13 | LPCC PLP 8 | LPCC PLP 6 | |
| Filipino /ma/ - /na/ | 8234 | 655 | 19 | 16 |
| Filipino /na/-/ŋa/ | 7759 | 587 | 17 | 13 |
| Tamil nasal contrast | 6757 | 491 | 12 | 10 |
| Tamil lateral contrast | 8285 | 788 | 26 | 22 |
Table 6.
Average between-category Cosine similarity measured using MFCCs of vector length (a) 39 (including deltas and double deltas) and (b) 13, and LPCCs using PLPs of order (c) 8 and (d) 6. Greater similarity indicates lesser distinctiveness. Cosine similarity was also calculated over the full syllable.
| Cosine similarity | ||||
|---|---|---|---|---|
|
|
|
|
|
|
| MFCC 39 | MFCC 13 | LPCC PLP 8 | LPCC PLP 6 | |
| Filipino /ma/ - /na/ | 0.67 | 0.20 | 0.0022 | 0.0015 |
| Filipino /na/-/ŋa/ | 0.59 | 0.17 | 0.0020 | 0.0012 |
| Tamil nasal contrast | 0.74 | 0.10 | 0.0019 | 0.0014 |
| Tamil lateral contrast | 0.79 | 0.21 | 0.0071 | 0.0047 |
Results & Discussion
The effect sizes reported in Table 4 confirm that for English-learning 6-month-olds the Filipino /ma/-/na/ contrast was the easiest to discriminate; the effect size for the contrast was large. The other three contrasts had medium effect sizes varying in a small range. Thus, all three subtle phonetic contrasts were difficult to discriminate for 6-month-olds. The dental-retroflex contrast for laterals was the least discriminable, followed by the dental-retroflex contrast for nasals, and then the Filipino /na/-/ŋa/. For French-learning infants as well the dental-retroflex contrast for laterals was less discriminable than that for nasals. Thus, for both groups of infants, the rank ordering of discriminability was consistent.
Interestingly, the rank ordering of discriminability mirrored the distribution of these contrasts across the world’s languages. Thus, in the absence of infant discrimination data, the distribution of different phonetic contrasts across the world’s language may serve as a good predictor of its relative discriminability.
We see in Table 5 that the Euclidean distance between Filipino /ma/ and /na/ was greater than between Filipino /na/ and /ŋa/, regardless of representation or vector length. Additionally, the dental-retroflex contrast for nasals was ranked third in Euclidean distance in every instance. Thus, like in Australian languages, multidimensional spectral shape measures do indeed better capture fine-grained differences in place of articulation for nasals compared to a two-dimensional F2-F3 space. In fact, acoustic distinctiveness indexed by Euclidean distance perfectly mirrored the ranking of effect sizes from infant discrimination data for nasal consonants.
However, the dental-retroflex contrast for laterals had the greatest Euclidean distance, but the lowest cosine similarity (Table 6). A comparison of Tables 5 and 6 yields several possible rankings based on either Euclidean distance or cosine distance, with no independent way to choose between them, other than by cross-referencing them with infant discrimination results. These differing predictions that come from different acoustic similarity spaces suggest that until we know which similarity space guides human perception, human discrimination experiments should inform hypotheses about acoustic similarity, rather than the reverse (see also Richter, Feldman, Salgado, & Jansen, in press).
General Discussion
We investigated Narayan et al.’s (2010) claim that infants are initially unable to discriminate subtle phonetic contrasts in F2-F3 space and succeed only with language experience. The key theoretical question here is whether induction of novel contrasts should be included among those types of developmental change in speech perception (Aslin & Pisoni, 1980) that are actually observed.
In Experiment 1, we showed that English-learning 4- and 6-month-olds successfully discriminate Narayan et al.’s (2010) Filipino alveolar–velar distinction when tested using a more sensitive procedure. The reason Narayan et al. fail to find evidence of discrimination in younger English-learning infants for this Filipino contrast is likely methodological. As noted in the Introduction, the non-infant-controlled procedure used by Narayan et al. fails to ensure that infants recognize the within-experiment contingency between looking and auditory preference. If some infants do recognize the contingency while others do not, the increase in within-group variance will correspondingly reduce statistical power. Thus Narayan et al.’s findings do not provide convincing support for the inclusion of induction in explanations of infant speech perception.
Narayan et al. (2010) are not unique in advancing claims of discrimination failure by young infants. For example, Eilers, Wilson, and Moore (1977) tested six-month-old infants on a battery of contrasts using a version of the Conditioned Head Turn procedure and reported discrimination failure for /fa/-/θa/ and /fi/-/θi/ contrasts. Eilers, Gavin, and Wilson (1979) tested 6–8-month-old English- and Spanish-learning infants on /ba/-/pa/ and /pa/-/pha/ contrasts using the same procedure and reported that only the Spanish-learning infants succeeded in discriminating the prevoiced-voiced /ba/-/pa/ contrast. More recently, Sato, Sogabe, and Mazuka (2010) reported that 4-month-old Japanese-learning infants failed to discriminate a short-long vowel duration contrast drawn from Japanese.
However, questions may be raised about each of these findings. Sato et al. used the same non-infant-controlled procedure as that employed in Narayan et al. (2010) which we have shown here to be relatively insensitive. Whether young infants can discriminate comparable vowel duration contrasts when tested in more sensitive paradigms remains to be determined. The implementation of CHT used in Eilers et al. (1977) and Eilers et al. (1979) did not require individual infants to demonstrate performance reaching any level of statistical significance in conditioning before proceeding to testing, an important control incorporated in subsequent versions of the procedure (Kuhl, 1985). Moreover, the prevoiced-voiced contrast in Eilers et al. (1979) used a narrow range of VOTs (−20 vs. +10). Languages vary considerably in where the prevoiced-voiced boundary is located, and young infants can discriminate at least some contrasts along this continuum (Liu & Kager, 2015), suggesting that language experience can enhance perception of such contrasts. Finally, Leavitt, Jusczyk, Murray, and Carden (1988) showed that 2-month-olds can discriminate the /fa/-/θa/ contrast when frication noise is included; as Jusczyk (1981) pointed out, the /fa/-θa/ stimuli used in Eilers et al. (1977) were poorly identified by adults, so those stimuli may have been lacking important cues. In sum, the claim that infants must rely on language experience to induce certain phonetic contrasts does not have robust support.
In Experiment 2, we tested 6-month-olds learning English or French on their ability to discriminate two Tamil contrasts that are distinguished in F2-F3 space and are rare across the world’s language inventories (and indeed not present in either English or French). The acoustic distance in F2-F3 space between dental-retroflex laterals in our study was comparable to the distance between /na/-/ŋa/ tested by Narayan et al. (2010). In contrast, the distance between the dental-retroflex nasals in F2-F3 space was larger than the distance between /na/ and /ŋa/, yet comparable to the distance between /ma/ and /na/. Regardless of the distance in F2-F3 space, and despite the absence of language experience, 6-month-olds also successfully discriminated dental-retroflex place differences for laterals and nasals. We demonstrated this for English- and French-learning infants in two different laboratories, respectively.
Our findings from both experiments challenge Narayan et al.’s (2010) claim that infants’ initial sensitivity is restricted to large acoustic differences in F2-F3 space and become refined only with language experience. In particular, Narayan et al. would predict that 6-month-old English- and French-learning infants, who have no experience with dental-retroflex place contrasts, should fail to discriminate the lateral distinction but not the nasal one, because the former spans a significantly smaller distance in F2-F3 space compared to the latter. Instead, 6-month-old English- and French-learning infants successfully discriminated both contrasts. However, infants’ discrimination of phonetic categories is not solely determined by language experience. As Narayan et al. rightly point out, the salience or distinctiveness of a phonetic contrast also influences infants’ discrimination (see also Burnham, 1986). Our findings, though, indicate that differences in salience govern not whether young infants discriminate particular contrasts extant in the world’s languages, but how well they do so.
If this is correct, then the salience of a contrast is likely critical in predicting how language experience affects the trajectory of development of discrimination of that contrast. Reassessing then, previous research shows that very salient contrasts are easy to discriminate for infants, regardless of the language input (Best, McRoberts & Sithole, 1988; Polka & Bohn, 1996); less salient contrasts can be discriminated, but are maintained only when supported by language input (e.g., Kuhl et al., 2006; Werker & Tees, 1984); and still less salient contrasts are initially less discriminable, but their discriminability is enhanced by language input (Kuhl et al., 2006; Polka et al., 2001; Sundara et al., 2006; Tsao et al., 2006).
A robust way to characterize the salience of a contrast, then, is by comparing effect sizes. This is particularly true for experiments using infant habituation paradigms which otherwise yield only categorical measures of discrimination. Additionally, effect sizes can be determined for infants’ discrimination of any phonetic contrast, and thus can be applied to compare the salience of all kinds of phonetic contrasts. Most importantly, characterizing the salience of a contrast using an effect size allows us to move beyond the limitations of any specific (acoustic) space.
As we show in Experiment 3, switching the acoustic space from 2- to n- dimensional, predicated on insights from acoustic studies of Australian languages, was still only marginally more successful in capturing fine-grained differences in the salience of subtle phonetic contrasts. The comparison of spectral shape in higher dimensional space was better at capturing differences in salience for the three nasals, but was not effective in characterizing the lateral contrast. Perhaps salience is better assessed in articulatory space rather than acoustic space (Best & McRoberts, 2003), although such a search would also have to contend with the same generalization problems that arise in the search for a single acoustic space.
In sum, we have shown that 6-month-olds are able to discriminate Tamil nasal and lateral dental–retroflex place contrasts as well as the Filipino alveolar-velar nasal contrast. They do so in the absence of language experience, and regardless of the distance of the contrast in F2-F3 space. These findings challenge the proposal that infants are initially sensitive solely to large acoustic differences in F2-F3 space and become able to discriminate subtle differences only with experience. Instead, our findings show that infants are initially sensitive to phonetic contrasts – spanning small acoustic differences as well as large ones; and language experience serves to modify the initial sensitivities - maintaining, reducing, or facilitating them, in accordance with Attunement theories.
Research Highlights.
It has been proposed that infants’ early discriminative abilities are limited by the acoustic distinctiveness of speech sound categories
We challenge this claim based on evidence that English-learning and French-learning 6-month-olds can discriminate acoustically subtle sound categories
Acknowledgments
We would like to thank Megan Blossom, Anne-Caroline Fiévet, Robin Orfitelli and Lori Rolfe for help with infant recruitment and data collection; Caitlin Richter, Chijioke Okonkwo and Alexander Shushunov for testing adults; and Henry Tehrani for generating the MFCCs and PLPs. This research was supported by: NSF BCS-0951639 to MS; a Brown University Brain Science Program Fellowship and NSF BCS-1320410 to NHF; NIH RO1-HD32005 to JLM; ANR-10-LABX-0087 IEC; ANR-10-IDEX-0001-02 PSL*; and ANR-13-APPR-0012. Finally, we would like to thank Chandan Narayan for generously sharing his Filipino stimuli with us.
Footnotes
Australian languages are unique in that they have bilabial, dental, alveolar, retroflex and velar places of articulation for nasals; and dental and retroflex (and other) places of articulation for laterals.
Supplementary Material
Archived data from this paper is available at <http://www.phonetics.ucla.edu/>
Publisher's Disclaimer: This is a PDF file of an unedited manuscript that has been accepted for publication. As a service to our customers we are providing this early version of the manuscript. The manuscript will undergo copyediting, typesetting, and review of the resulting proof before it is published in its final citable form. Please note that during the production process errors may be discovered which could affect the content, and all legal disclaimers that apply to the journal pertain.
Contributor Information
Megha Sundara, Dept. of Linguistics, University of California, Los Angeles.
Céline Ngon, Laboratoire de Sciences Cognitives et Psycholinguistique, (ENS - EHESS - CNRS), Département d’Études Cognitives, École Normale, Supérieure – PSL Research University.
Katrin Skoruppa, Institute of Language Sciences and Communication, University of Neuchâtel.
Naomi H. Feldman, Dept. of Linguistics and UMIACS, University of Maryland
Glenda Molina Onario, Dept. of Cognitive, Linguistic, and Psychological Sciences, Brown University.
James L. Morgan, Dept. of Cognitive, Linguistic, and Psychological Sciences, Brown University
Sharon Peperkamp, Laboratoire de Sciences Cognitives et Psycholinguistique, (ENS - EHESS - CNRS), Département d’Études Cognitives, École Normale, Supérieure – PSL Research University & Maternité Port-Royal, APHP.
References
- Anderson JL, Morgan JL, White KS. A statistical basis for speech sound discrimination. Language and Speech. 2003;46:155–182. doi: 10.1177/00238309030460020601. [DOI] [PubMed] [Google Scholar]
- Aslin RN, Pisoni DB. Some developmental processes in speech perception. In: Yeni-Komshian GH, Kavanagh J, Ferguson CA, editors. Child Phonology, 2: Perception. New York: Academic Press; 1980. pp. 67–96. [Google Scholar]
- Aslin RN, Pisoni DB, Hennessy BL, Perey AJ. Discrimination of voice-onset time by human infants: New findings and implications for the effects of early experience. Child Development. 1981;52:1135–1145. [PMC free article] [PubMed] [Google Scholar]
- Aslin RN, Werker JF, Morgan JL. Innate phonetic boundaries revisited. Journal of the Acoustical Society of America. 2002;112:1257–1260. doi: 10.1121/1.1501904. [DOI] [PubMed] [Google Scholar]
- Beranek LL. Acoustic Measurements. New York: Wiley; 1949. [Google Scholar]
- Bates D, Maechler M, Bolker B, Walker S. fitting linear mixed-effects models using lme4. Journal of Statistical Software. 2015;67:1–48. doi: 10.18637/jss.v067.i01. [DOI] [Google Scholar]
- Beddor PS. A coarticulatory path to sound change. Language. 2009;85(4):785–821. [Google Scholar]
- Best CT. Learning to perceive the sound pattern of English. In: Rovee-Collier C, Lipsitt LP, editors. Advances in infancy research. Norwood, NJ: Ablex; 1995. pp. 217–304. [Google Scholar]
- Best CT, McRoberts GW. Infant perception of non-native consonant contrasts that adults assimilate in different ways. Language and Speech. 2003;46(2–3):183–216. doi: 10.1177/00238309030460020701. [DOI] [PMC free article] [PubMed] [Google Scholar]
- Best CT, McRoberts GW, Sithole NM. Examination of perceptual reorganization for nonnative speech contrasts: Zulu click discrimination by English-speaking adults and infants. Journal of Experimental Psychology: Human Perception and Performance. 1988;14:345–360. doi: 10.1037//0096-1523.14.3.345. [DOI] [PubMed] [Google Scholar]
- Burnham DK. Developmental loss of speech perception: Exposure to and experience with a first language. Applied Psycholinguistics. 1986;7(3):207–239. [Google Scholar]
- Burns TC, Yoshida KA, Hill K, Werker JF. The development of phonetic representation in bilingual and monolingual infants. Applied Psycholinguistics. 2007;28:455–474. [Google Scholar]
- Cohen LB, Atkinson DJ, Chaput HH. Habit X: A new program for obtaining and organizing data in infant perception and cognition studies (Version 1.0) Austin, TX: University of Texas; 2004. [Google Scholar]
- Cohen J, Kamm T, Andreou AG. Vocal tract normalization in speech recognition: Compensating for systematic speaker variability. Journal of the Acoustical Society of America. 1995;97:3246–3247. [Google Scholar]
- Dart SN. Articulatory and acoustic properties of apical and laminal articulations. UCLA Working Papers in Phonetics. 1991:79. [Google Scholar]
- Dart SN, Nihalani P. The articulation of Malayalam coronal stops and nasals. Journal of the International Phonetic Association. 1999;29:129–142. [Google Scholar]
- Davis SB, Mermelstein P. Comparison of parametric representations for monosyllabic word recognition in continuously spoken sentences. IEEE Trans on Acoustic, Speech and Signal Processing. 1980;28:357–366. [Google Scholar]
- Eilers RE, Gavin W, Wilson WR. Linguistic experience and phonemic perception in infancy: A crosslinguistic study. Child Development. 1979;50:14–18. [PubMed] [Google Scholar]
- Eilers RE, Wilson WR, Moore JM. Developmental changes in speech discrimination in infants. Journal of Speech and Hearing Research. 1977;20:766–780. doi: 10.1044/jshr.2004.766. [DOI] [PubMed] [Google Scholar]
- Eimas PD. Auditory and linguistic processing of cues for place of articulation by infants. Perception & Psychophysics. 1974;16:513–521. [Google Scholar]
- Eimas PD. Auditory and phonetic coding of the cues for speech: Discrimination of the [r-l] distinction by young infants. Perception & Psychophysics. 1975;18:341–347. [Google Scholar]
- Eimas PD, Siqueland ER, Jusczyk PW, Vigorito J. Speech perception in infants. Science. 1971;171:303–306. doi: 10.1126/science.171.3968.303. [DOI] [PubMed] [Google Scholar]
- Fantz RL. Pattern vision in young infants. The psychological record. 1958;8:43–47. [Google Scholar]
- Fantz RL. Visual experience in infants: Decreased attention to familiar patterns relative to novel ones. Science. 1964;146:668–670. doi: 10.1126/science.146.3644.668. [DOI] [PubMed] [Google Scholar]
- Feldman NH, Myers EB, White KS, Griffiths TL, Morgan JL. Word-level information influences phonetic learning in adults and infants. Cognition. 2013;127:427–438. doi: 10.1016/j.cognition.2013.02.007. [DOI] [PMC free article] [PubMed] [Google Scholar]
- Hamann SR. Unpublished PhD Dissertation. University of Dusseldorf; 2003. The phonetics and phonology of retroflexes. Retrived from http://user.phil-fak.uni-duesseldorf.de/~hamann/Hamann2003Diss.pdf. [Google Scholar]
- Harnsberger JD. The perception of Malayalam nasal consonants by Marathi, Punjabi, Tamil, Oriya, Bengali, and American English listeners: A multidimensional scaling analysis. Journal of Phonetics. 2001;29:303–327. [Google Scholar]
- Hermansky H. Perceptual linear predictive (PLP) analysis of speech. The Journal of the Acoustical Society of America. 1990;87:1738–1752. doi: 10.1121/1.399423. [DOI] [PubMed] [Google Scholar]
- Hermansky H, Morgan N. RASTA processing of speech. IEEE Transactions on Speech and Audio Processing. 1994;2:578–589. [Google Scholar]
- Iverson P, Kuhl PK. Mapping the perceptual magnet effect for speech using signal detection theory and multidimensional scaling. Journal of Acoustical Society of America. 1995;97:553–562. doi: 10.1121/1.412280. [DOI] [PubMed] [Google Scholar]
- Jusczyk PW. Infant speech perception: A critical appraisal. In: Eimas PD, Miller JL, editors. Perspectives on the study of speech. Hillsdale, NJ: Erlbaum; 1981. pp. 113–164. [Google Scholar]
- Jusczyk PW. The discovery of spoken language. The MIT Press; Cambridge, MA: 1997. [Google Scholar]
- Kuhl PK. Methods in the study of infant speech perception. In: Gottlieb G, Krasnegor NA, editors. Measurement of audition and vision in the first year of postnatal life: A methodological overview. Norwood, NJ: Ablex; 1985. [Google Scholar]
- Kuhl PK. Effects of language experience on speech perception. Journal of the Acoustical Society of America. 1998;103:2931. [Google Scholar]
- Kuhl PK, Stevens E, Hayashi A, Deguchi T, Kiritani S, Iverson P. Infants show a facilitation effect for native language phonetic perception between 6 and 12 months. Developmental Science. 2006;9:F13–F21. doi: 10.1111/j.1467-7687.2006.00468.x. [DOI] [PubMed] [Google Scholar]
- Kuhl PK, Tsao F-M, Liu H-M. Foreign-language experience in infancy: Effects of short-term exposure and social interaction on phonetic learning. Proceedings of the National Academy of Sciences. 2003;100:9096–9101. doi: 10.1073/pnas.1532872100. [DOI] [PMC free article] [PubMed] [Google Scholar]
- Ladefoged P, Bhaskararao P. Non-quantal aspects of consonant production: A study of retroflex sounds. Journal of Phonetics. 1983;11:291–302. [Google Scholar]
- Leavitt A, Juscyzk PW, Murray J, Carden G. Context effects in two-month-old infants’ perception of labiodental/interdental fricative contrasts. Journal of Experimental Psychology: Human Perception and Performance. 1988;14:361–368. doi: 10.1037//0096-1523.14.3.361. [DOI] [PubMed] [Google Scholar]
- Lefcheck Jonathan S. piecewiseSEM: Piecewise structural equation modeling in R for ecology, evolution, and systematics. Methods in Ecology and Evolution. 2015;7:573–579. doi: 10.1111/2041-210X.12512. [DOI] [Google Scholar]
- Liljencrants J, Lindblom B. Numerical simulation of vowel quality systems: The role of perceptual contrast. Language. 1972;48:839–862. [Google Scholar]
- Liu L, Kager R. Bilingual exposure influences infant VOT perception. Infant Behavior and Development. 2015;38:27–36. doi: 10.1016/j.infbeh.2014.12.004. [DOI] [PubMed] [Google Scholar]
- Maddieson I. Cambridge studies in speech science and communication. Cambridge: Cambridge University Press; 1984. Patterns of sounds. [Google Scholar]
- Mazuka R, Hasegawa M, Tsuji S. Development of non-native vowel contrasts: Improvement without exposure. Developmental Psychobiology. 2014;56(2):192–209. doi: 10.1002/dev.21193. [DOI] [PubMed] [Google Scholar]
- McDonough J, Johnson K. Tamil laterals: An investigation into the basis of the contrast among five laterals in a dialect of Tamil. Journal of the International Phonetic Association. 1997;27:1–26. [Google Scholar]
- Meints K, Woodford A. Lincoln Infant Lab Package 1.0: A new programme package for IPL, Preferential Listening, Habituation and Eyetracking. 2008 [www document: Computer software & manual]. URL: http://www.lincoln.ac.uk/psychology/babylab.htm.
- Nakagawa S, Schielzeth H. A general and simple method for obtaining R2 from generalized linear mixed-effects models. Methods in Ecology and Evolution. 2013;4:133–142. [Google Scholar]
- Narayan CR, Werker JF, Beddor PS. The interaction between acoustic distinctiveness and language experience in developmental speech perception: Evidence from nasal place discrimination. Developmental Science. 2010;13:407–420. doi: 10.1111/j.1467-7687.2009.00898.x. [DOI] [PubMed] [Google Scholar]
- Narayanan S, Byrd D, Kaun A. Geometry, kinematics, and acoustics of Tamil lateral consonants. Journal of the Acoustical Society of America. 1999;106:1993–2007. doi: 10.1121/1.427946. [DOI] [PubMed] [Google Scholar]
- Park AS, Glass JR. Unsupervised pattern discovery in speech. IEEE Transactions on Audio, Speech, and Language Processing. 2008;16:186–197. [Google Scholar]
- Polka L. Characterizing the influence of native language experience on adult speech perception. Perception and Psychophysics. 1992;52(1):37–52. doi: 10.3758/bf03206758. [DOI] [PubMed] [Google Scholar]
- Polka L, Bohn OS. A cross-language comparison of vowel perception in English-learning and German- learning infants. Journal of the Acoustical Society of America. 1996;100:577–592. doi: 10.1121/1.415884. [DOI] [PubMed] [Google Scholar]
- Polka L, Colantonio C, Sundara M. A cross-language comparison of /d/-/th/ perception: Evidence for a new developmental pattern. The Journal of the Acoustical Society of America. 2001;109:2190–2201. doi: 10.1121/1.1362689. [DOI] [PubMed] [Google Scholar]
- Rajaram S. Tamil Phonetic Reader. Manasgangotri: Central Institute of Indian Languages; 2000. [Google Scholar]
- Ramasubramanian N, Thosar R. Synthesis by rule of some retroflex speech sounds. Language and Speech. 1971;14:65–85. doi: 10.1177/002383097101400108. [DOI] [PubMed] [Google Scholar]
- Richter C, Feldman NH, Salgado H, Jansen A. Evaluating low-level speech features against human perceptual data. Transactions of the Association for Computational Linguistics. 2017;5:425–440. [Google Scholar]
- Rivera-Gaxiola M, Silva-Pereyra J, Kuhl PK. Brain potentials to native and non-native speech contrasts in 7- and 11-month-old American infants. Developmental Science. 2005;8:162–172. doi: 10.1111/j.1467-7687.2005.00403.x. [DOI] [PubMed] [Google Scholar]
- Sato Y, Sogabe Y, Mazuka R. Discrimination of phonemic vowel length by Japanese infants. Developmental Psychology. 2010;46:106–119. doi: 10.1037/a0016718. [DOI] [PubMed] [Google Scholar]
- Streeter L. Language perception by 2-month-old infants shows effects of both innate mechanisms and experience. Nature. 1976;259:59–41. doi: 10.1038/259039a0. [DOI] [PubMed] [Google Scholar]
- Sundara M, Polka L, Genesee F. Language experience facilitates discrimination of /d- ð/ in monolingual and bilingual acquisition of English. Cognition. 2006;100:369–388. doi: 10.1016/j.cognition.2005.04.007. [DOI] [PubMed] [Google Scholar]
- Sundara M, Scutellaro A. Rhythmic distance between languages affects the development of speech perception in bilingual infants. Journal of Phonetics. 2011;39:505–513. [Google Scholar]
- Tabain M, Butcher A, Breen G, Beare R. An acoustic study of multiple lateral consonants in three Central Australian languages. Journal of the Acoustical Society of America. 2016a;139:361–372. doi: 10.1121/1.4937751. [DOI] [PubMed] [Google Scholar]
- Tabain M, Butcher A, Breen G, Beare R. An acoustic study of nasal consonants in three Central Australian languages. Journal of the Acoustical Society of America. 2016b;139:890–903. doi: 10.1121/1.4941659. [DOI] [PubMed] [Google Scholar]
- Trehub SE. The discrimination of foreign speech contrasts by infants and adults. Child Development. 1976;47:466–472. [Google Scholar]
- Tsao FM, Liu HM, Kuhl PK. Perception of native and non-native affricate-fricative contrasts: Cross-language tests on adults and infants. The Journal of the Acoustical Society of America. 2006;120:2285–2294. doi: 10.1121/1.2338290. [DOI] [PubMed] [Google Scholar]
- Tsushima T, Takizawa O, Sasaki M, Shiraki S, Nishi K, Kohno M, et al. Discrimination of English /r-l/ and /w-y/ by Japanese infants at 6–12 months: Language-specific developmental changes in speech perception abilities. The Emergence of Human Cognition and Language. 1994;3:57–61. [Google Scholar]
- Werker JF, Gilbert JH, Humphrey K, Tees RC. Developmental aspects of cross-language speech perception. Child Development. 1981;52:349–355. [PubMed] [Google Scholar]
- Werker JF, Polka L, Pegg JE. The conditioned head turn procedure as a method for testing infant speech perception. Infant and Child Development. 1997;6:171–178. [Google Scholar]
- Werker JF, Shi R, Desjardins R, Pegg J, Polka L, Patterson M. Three methods for testing infant speech perception. In: Slater AM, editor. Perceptual development: Visual, auditory, and speech perception in infancy. London: UCL Press; 1998. pp. 389–420. [Google Scholar]
- Werker JF, Tees RC. Cross-language speech perception: Evidence for perceptual reorganization during the first year of life. Infant Behavior and Development. 1984;7:49–63. [Google Scholar]
- Werker JF, Tees RC. Influences on infant speech processing: Toward a new synthesis. Annual Review of Psychology. 1999;50:509–535. doi: 10.1146/annurev.psych.50.1.509. [DOI] [PubMed] [Google Scholar]