

Abstract
Quantitative evaluation of retinal neurovascular coupling is essential for a better understanding of visual function and early detection of eye diseases. However, there is no established method to monitor coherent interactions between stimulus-evoked neural activity and hemodynamic responses at high resolution. Here we report a multi-modal functional optical coherence tomography (OCT) imaging methodology to enable concurrent intrinsic optical signal (IOS) imaging of stimulus-evoked neural activity and hemodynamic responses at capillary resolution. OCT angiography guided IOS analysis was used to separate neural-IOS and hemodynamic-IOS changes in the same retinal image sequence. Frequency flicker stimuli evoked neural-IOS changes in the outer retina; i.e., photoreceptor layer, first and then in the inner retina, including outer plexus layer (OPL), inner plexiform layer (IPL), and ganglion cell layer (GCL), which were followed by hemodynamic-IOS changes primarily in the inner retina; i.e., OPL, IPL, and GCL. Different time courses and signal magnitudes of hemodynamic-IOS responses were observed in blood vessels with various diameters.
Keywords: Optical coherence tomography, intrinsic optical signal, neurovascular coupling, retina, frequency flicker stimulation
1. Introduction
Neurodegenerative diseases are the major cause of dementia. In the USA and other developed countries, one of four persons with ages above 55 years may develop dementia [1]. Early detection of these neurodegenerative diseases is essential for better study and development of preventive strategies. Neurovascular coupling reflects the spatial and temporal relationships between transient neural activity and hemodynamic responses (i.e., blood flow/oxygen dynamics), which is essential to maintain normal function of the central nervous system (CNS) [2]. Neurovascular coupling dysfunctions accompany neurodegenerative diseases [3, 4]. A recent diffusion functional magnetic resonance imaging (MRI) study has revealed impaired hemodynamic responses beyond the microinfarct core [5]. There is ample evidence to support that functional imaging of neurovascular coupling; i.e., spatiotemporal mapping of transient neural activity related hemodynamic responses, promises early detection of neurodegenerative diseases [5–9]. However, direct access to the brain for high-resolution examination of neurovascular coupling defects is difficult. As part of the CNS, retinal microvasculature distortions were observed to correlate with neurodegenerative diseases [10–13]. Given the light transparent property of the eye, high-resolution optical imaging of the retinal neural tissue and microvasculature is readily available. Therefore, the retina provides a unique window to investigate dementia, stroke, and other brain diseases at high resolution [1]. However, there is no established method to provide spatiotemporal resolution for functional assessment of coherent interactions between neural activity and hemodynamic changes at the level of individual capillaries, which directly interact with retinal neurons within individual layers in the retina. To date, most reported retinal imaging studies have been limited to morphological measurement of retinal cells and the retinal vasculature, such as the retinal vascular caliber, tortuosity, fractal dimension, branching, etc [14]. Existing methods, such as electroretinogram (ERG) measurement [15] for objective evaluation of retinal neural function, cannot match the resolution provided by a retinal imager [15]. It is complicated to establish a correlation between outcomes from different instruments, especially in the complex retinal neurovascular network that consists of multiple retinal layers. A new imaging method that allows concurrent functional imaging of neural activity and hemodynamic responses in individual retinal layers is desirable for early detection of neural degeneration and reliable assessment of treatment outcomes.
Stimulus-evoked intrinsic optical signal (IOS) changes have been observed in the retinal photoreceptor and inner retinal layers [16–18]. Comparative study of laser-injured frog [19] and mutant mouse [20] retinas revealed IOS distortions were correlated with retinal neural dysfunctions. Multiple research groups have been making active efforts to pursue functional IOS imaging of animal [21–23] and human [24–27] retinas. However, stimulus-evoked IOS change correlated with neural activity (i.e., neural-IOS) and transient IOS responses associated with blood dynamics, (i.e., hemodynamic-IOS) are typically mixed together in the retina [28, 29]. To date there is no study that reported concurrent mapping of characteristic neural-IOS and hemodynamic-IOS changes to enable functional monitoring of retinal neurovascular coupling.
By providing excellent sectioning capability, optical coherence tomography (OCT) provides a noninvasive method to differentiate individual retinal layers [30–35]. Functional OCT imaging has been explored to achieve depth-resolved IOS imaging of the retina [36–41]. However, it is still challenging to achieve selective mapping of neural-IOS and hemodynamic-IOS changes. As one new OCT modality, OCT angiography (OCTA) can map the retinal vasculature at a single capillary level [42]. OCTA mapping of stimulus-evoked hemodynamic responses in individual retinal layers has been recently demonstrated [39]. Here we report a multi-modal functional OCT/OCTA system to achieve concurrent IOS imaging of stimulus-evoked neural activity and hemodynamic responses. By integrating OCTA-guided IOS data processing, we were able to differentiate two functional images; i.e., a neural-IOS map and a hemodynamic-IOS map, from the same image dataset. Frequency flicker stimuli were used to investigate IOSs in the individual retinal layers and in blood vessels with various diameters.
2. Materials and Methods
2.1. Animal Preparation
All animal care and experiments were performed in accordance with the Association for Research in Vision and Ophthalmology statement for the use of animals in ophthalmic and vision research. All experiments were performed following the protocols approved by the Animal Care Committee at the University of Illinois at Chicago. Seven adult wild-type mice (either sex, aged 8–10 weeks, weight 25–35 g, housed with a 12-h light-dark cycle) were used in this study. The strain was C57BL/6J and all mice were acquired from the Jackson Laboratory (Bar Harbor, ME, USA).
Before OCT recording, the mice were anesthetized with a mixture of ketamine and xylazine (60 mg/kg and 3 mg/kg body weight, respectively) injected intraperitoneally. A heating pad was used to maintain body temperature during the experiment. A custom-designed animal holder with an ear/bite was used to minimize movements caused by breathing and heartbeat and to achieve six axis stages for precise and rapid positioning of the retinal area for imaging. The pupil was fully dilated with phenylephrine hydrochloride 2.5% and tropicamide 1%. A cover glass, along with GenTeal eye gel (Alcon Laboratories, Fort Worth, TX, USA), was placed on the cornea to prevent drying and to serve as a contact lens to improve the image quality by reducing optical aberrations of the eye.
2.2. OCT Imaging System
A schematic diagram of the custom-designed SD-OCT system and retinal stimulator is shown in Figure 1. A broadband superluminescent diode (D-840-HP-I, Superlum, Cork, Ireland) with a central wavelength of 850 nm and a bandwidth of 100 nm was used. A fiber coupler with a splitting ratio of 75:25 divided the OCT light to the sample and reference arm. The reference arm contained a variable neutral density filter to adjust the light intensity from the reference arm and a glass plate to compensate for the dispersion of optical components in the sample arm. In the sample arm, the light was collimated through a collimating lens, and two scanning mirrors (6231H, Cambridge Technology Inc., Bedford, MA, USA) were used to produce three-dimensional OCT images. The scanning mirror was conjugated to the pupil of the eye to minimize the vignetting effect. A custom-designed spectrometer was constructed with an achromatic doublet lens, with focal length f = 150 mm, as the collimator, a 1200 line/mm transmission grating (Wasatch Photonics, West Logan, UT, USA), and rapid rectilinear lenses with two achromatic doublet lenses, f=300 mm, to image the interference spectrum returning from the interferometer. A line CCD camera (EV71YEM4CL2014-BA9; e2v, Chelmsford, UK) with 2,048 pixels and a pixel size of 14 × 28 μm was used with a line rate up to 70,000 Hz. The axial and lateral resolution values of the system were theoretically estimated at 3 μm and 12 μm, respectively. The blood vessel diameter in the mouse retina was in the range of 30.0 ± 6.7 μm for arterioles and 46.5 ± 16.5 μm for venules. The thickness of the mouse retina is about 200–250 μm, so the depth of field of the OCT system was set at 300 μm. The oversampling factor (OF) of the tomograms was calculated for high-speed imaging to minimize the in-frame image blur and between-frame displacement, and thus minimize the effect of eye movements to enable robust observation of transient blood flow responses correlated with retinal light stimulation. The oversampling factor was defined as OF = w · N/d, where w is the spot size, N is the number of sampling points, and d is the geometric width of the tomogram. For the neural-IOS and hemodynamic-IOS measurements, each OCT B-scan consists of 2,000 A-lines, corresponding to 6.28 mm retina, with an OF of approximately 3.82. For the en face OCT/OCTA imaging, 500 sampling points were chosen to cover a scan width of 2 mm for both fast and slow scan directions, corresponding to an OF of approximately 3. In the slow scan direction, the scan was repeated 4 times for OCTA image construction based on speckle variance processing. The measured optical power of the incident beam on the mouse cornea was below 1 mW, which met the safety requirements.
Figure 1.

Schematic diagram of the functional OCT system. The retinal stimulator was a green (λ = 505 nm) light-emitting diode. BM: beam splitter; CL: collimation lens Lenses: L1, L2, L3; PC: polarization controller; SLD: superluminescent diode.
2.3. Flicker Stimulation
The visible light stimulation was performed with a green light-emitting diode (peak λ = 505 nm, M505L3, Thorlabs) that was coupled to the imaging system with a dichroic mirror (DMLP550R, Thorlabs) and collimating lens to deliver a light pulse. The light pulse was triggered to deliver visible light stimulation and synchronized with the OCT imaging system using a digital module (USB-6343; National Instruments, Austin, TX, USA) trains (100 ms, duty ratio 50%, 10 Hz, 5 s duration). The power and spectrum of the light-emitting diode used for stimulation were measured using a light meter to validate the light source. The measured spectrum showed a center wavelength of 504 nm with a bandwidth of 27 nm and about 460 Lux.
2.4. Data Acquisition
All experiments were conducted in a dark room with no ambient light. The mice were dark-adapted for 1–2 hours prior to the experiment. Following anesthesia, the mouse was moved to the animal holder after 10–15 minutes for acclimatization and full pupil dilation, and the head was fixed using an ear bar and bite bar. The eye was positioned around the optic nerve head area for OCT imaging. For the neural-IOS and hemodynamic-IOS measurements, circular scanning was performed to acquire 2D OCT images at the same retinal location. For each experiment, the total OCT recording time was 30 s, including a 3-s pre-stimulation phase, a 5-s light stimulation phase, and a 22-s post-stimulation phase. The OCT was performed continuously during the entire recording session. The circular scan recording speed was 35 fps and a total of 1050 frames were acquired. After the circular scanning, 3D volume was acquired using raster scanning for the en face OCT/OCTA imaging. The raster scan speed was 112 fps and a total of 4,000 frames were acquired. All data were saved to a computer hard drive for post-processing. The custom-designed OCT system was controlled by laboratory-built software written in LabVIEW (LabVIEW 2013, National Instruments).
2.5. Hemodynamic-IOS Data Processing
The OCTA images were computed using OCT images. The speckle variance (SV) method was used to calculate OCTA images. Instead of using conventional SV calculations, which use discrete image frames, we used a consecutive SV calculation method. Each OCTA image was calculated using 35 frames of the OCT images, with two consecutive OCTA images sharing 34 frames of OCT images (i.e., the starting frame of an OCTA image was one frame later than that of the immediate previous OCTA image). These two methods shared the same calculation equation, but the frames used for calculation were different. This consecutive calculation method can produce higher temporal resolution of OCTA images than conventional SV calculation methods. Following the OCTA calculation, entire OCTA images were averaged according to the frames to generate mask images. The blood vessels were extracted using an intensity thresholding-based image segmentation method from generated mask images. The OCTA images were normalized by the average of the pre-stimulation images for each individual OCTA image, and a hemodynamic-IOS image was generated as ΔSV/SV, where SV was the intensity of SV for each frame within a depth scan and ΔSV was the difference between the intensity of the SV in each frame and the time-averaged intensity of SV determined from the pre-stimulation depth scans. Hemodynamic-IOSs and mask images were then obtained from the OCTA images and combined to extract signals from vessel regions only to minimize effects from the background areas. Since the hemodynamic-IOSs were from a blood vessel, it was strongly affected by the pulse and showed a periodic peak. Savitzky-Golay filtering (polynomial order 2; window length 30) was applied to the hemodynamic-IOSs for signal denoising.
2.6. Neural-IOS Data Processing
The OCT images were reconstructed from the acquired raw spectrum. The image registration algorithm was applied to compensate for bulk motion between the sequential images. The image registration method used a cross-correlation algorithm and conducted rigid body transformation to achieve sub-pixel accuracy. To investigate the dynamic IOS changes at individual functional layers over time, the IOSs from each layer were averaged in the horizontal direction in each frame. However, the thickness of the layer was not homogeneous even in the same layer depending on the location, so the thickness of each layer was equalized. The boundaries of each layer were detected using intensity and texture methods based on the image segmentation algorithm. The mean column pixel number of the segmented layer was calculated and then each column was spatially transformed, having the same values (mean column pixel number) as those using the bicubic interpolation method. This spatial transformation of each column was performed with all other layers to obtain flattened OCT images. The blood vessels were separated in the flattened OCT images to obtain only neural-IOSs. A previous study used a dynamic spatiotemporal filtering algorithm to remove the hemodynamic signal from confocal IOSs [19]. In the present study, the blood vessels were segmented using an OCTA mask image. The blood vessels in each OCT image were forced to zero. Following removal of the blood vessels, the images were calculated for neural-IOSs. The basic procedures used for neural-IOS data processing were as follows: the pre-stimulus images were averaged pixel by pixel (background intensity I); the background intensity I was subtracted from each image, pixel by pixel, and the dynamic change ΔI was calculated; and the image sequence of ΔI/I was used to reconstruct the neural-IOS images. A differential M-scan tomogram was calculated to improve the visibility of the stimulus-induced neural-IOS changes. Every neural-IOS image was averaged toward the column direction and combined to generate a differential M-scan tomogram. Next, neural-dIOSs were calculated to show active neural-IOS changes by removing background optical signals. The neural-dIOS calculation method shares the same equation as that used for neural-IOS calculations, except that the averaged pixel value of consecutive images before the current image was used as a baseline I and the next consecutive averaged images were used to calculate the dynamic change ΔI. For the neural-dIOSs shown in this article, we selected 20 and 15 images for the baseline I and dynamic change ΔI, respectively.
2.7. Statistical Analysis
All the statistical analyses were performed using Origin Lab and a custom-developed Matlab algorithm. For neural-IOS, neural-dIOS and hemodynamic-IOS changes, the data are expressed as the mean ± standard deviation in Figure 7A. In the case of neural-IOSs, a one way, 3 labels ANOVA with Bonferroni’s test was performed with significance defined as p < 0.05 to compare the onset time PL, OPL, IPL, and GCL (Figure 7B1). The onset time was measured for each of the datasets and served as input for the ANOVA test. For neural-dIOSs, a similar ANOVA test was performed to compare the neural adaptation time in the layers with significance defined as p < 0.001. The results are presented as box plots in Figure 7B2. To compare the hemodynamic-IOS changes in large vessels and capillaries, a two-sample Student’s t- test was performed assuming unequal variance and significance defined as p < 0.001; the results are expressed as box plots in Figure 7B3.
Figure 7.

Statistical characterization of neural-IOS and hemodynamic-IOS changes. Averaged temporal neural-IOS (A1), neural-dIOS (A2) changes from individual functional layers and hemodynamic-IOS (A3) changes in large blood vessels, capillaries, and avascular regions. Green shaded rectangular windows indicate the stimulus period. Averaged onset times of neural-IOS (B1), neural-dIOS (B2) from individual functional layers and hemodynamic-IOS (B3) from various blood vessel diameters. The solid color lines and corresponding dim color line indicate the mean and the standard deviation, respectively. IOS: intrinsic optical signal; dIOS: differential intrinsic optical signal; GCL: ganglion cell layer; IPL: inner plexiform layer; OPL, outer plexiform layer; PL: photoreceptor layer; AR: avascular region; C: capillary; LBV: large blood vessel.
3. Results
3.1. In vivo OCT and OCTA imaging of mouse retinas
The OCT image clearly differentiated the individual layers in the mouse retina, including the ganglion cell layer (GCL), inner plexiform layer (IPL), inner nuclear layer (INL), outer plexiform layer (OPL), outer nuclear layer (ONL), external limiting membrane (ELM), inner segment ellipsoid (ISe), outer segment (OS), and retinal pigment epithelium (RPE; Figure 2A). The en face OCT image enabled clear visualization of the large blood vessels (Figure 2B). The en face OCTA image provided vascular information for both the large blood vessels and small capillaries (Figure 2C). We chose an imaging area around the optic nerve head with 2 mm diameter to investigate retinal neural activities and hemodynamic responses simultaneously induced by visible light flicker stimulation.
Figure 2.
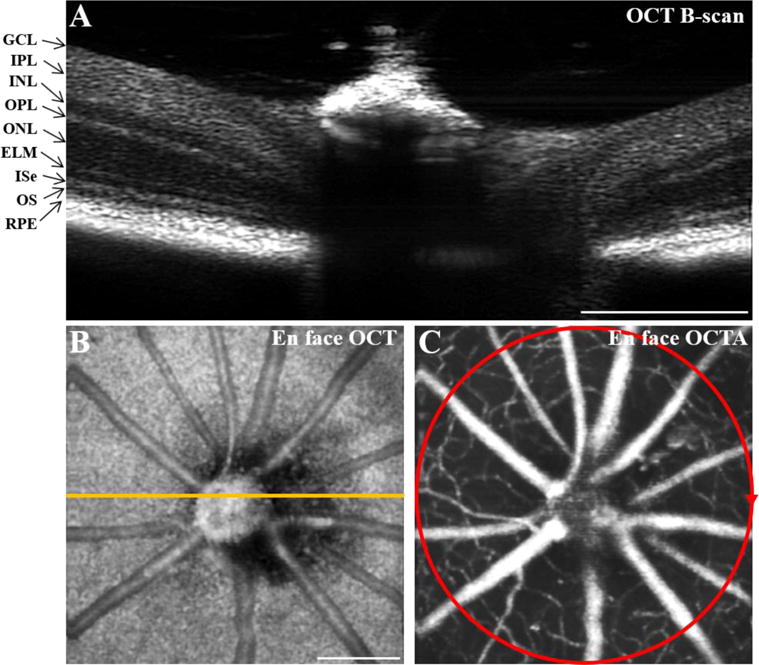
Representative OCT and OCTA images of mouse retinas. OCT B-scan (A), en face OCT (B), and en face OCTA (C) images of a mouse retina. The orange line in B indicates the scanning location of A. The red circle in C shows the scanning area (diameter 2 mm) for the experiment shown in Figure 3. Scale bars: 500 μm. OCT: optical coherence tomography; OCTA: OCT angiography; GCL: ganglion cell layer; IPL: inner plexiform layer; INL: inner nuclear layer; OPL: outer plexiform layer; ONL: outer nuclear layer; ELM: external limiting membrane; ISe: inner segment ellipsoid; OS: outer segment; RPE: retinal pigment epithelium.
3.2. Functional OCT of neural-IOS changes
Visible light flicker stimuli (100 ms, duty ratio 50%, 10 Hz, 5 s duration, 504 ± 13.5 nm, approximately 460 lux at the corneal surface) were delivered to the retina. Each stimulus reliably generated neural-IOSs, indicative of an IOS increase in each retinal layer (Figure 3). Circular scanned OCT images provided information on the structure of the individual retinal layers but no information on its vasculature (Figure 3A1). The OCT images were flattened by realigning each A-line (Figure 3A2). The flattened OCT image allows reliable signal processing of each retinal layer. The OCTA-guided neural-IOS map demonstrated neural-IOS changes in the individual retinal layers in response to the stimulus, but not in the vascular regions (Figure 3B). A differential M-scan tomogram was generated to illustrate spatiotemporal dynamics of neural-IOS changes in the individual retinal layers (Figure 3C1). Rapid neural-IOS changes were observed almost immediately in the photoreceptor layer (PL), and gradually in the OPL, IPL and GCL. To quantify the temporal properties of neural activities, the neural-IOSs from the individual retinal layers were averaged (Figure 3D1). The averaged spatiotemporal curves provided the mean (± standard deviation) response onset times at each retinal layer (PL, 0.029 ± 0 s; OPL, 0.57 ± 0.27 s; IPL, 0.53 ± 0.28 s; GCL, and 0.47 ± 0.31 s; n = 7 mice; Figsures 7A1 and 7B1). The early-phase neural-IOS changes occurred 29 ms after stimulus onset in the PL. In contrast, the later-phase neural-IOS changes were observed between 0.47 ~ 0.57 s in the inner retina layers after stimulus onset and gradually increased to reach peak values at the different time points. In the inner retinal layers, a differential M-scan tomogram, which provides retinal responses correlated with the stimuli, was generated to simultaneously observe the temporal dynamics of neural-IOSs in multiple retinal layers (Figsure 3C2). The differential M-scan tomogram showed pronounced neural-dIOSs in the PL almost immediately after the stimulus onset and then slowly decreased to baseline in the remaining stimulus time period (Figure 3C2). In contrast, the neural-dIOSs from the inner retina layer (i.e., OPL, IPL, and GCL) showed relatively slow time courses and were sustained for the duration of the stimulus (Figure 3C2). The quantitative difference in neural-dIOSs between each retinal layer is shown in Figure 3D2 and the corresponding statistical results are shown in Figures 7A2 and 7B2 (the neural adaptation times were 0.87 ± 0.15 s for the PL, 5.03 ± 0.4 s for the OPL, 5.68 ± 1.33 s for the IPL, and 5.29 ± 1.21 s for the GCL; n = 7 mice). Both neural-IOSs and neural-dIOSs were consistently observed in individual retinal layers (Figures 3C1 and 3C2).
Figure 3.
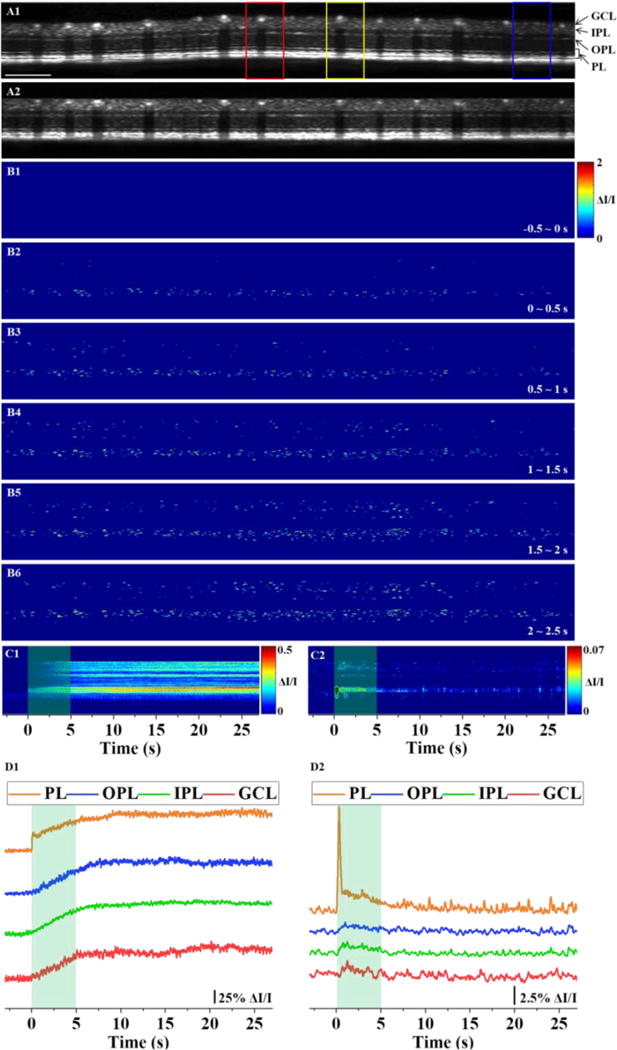
Functional OCT of neural-IOSs evoked by a 5-s flicker stimulus. (A1) Representative OCT image. Red, yellow, and blue boxes indicate the areas that are enlarged in Figure 4. Scale bars: 500 μm. (A2) Flattened OCT image of A1. (B) Spatial neural-IOS maps for different time periods with the pre-stimulus baseline subtracted. (C1) Differential M-scan tomogram of neural-IOSs. (C2) Differential M-scan tomogram of neural-dIOSs. (D1) Temporal neural-IOS changes from individual functional layers corresponding to C1. (D2) Temporal neural-dIOS changes from individual functional layers corresponding to C2. Green shaded rectangular windows indicate the stimulus period. OCT: optical coherence tomography; IOS: intrinsic optical signal; dIOS: differential intrinsic optical signal; GCL: ganglion cell layer; IPL: inner plexiform layer; OPL: outer plexiform layer; PL: photoreceptor layer.
To characterize the signal sources, local neural-IOSs from the red, yellow, and blue boxes in Figure 3A1 were further analyzed (Figure 4). Local neural-IOSs were observed in the PL, OPL, IPL, and GCL except for the vascular regions (Figure 4A). The quantitative characteristics of the localized neural-IOSs are represented in the temporal curves (Figures 4B–4D). In the PL, an immediate onset was observed in all three local neural-IOSs (Figures 4B1, 4C1, and 4D1), but the overall waveforms were variable. The neural-IOSs from the OPL showed different time courses; one showed a slightly delayed onset (Figure 4B2) but the others did not (Figures 4C2 and 4D2). At the IPL, neural-IOSs were observed to have different temporal characteristics. Similar to the OPL, a slightly delayed onset (Figure 4C3) and non-delayed onset (Figures 4B3 and 4D3) were also observed. Peak time differences were also observed. Some of them reached peak values after the stimulus period (Figures 4C3 and 4D3), while others reached peak values during the stimulus (Figure 4B3). The neural-IOSs from the GCL also showed different time courses of onset/peak time between the areas that contained large blood vessels (Figures 4B3 and 4C3).
Figure 4.

Spatiotemporal characterization of neural-IOSs. (A) Enlarged spatiotemporal images of in vivo neural-IOS images in three representative regions. A1, A2, and A3 correspond to the regions marked by red, yellow, and blue boxes, respectively, in Figure 3A. (B–D) Neural-IOS curves from individual functional layers corresponding to A1, A2, and A3, respectively. Green shaded rectangular windows indicate the stimulus period. Scale bars: 100 μm. IOS: intrinsic optical signal; GCL: ganglion cell layer; IPL: inner plexiform layer; OPL: outer plexiform layer; PL: photoreceptor layer.
3.3. Functional OCT of hemodynamic-IOS responses
OCTA images were used to reconstruct hemodynamic-IOSs based on SV calculations with consecutive images from the same OCT image sequence that was used in Figures 3 and 4. The vascular information was clearly observed in individual retinal layers of the OCTA images, while avascular regions provided almost totally clean backgrounds (Figure 5A). In the OCTA images, it was observed that all large blood vessels were located in the GCL, while capillaries were observed in both the IPL and OPL; blood vessels were also observed in the choroidal layer. Hemodynamic-IOSs were reconstructed to investigate hemodynamic changes, corresponding to visible light flicker-evoked neural-IOS activation. The hemodynamic-IOS map (Figure 5B) provided local hemodynamics, including blood flow, vessel size, and vessel location at different time points, with the degree of blood flow indicated by different colors from red (large changes in hemodynamic-IOSs) to blue (small changes in hemodynamic-IOSs). The large blood vessels and small capillaries were differentiated to verify the effect of vessel size on hemodynamic-IOS responses (Figure 5C). To detect the blood vessels in each image precisely, we used the intensity thresholding-based segmentation method with averaged OCTA images. Twelve large blood vessels and 25 small capillaries were extracted and 6 avascular regions were manually selected. A noticeable increase in hemodynamic-IOS changes was observed in both large blood vessels and small capillaries (Figure 5C). Compared to the onset of neural-IOS changes correlated with visible light stimuli, the onset of the hemodynamic-IOS change was delayed in both large blood vessels and small capillaries, with onset times of 1.23 ± 0.35 s and 2.21 ± 0.7 s, respectively (n = 7 mice; Figures 7A3 and 7B3). The increased hemodynamic-IOSs were sustained even in the post-stimulation phase. This finding correlated well with that in a previous study [39]. In that study, the hemodynamic changes were monitored in the individual retinal layers induced by flickering light stimulation and different hemodynamic responses were observed in the individual retinal layers, probably because of their different metabolic demands, with significant increases in the GCL, IPL and OPL when compared with other layers, as well as delayed onset.
Figure 5.

Functional OCT of hemodynamic-IOSs evoked by the 5-s flicker stimulus. (A) Representative OCTA image. (B) Spatial hemodynamic-IOS maps for different time periods with the pre-stimulus baseline subtracted. (C) Temporal hemodynamic-IOS changes in large blood vessels, capillaries, and avascular regions corresponding to B. The solid color lines and corresponding dim color line indicate the averaged signal and each single signal, respectively. Green shaded rectangular windows indicate the stimulus period. Scale bars: 500 μm. OCTA: optical coherence tomography angiography; IOS: intrinsic optical signal.
To investigate the relationship between neural-IOSs and hemodynamic-IOSs induced by a flickering light stimulus, local spatiotemporal characteristics of hemodynamic-IOSs from individual blood vessels were observed. The enlarged hemodynamic-IOS images, which have exactly the same locations as those marked in Figure 3A1, were calculated (Figure 6A). These images allowed clearer visualization of hemodynamic-IOS changes at the different time points and locations corresponding to the large blood vessels (red triangle) and small capillaries (yellow triangle) located in the OCTA images. The hemodynamic-IOSs in the large blood vessels showed a slightly delayed onset time and reached their peak value during the stimulus, whereas a further delayed onset time and peak value were observed in the small capillaries (Figure 6A). Quantitative hemodynamic-IOS curves showed different onset/peak times at 1.57/5.34 s and 1.34/3.2 s, respectively, between large blood vessels (Figures 6B1 and 6C1). The onset and peak time course of neural-IOSs from the GCL (Figures 4B4 and 4C4) were similar to those for hemodynamic-IOSs from the large blood vessels. The temporal curves for hemodynamic-IOSs from the small capillaries showed further delayed onset (2.06–3.4 s) and peak (7.6–11.86 s) times compared to that of the large blood vessels (Figures 6B2, 6C2, 6C3, 6C4, 6D1, and 6D2).
Figure 6.

Spatiotemporal characterization of hemodynamic-IOSs. (A) Enlarged spatiotemporal images of in vivo hemodynamic-IOS images in three representative regions. A1, A2, and A3 correspond to the same regions as in Figure 4A1, 4A2, and 4A3, respectively. The red and yellow triangles indicate large blood vessels and capillaries, respectively. (B–D) Hemodynamic-IOS curves from different vascular/avascular regions corresponding to A1, A2, and A3, respectively. Avascular regions 1 and 2 are from the A3 inner plexiform layer excluding capillaries and the outer plexiform layer, respectively. Green shaded rectangular windows indicate the stimulus period. Scale bars: 100 μm. IOS: intrinsic optical signal.
4. Discussion
Because retinal blood vessels are interconnected in the inner retinal layers, stimulus-evoked IOS changes that are correlated with neural activity (i.e., neural-IOS) and transient IOS responses associated with blood dynamics, (i.e., hemodynamic-IOS) are typically mixed together in the retina. Ts’o et al. and Schallek et al. reported that visible light stimuli evoked IOSs in the retina were predominantly driven by the outer retina, but they may be contaminated by hemodynamic changes in the inner retina. We also previously observed stimulus evoked hemodynamic responses mixed with neural-IOSs [28, 29]. In this study, we developed and validated a multi-modal functional OCT imaging system to enable functional monitoring of coherent interactions between neural activities and hemodynamic changes. To the best of our knowledge, this is the first study to demonstrate functional IOS imaging of neurovascular coupling interactions at individual retinal layers with single capillary level resolution. For reliable dissection of neural-IOSs and hemodynamic-IOSs, OCTA-guided IOS data processing was used to separate neural-IOS and hemodynamic-IOS changes precisely.
Fast and slow neural-IOS changes were observed at the PL and inner retinal layers (OPL, IPL, and GCL), respectively (Figures 3 and 4). The rapid neural-IOS changes in the PL might reflect light-induced outer segment distortion [16, 17, 36, 43], which occur before the hyperpolarization of retinal photoreceptors [16]. These neural-IOS changes exhibited an excellent correlation with our previous results [38]. High spatiotemporal resolution OCT revealed robust neural-IOSs as early as ~0.4 ms after retinal stimulation in in vivo structural and functional imaging of the mouse retina. Also, it showed precise identification of the anatomic source; i.e., photoreceptor outer segment, of the neural-IOS. Time-lapse light microscopy has revealed light-induced photoreceptor length shrinkage in individual rod photoreceptors [17]. Most recently, we used high resolution transmission electron microscopy (TEM) to verify that the rod OS length shrinkage was correlated to the light-driven decrease of the space between individual discs, not the disc thickness itself. The slow neural-IOS in the inner retina might reflect one integral effect of multiple inner retinal neurons during retinal visual information processing. The retinal OPL and IPL have complex microstructures. The OPL contains the dendritic extensions of PRs and horizontal and bipolar cells. In the IPL, interactions of a variety of specialized amacrine cells, axonal terminals of ON- and OFF- bipolar cells, and ganglion cells take place [22]. The inner retina layers (OPL, IPL, and GCL) showed ‘switch-like’ neural-IOS responses during the stimulus period (Figures 3D2 and 7A2). This might reflect that the neurons were responsive to the stimulus and adapted to changed metabolic circumstances. The localized neural-IOS changes showed difference time courses even in the same retinal layers (Figure 4). This might reflect that different retina areas have various neuron compositions thus complex information processing is needed to meet metabolic demands.
The hemodynamic-IOS responses, following neural-IOS changes, were observed due to neurovascular coupling induced by the visible light flicker stimuli. When the retina is stimulated by a flickering light, retinal blood flow should increase significantly. This increased blood flow supplies oxygen and nutrition to the active neurons in the inner retinal layers to fulfil the metabolic demands [44, 45]. In comparison with neural-IOSs, all hemodynamic-IOSs showed latent responses to onset times. These latencies were different with various blood vessel diameters that are located in individual retinal layers. Kornfield et al. reported that flickering lights evoke rapid and consistent dilation in large blood vessels (i.e., arterioles) but slower and inconsistent dilation in downstream capillaries [46]. The mechanism for the different hemodynamic-IOS responses of large blood vessels and small capillaries is not clearly understood yet, but a few possible reasons have been proposed. First, different hemodynamic-IOS responses may reflect differences in neural metabolic demands in the individual retinal layers [47, 48]. The large blood vessels on the retinal surface; i.e., arteries and veins, supply the retinal ganglion cells, which are activated by visible light stimuli. However, oxygen is supplied to this layer by both vessels in the superficial layer and the vitreous humor, in which the pO2 is higher than in the inner retina [49]. Another possible reason is that there are different signal resources for blood flow regulation. Biesecker et al. reported that calcium signaling in glial cells mediates slow regulation of blood flow in the capillaries, but not arteriole dilation of the retina [50]. A third reason might be due to the windkessel effect. An active arteriole dilation results in a pressure increase that passively dilates downstream vessels, thus slow changes are induced in capillaries [46]. The windkessel effect does not, in itself, account for differential dilation of the three capillary layers. Several other factors, such as different resistance and compliance depending on the vessel volume, may contribute to differential dilation.
In summary, we demonstrated the feasibility of concurrent functional OCT imaging of neural-IOS and hemodynamic-IOS changes in response to flickering light stimulation. OCTA-guided OCT data processing dissected vascular (i.e., blood vessel) and avascular (i.e., neural tissue) retinal areas reliably, enabling robust neural-IOS and hemodynamic-IOS monitoring simultaneously. This provides a noninvasive imaging platform for high-speed and high-resolution study of the functional relationship between retinal neural degeneration and vascular pathology, promoting early detection and therapy development of neurodegenerative diseases.
Acknowledgments
This research was supported in part by NIH grants R01 EY023522, R01 EY024628, P30 EY001792; by Richard and Loan Hill endowment; by unrestricted grant from Research to Prevent Blindness.
References
- 1.Cheung CYL, Ikram MK, Chen C, Wong TY. Prog Retin Eye Res. 2017;57:89–107. doi: 10.1016/j.preteyeres.2017.01.001. [DOI] [PubMed] [Google Scholar]
- 2.Phillips AA, Chan FHN, Zheng MMZ, Krassioukov AV, Ainslie PN. J Cerebr Blood F Met. 2016;36:647–664. doi: 10.1177/0271678X15617954. [DOI] [PMC free article] [PubMed] [Google Scholar]
- 3.Holm H, Nagga K, Nilsson ED, Ricci F, Melander O, Hansson O, Bachus E, Magnusson M, Fedorowski A. J Intern Med. 2017;282:94–101. doi: 10.1111/joim.12621. [DOI] [PubMed] [Google Scholar]
- 4.Huneau C, Benali H, Chabriat H. Front Neurosci-Switz. 2015;9 doi: 10.3389/fnins.2015.00467. [DOI] [PMC free article] [PubMed] [Google Scholar]
- 5.Summers PM, Hartmann DA, Hui ES, Nie X, Deardorff RL, McKinnon ET, Helpern JA, Jensen JH, Shih AY. J Cereb Blood Flow Metab. 2017;37:3599–3614. doi: 10.1177/0271678X16685573. [DOI] [PMC free article] [PubMed] [Google Scholar]
- 6.Beishon L, Haunton VJ, Panerai RB, Robinson TG. J Alzheimers Dis. 2017;59:369–385. doi: 10.3233/JAD-170181. [DOI] [PubMed] [Google Scholar]
- 7.Toth P, Tarantini S, Csiszar A, Ungvari Z. J Physiol Heart Circ Physiol. 2017;312:H1–H20. doi: 10.1152/ajpheart.00581.2016. [DOI] [PMC free article] [PubMed] [Google Scholar]
- 8.Tarantini S, Tran CHT, Gordon GR, Ungvari Z, Csiszar A. Exp Gerontol. 2017;94:52–58. doi: 10.1016/j.exger.2016.11.004. [DOI] [PMC free article] [PubMed] [Google Scholar]
- 9.Ungvari Z, Tarantini S, Hertelendy P, Valcarcel-Ares MN, Fulop GA, Logan S, Kiss T, Farkas E, Csiszar A, Yabluchanskiy A. Geroscience. 2017;39:33–42. doi: 10.1007/s11357-017-9964-z. [DOI] [PMC free article] [PubMed] [Google Scholar]
- 10.MacCormick IJ, Czanner G, Faragher B. Biomark Med. 2015;9:691–701. doi: 10.2217/bmm.15.17. [DOI] [PMC free article] [PubMed] [Google Scholar]
- 11.Jindal V. Mol Neurobiol. 2015;51:885–892. doi: 10.1007/s12035-014-8733-6. [DOI] [PubMed] [Google Scholar]
- 12.Frost S, Kanagasingam Y, Sohrabi H, Vignarajan J, Bourgeat P, Salvado O, Villemagne V, Rowe CC, Macaulay SL, Szoeke C, Ellis KA, Ames D, Masters CL, Rainey-Smith S, Martins RN, A. R. Group Transl Psychiatry. 2013;3:e233. doi: 10.1038/tp.2012.150. [DOI] [PMC free article] [PubMed] [Google Scholar]
- 13.Berisha F, Feke GT, Trempe CL, McMeel JW, Schepens CL. Invest Ophthalmol Vis Sci. 2007;48:2285–2289. doi: 10.1167/iovs.06-1029. [DOI] [PubMed] [Google Scholar]
- 14.Hilal S, Ong YT, Cheung CY, Tan CS, Venketasubramanian N, Niessen WJ, Vrooman H, Anuar AR, Chew M, Chen C, Wong TY, Ikram MK. Neurosci Lett. 2014;577:95–100. doi: 10.1016/j.neulet.2014.06.024. [DOI] [PubMed] [Google Scholar]
- 15.Creel D. In: The Electroretinogram and Electro-oculogram: Clinical Applications. Kolb H, Fernandez E, Nelson R, editors. Salt Lake City UT: 1995. [Google Scholar]
- 16.Lu Y, Wang B, Pepperberg DR, Yao X. Biomed Opt Express. 2017;8:38–47. doi: 10.1364/BOE.8.000038. [DOI] [PMC free article] [PubMed] [Google Scholar]
- 17.Zhao X, Thapa D, Wang B, Lu Y, Gai S, Yao X. J Biomed Opt. 2016;21:65006. doi: 10.1117/1.JBO.21.6.065006. [DOI] [PMC free article] [PubMed] [Google Scholar]
- 18.Zhang Q, Lu R, Wang B, Messinger JD, Curcio CA, Yao X. Sci Rep. 2015;5:9595. doi: 10.1038/srep09595. [DOI] [PMC free article] [PubMed] [Google Scholar]
- 19.Zhang QX, Lu RW, Curcio CA, Yao XC. Invest Ophthalmol Vis Sci. 2012;53:8139–8145. doi: 10.1167/iovs.12-10732. [DOI] [PMC free article] [PubMed] [Google Scholar]
- 20.Zhang QX, Zhang Y, Lu RW, Li YC, Pittler SJ, Kraft TW, Yao XC. Opt Express. 2012;20:7646–7654. doi: 10.1364/OE.20.007646. [DOI] [PMC free article] [PubMed] [Google Scholar]
- 21.Hanazono G, Tsunoda K, Shinoda K, Tsubota K, Miyake Y, Tanifuji M. Invest Ophthalmol Vis Sci. 2007;48:2903–2912. doi: 10.1167/iovs.06-1294. [DOI] [PubMed] [Google Scholar]
- 22.Bizheva K, Pflug R, Hermann B, Povazay B, Sattmann H, Qiu P, Anger E, Reitsamer H, Popov S, Taylor JR, Unterhuber A, Ahnelt P, Drexler W. Proc Natl Acad Sci USA. 2006;103:5066–5071. doi: 10.1073/pnas.0506997103. [DOI] [PMC free article] [PubMed] [Google Scholar]
- 23.Naderian A, Bussieres L, Thomas S, Lesage F, Casanova C. Vision Res. 2017;137:40–49. doi: 10.1016/j.visres.2017.04.015. [DOI] [PubMed] [Google Scholar]
- 24.Srinivasan VJ, Chen Y, Duker JS, Fujimoto JG. Opt Express. 2009;17:3861–3877. doi: 10.1364/oe.17.003861. [DOI] [PMC free article] [PubMed] [Google Scholar]
- 25.Grieve K, Roorda A. Invest Ophthalmol Vis Sci. 2008;49:713–719. doi: 10.1167/iovs.07-0837. [DOI] [PubMed] [Google Scholar]
- 26.Jonnal RS, Rha J, Zhang Y, Cense B, Gao WH, Miller DT. Opt Express. 2007;15:16141–16160. doi: 10.1364/OE.15.016141. [DOI] [PMC free article] [PubMed] [Google Scholar]
- 27.Tso DY, Li H, Kwon Y, Randy K, Truit P, Soliz P. Invest Ophthalmol Vis Sci. 2003;44:U33–U33. [Google Scholar]
- 28.Schallek J, Ts’o D. Invest Ophthalmol Vis Sci. 2011;52:1325–1335. doi: 10.1167/iovs.10-5215. [DOI] [PMC free article] [PubMed] [Google Scholar]
- 29.Ts’o D, Schallek J, Kwon Y, Kardon R, Abramoff M, Soliz P. Jpn J Ophthalmol. 2009;53:334–344. doi: 10.1007/s10384-009-0687-2. [DOI] [PMC free article] [PubMed] [Google Scholar]
- 30.Huang D, Swanson EA, Lin CP, Schuman JS, Stinson WG, Chang W, Hee MR, Flotte T, Gregory K, Puliafito CA. Science. 1991;254:1178–1181. doi: 10.1126/science.1957169. [DOI] [PMC free article] [PubMed] [Google Scholar]
- 31.Mrejen S, Spaide RF. Surv Ophthalmol. 2013;58:387–429. doi: 10.1016/j.survophthal.2012.12.001. [DOI] [PubMed] [Google Scholar]
- 32.Liu G, Tan O, Gao SS, Pechauer AD, Lee B, Lu CD, Fujimoto JG, Huang D. Opt Express. 2015;23:9824–9834. doi: 10.1364/OE.23.009824. [DOI] [PMC free article] [PubMed] [Google Scholar]
- 33.Shields CL, Manalac J, Das C, Saktanasate J, Shields JA. Indian J Ophthalmol. 2015;63:128–132. doi: 10.4103/0301-4738.154384. [DOI] [PMC free article] [PubMed] [Google Scholar]
- 34.Sugiyama S, Hong YJ, Kasaragod D, Makita S, Uematsu S, Ikuno Y, Miura M, Yasuno Y. Biomed Opt Express. 2015;6:4951–4974. doi: 10.1364/BOE.6.004951. [DOI] [PMC free article] [PubMed] [Google Scholar]
- 35.Adhi M, Badaro E, Liu JJ, Kraus MF, Baumal CR, Witkin AJ, Hornegger J, Fujimoto JG, Duker JS, Waheed NK. Am J Ophthalmol. 2016;162:140–149.e141. doi: 10.1016/j.ajo.2015.10.025. [DOI] [PMC free article] [PubMed] [Google Scholar]
- 36.Wang B, Lu R, Zhang Q, Jiang Y, Yao X. Opt Lett. 2013;38:4526–4529. doi: 10.1364/OL.38.004526. [DOI] [PMC free article] [PubMed] [Google Scholar]
- 37.Wang B, Zhang Q, Lu R, Zhi Y, Yao X. Opt Lett. 2014;39:6923–6926. doi: 10.1364/OL.39.006923. [DOI] [PMC free article] [PubMed] [Google Scholar]
- 38.Wang B, Lu Y, Yao X. J Biomed Opt. 2016;21:96010. doi: 10.1117/1.JBO.21.9.096010. [DOI] [PMC free article] [PubMed] [Google Scholar]
- 39.Son T, Wang BQ, Thapa D, Lu YM, Chen YJ, Cao DC, Yao XC. Biomed Opt Express. 2016;7:3151–3162. doi: 10.1364/BOE.7.003151. [DOI] [PMC free article] [PubMed] [Google Scholar]
- 40.Werkmeister RM, Vietauer M, Knopf C, Furnsinn C, Leitgeb RA, Reitsamer H, Groschl M, Garhofer G, Vilser W, Schmetterer L. J Biomed Opt. 2014;19:106008. doi: 10.1117/1.JBO.19.10.106008. [DOI] [PubMed] [Google Scholar]
- 41.Tan B, Mason E, MacLellan B, Bizheva KK. Invest Ophthalmol Vis Sci. 2017;58:1673–1681. doi: 10.1167/iovs.17-21543. [DOI] [PubMed] [Google Scholar]
- 42.Kashani AH, Chen CL, Gahm JK, Zheng F, Richter GM, Rosenfeld PJ, Shi Y, Wang RK. Prog Retin Eye Res. 2017;60:66–100. doi: 10.1016/j.preteyeres.2017.07.002. [DOI] [PMC free article] [PubMed] [Google Scholar]
- 43.Wang BQ, Zhang QX, Lu RW, Zhi YN, Yao XC. Opt Lett. 2014;39:6923–6926. doi: 10.1364/OL.39.006923. [DOI] [PMC free article] [PubMed] [Google Scholar]
- 44.Newman EA. J Cereb Blood Flow Metab. 2013;33:1685–1695. doi: 10.1038/jcbfm.2013.145. [DOI] [PMC free article] [PubMed] [Google Scholar]
- 45.Palkovits S, Lasta M, Told R, Schmidl D, Werkmeister R, Cherecheanu AP, Garhofer G, Schmetterer L. Sci Rep. 2015;5:18291. doi: 10.1038/srep18291. [DOI] [PMC free article] [PubMed] [Google Scholar]
- 46.Kornfield TE, Newman EA. J Neurosci. 2014;34:11504–11513. doi: 10.1523/JNEUROSCI.1971-14.2014. [DOI] [PMC free article] [PubMed] [Google Scholar]
- 47.Duong TQ, Pardue MT, Thule PM, Olson DE, Cheng H, Nair G, Li Y, Kim M, Zhang X, Shen Q. NMR Biomed. 2008;21:978–996. doi: 10.1002/nbm.1311. [DOI] [PMC free article] [PubMed] [Google Scholar]
- 48.Country MW. Brain Res. 2017;1672:50–57. doi: 10.1016/j.brainres.2017.07.025. [DOI] [PubMed] [Google Scholar]
- 49.Lau JC, Linsenmeier RA. Exp Eye Res. 2012;102:50–58. doi: 10.1016/j.exer.2012.07.004. [DOI] [PMC free article] [PubMed] [Google Scholar]
- 50.Biesecker KR, Srienc AI, Shimoda AM, Agarwal A, Bergles DE, Kofuji P, Newman EA. J Neurosci. 2016;36:9435–9445. doi: 10.1523/JNEUROSCI.1782-16.2016. [DOI] [PMC free article] [PubMed] [Google Scholar]