Abstract
Studies have suggested that higher meat intake may increase Colorectal Cancer (CRC) risk while higher vegetable intake may reduce this risk. There is a substantial lag between the time of exposure to a risk factor (or protective factor) and incidence of cancer. For CRC, in particular, the time from formation of adenoma to occurrence of CRC takes from 10–15 years, or even more.
This study correlates food disappearance data per capita for vegetable and meat with future age-adjusted CRC rates in the US.
The lag weights, with a high confidence, showed that there is a positive correlation between the red meat availability and CRC age-adjusted incidence rates with a lag of at least 17 years and an Almon polynomial degree of 2. Conversely, there was a negative correlation between vegetables availability and future age-adjusted incidence rates of CRC.
Keywords: Colorectal cancer, incidence, risk factor, food availability
1. Introduction
All over the world, cancer is a major human’s health concern. Colorectal Cancer (CRC) is the third most common cancer worldwide. The adenoma to carcinoma process for colorectal cancer takes from 10–15 years or more (Kamangar et al. 2006). According to different studies several dietary and non-dietary risk factors can be associated with CRC incident rate (Sasso and Latella 2017). Although these associations have been inconsistent across the studies, among the dietary risk factors the high consumption of red meat and low intake of fruits and vegetables have been considered as two of well-known risk factors for colorectal cancer (Kamangar et al. 2006; WCRF/AICR 2007; Randi et al. 2010; Patel and De 2016; Canchola et al. 2017). Also, some studies have shown that rates of CRC in areas in which people have “western” dietary pattern is higher compare to the places of the world in which their residences have “healthy” diet such as Asia or Pacific Islands (D’Alessandro et al. 2016; Grosso et al. 2017; Siegel et al. 2017) and places with Mediterranean diet (Farinetti et al. 2017). One of the important characteristic of healthy dietary pattern is high consumption of fruits and vegetables. In contrast, one of the distinguishing items about “western” dietary pattern is great consumption of red meat (Randi et al. 2010; Magalhães et al. 2012). Rather than possible role of diet in prevention of colorectal cancer, diet after colorectal cancer diagnosis might be connected to quality of life, disease recurrence, and survival (Van Blarigan and Meyerhardt 2015).
In Figure 1 we have shown the temporal behavior of the CRC rate and US food availability (for red meat, vegetable, fruit, and poultry) (Bentley 2017). The CRC incident rate in the United States reached a maximum around 1985, and then it started to decline continuously (Figure 1) (NCI April 2016, based on the November 2015 submission.). Rapid decline of the CRC rate has been attributed to an increase in CRC screening, such as colonoscopy among individuals above 50 years old (Kamangar et al. 2006; Murphy et al. 2016). The red meat consumption has continuously decreased from 1970 to 2014 whilst the poultry consumption is increasing. Nevertheless of a few inconsistencies in the pattern, in overall from year 1970 to 2014 the consumption of fruits and vegetables has increased as seen in Figure 1.
Figure 1.
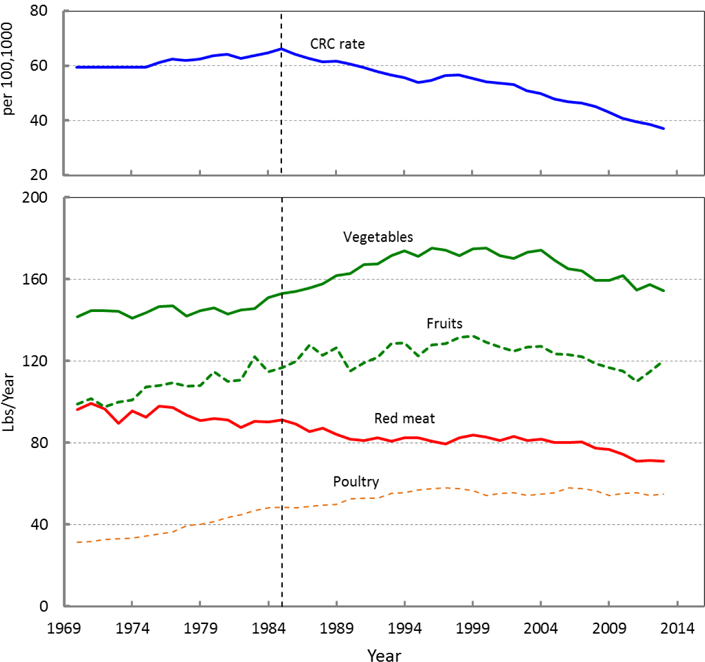
Temporal behaviour of the CRC rate and food availability in the US.
The associations between dietary patterns and CRC rate is usually investigated through cohort and population-based case-control studies, which deal with limited time and group of people (Miller et al. 2010). In this study we attempt to introduce a new approach for investigating the relationship between food and CRC rate. Here we find the association of the food availability in the United States to the CRC rate nationwide. In this approach we use a technique well known to the economic community, so called distributed lag model (Gujarati Damoder N 2009). Using this model, time series are studied using a regression equation to predict current values of a dependent variable based on the past period (lag) values of the explanatory variable. In our case the CRC rate at current year is associated to the cumulative effects of the foods consumed in previous years.
In section 2 we present the sources of the data and explain the distributed lag model, in section 3 the results are given, following by discussion and conclusions in sections 4 and 5, respectively.
2. Materials and methods
2.1. Data sources
The data for CRC incident rate were retrieved from the Surveillance, Epidemiology, and End Results (SEER) of the National Cancer Institute (NCI April 2016, based on the November 2015 submission.). Databases of SEER contain the epidemiologic information on the incident and survival rates in the US. The data are compiled from population-based registries covering approximately 28% of the US population. We have used the age-adjusted cancer rate of SEER. The age-adjusted incidence rates are standardized to the 2000 US standard population and expressed per 100,000 populations. These data are also adjusted for delays in reporting (Lewis et al. 2016).
The loss-adjusted food availability data were obtained from the Economic Research Service (ERS) of USDA (Bentley 2017). The loss-adjusted food availability data are derived by adjusting the food availability for food spoilage, plate waste, and other losses and converts the data to daily per capita amounts (Wells and Buzby 2008; Buzby and Hyman 2012). The data can be considered as proxies for actual food consumption at the national level (Wells and Buzby 2008). It should be noted that the best way to collect detailed information about the consumption habits is the completion of a food consumption survey.
2.2. Statistical analysis
The schematic diagram of the objective of this study is shown in Figure 2. In this study, we attempt to find a model, as shown in Figure 2a, which relates the cancer rate at a certain year to the food consumption in preceding years (lag effect). This model can have a mathematical form. Here, we consider a linear model. In this linear model the food consumed in each year at and before the year of cancer diagnosis multiplied by a coefficient (βs in Figure 2), and then the results are summed up to estimate the cancer rate. In statistics, the coefficients βs are so called linear parameter estimates to be calculated, the cancer rate is dependent variable, and food consumptions are called the predictors.
Figure 2.
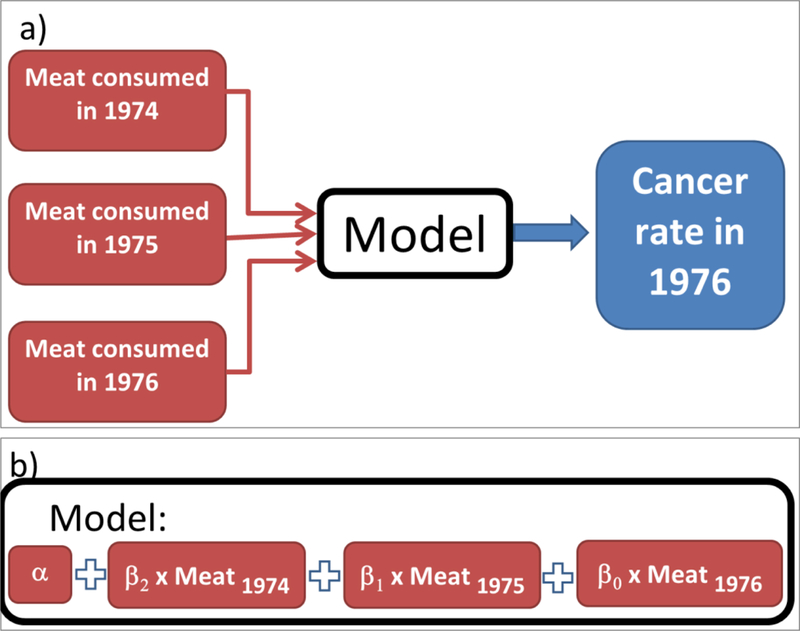
Schematic representation of the study.
As an example, if a lag of 2 years is considered for analysis, the problem is to find 3 unknown βs and one unknown α. Therefore, at least 4 equations are needed to solve the 2 years-lag problem. An example of such a problem and the method to construct the equations are shown in Figure 3, where the colorectal cancer rate in each year (CRCt) is related to meat consumptions within past 2 years (t, t-1, and t-2):
Figure 3.
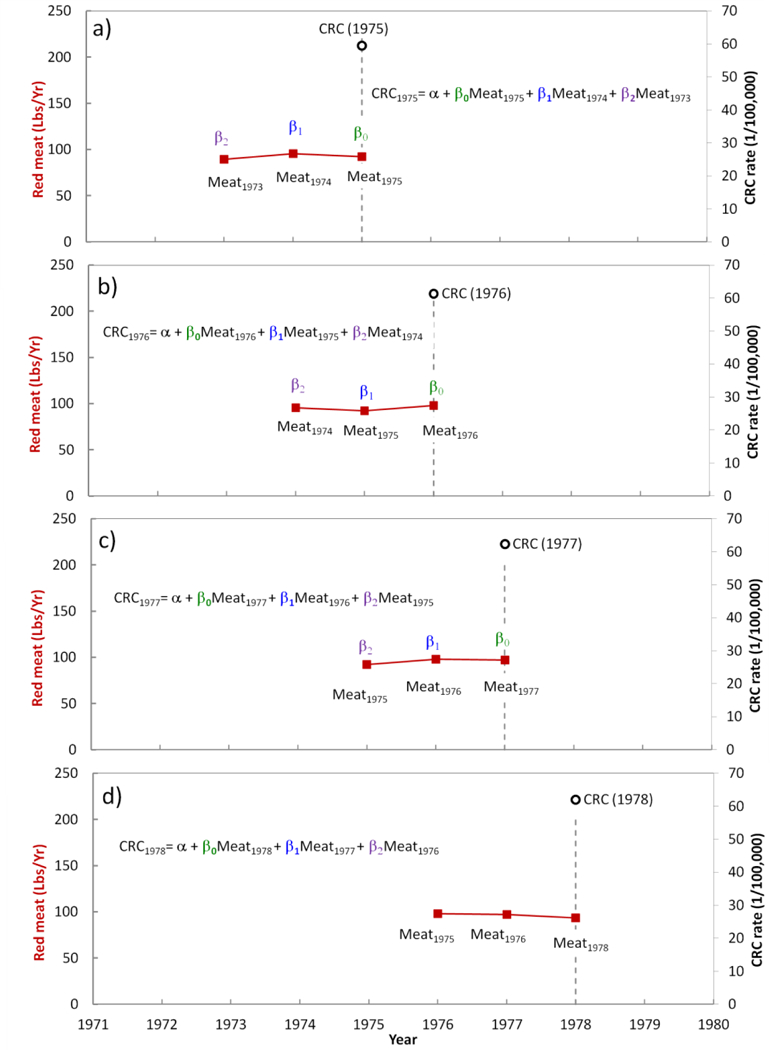
Distributed lag model for colorectal cancer and meat consumption with a lag of 2 years. The model should predict the cancer rate in a certain year to the meat consumed in that year and 2 years prior to the disgnosis.
In Figure 3a, as a demonstration we chose cancer rate at t=1975 and the goal is to find the effect of food consumption from two years before 1975, including 1975 (lag= 2). Therefore, we should calculate βs for 1975, 1974, and1973. In Figure 3b we set t=1976, and similarly in Figures 3c and 3d we set t=1977 and t=1978, respectively. All of the data up to t=2013 can be used to construct the regression model for estimating βs and α. The maximum lag length is limited by availability of data points (observations). However, preferably the lag length should be considerably smaller than the number of observations (data points). An ordinary least square fit is used to solve the equations.
The length of the lag is decided by iteration as long as i) the t-statistics of each coefficient is significant, ii) R2 is high, and iii) Akaike information criterion (AIC) are low (see appendix A also reference (Gujarati Damodar N and Porter 1999)).
We also imposed a restriction on the endpoints so that β−1=0 and βn+1=0. In our case this means that the effect of the food consumed at year t+1 and t-(n+1) has no effect on the cancer rate at year t. For example, if the lag is selected to be 20 years for the cancer rate in the current year, the food consumed next year, and the food consumed 21 years ago have no effect on the current year’s cancer rate.
The analysis was done on the effect of red meat, vegetables, and fruits on CRC rate. The number of the data pair for each analysis is 44. Therefore, according to equation 2, the maximum lag (n) can be as large as 22. However, larger the lag is, wider the t-distribution function will be, which leads to a larger p-value. We limit the lag length to have a maximum value of 20 years. For the same reason the effect of the different foods on CRC had to be studied separately.
Calculations were performed in package PDLREG of the software system SAS 9.3 (SAS Institute, Cary NC).
3. Results
The calculations were initially done to investigate the effect of red meat on CRC rate. We ran the software with different lags (lag of 10 to lag of 20 years). The SAS software system returns some statistical report on the ordinary least square estimates, polynomial estimates, endpoints constraints, and the lag distribution estimates. We start by looking at the p-values for the endpoints. The results are shown in Figure 4. As it is seen in this figure, p-values for the near-end constraints are less than 0.01 for all lag lengths. However, the p-values are high for the far-end constraint when the lag length is small, which makes the results statistically insignificant. For lags larger than 17 years the far-end constraint’s p-value drops below 0.01 and at lag of 20 years it is less than 0.001. This indicates that considering the effect of red meat within 17 years or a longer period before the CRC diagnosis leads to statistically significant results. On the other hand, for the vegetables endpoints analysis the p-value is less than 0.001 for all the lag lengths between 10–20 years. The AIC values also reduce by increasing the lag. The AIC is 189 with lag of 10 years and that it is 125 for lag of 20 years. The R2 value is > 0.8 for all cases.
Figure 4.
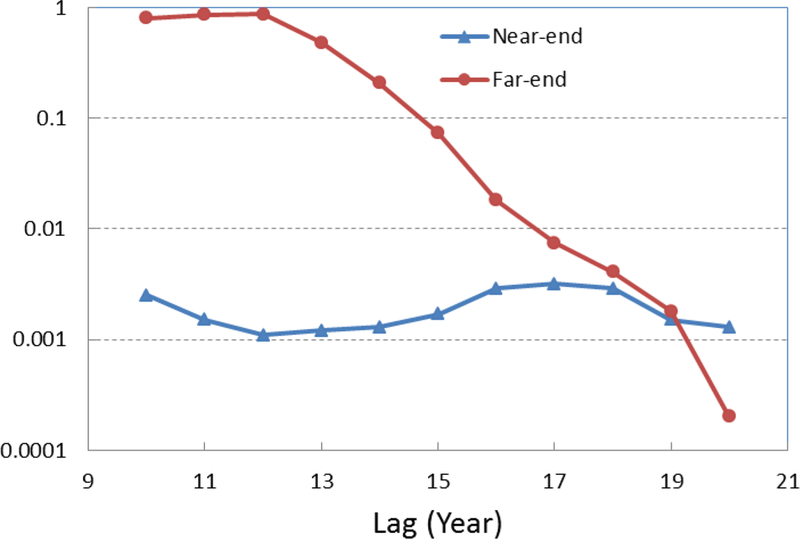
The p-values of endpoint constraints for effect of red meat on CRC. The p-value decreases as the lag increases. Lags of greater than 17 years are statistically significant (both endpoints have small p-values).
The second important factor to be determined is the degree of the polynomial in equation A4. We repeated the calculations for different polynomial degrees and we found that a quadratic polynomial (m=2) is sufficient for analysis. The outputs of SAS software system for the polynomial parameter estimates for lag of 20 years are shown in Table 1. As it is seen in Table 1, the linear part of the polynomial (a1) has a value of zero (see also Equation 4). This means that the relationship between red meat consumption and CRC rate is not linear. Similar results were obtained with the effect of vegetables and fruits on the CRC rate. The coefficient for a2 is significant indicating that the effect of the red meat consumption on the CRC rate obeys a parabolic relationship and its effect on CRC rate at a certain year depends on how long ago the red meat has been consumed.
Table 1.
The SAS output for the polynomial parameters estimates for the effect of red meat on CRC rate (Equation 4). The parameter estimates of zero for a1 indicates that the equation is parabolic and there is no linear correlation between meat consumption and CRC rate.
| Parameter Estimates | |||||
|---|---|---|---|---|---|
| Variable | DF | Estimate | Standard Error | t Value | P-Value |
| Intercept (α) | 1 | −96.5968 | 15.6279 | −6.18 | <.0001 |
| a0 | 1 | 0.3789 | 0.0402 | 9.43 | <.0001 |
| a1 | 1 | 0 | 0 | ||
| a2 | 1 | −0.1468 | 0.0156 | −9.43 | <.0001 |
After finding that a lag=20 years and polynomial of degree 2 lead to statistically acceptable calculations, we consider this value of lag for the study. In Figure 5 we have shown the calculated CRC rate (solid line) overlaid on the CRC rate data from SEER database (open circle). The shaded area shows the standard error.
Figure 5.
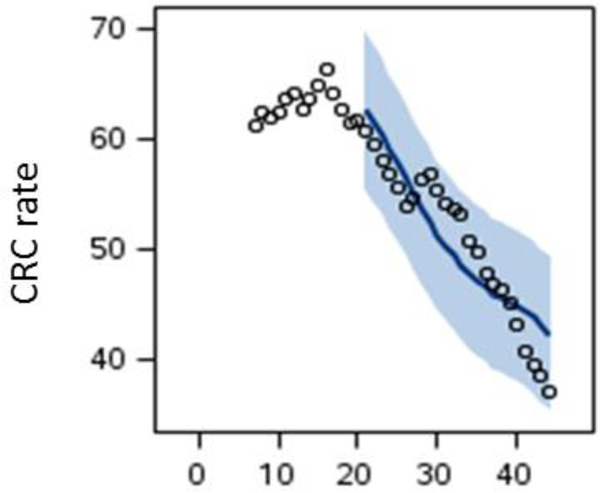
The predicted CRC rate (solid line) based on red meat consumption overlaid on the CRC rate data from SEER (open circles).
The estimates of the lag distribution (βi) for red meat, vegetables, fruits, and total fruits and vegetable consumption i.e. fruits (Lbs/Yr)+Vegetables (Lbs/Yr) are shown in Figure 6. It is clearly seen that the effect of red meat on CRC rate is positive whilst the effects of the vegetables and fruit alone and together are negative. These results are in agreement with the some of the studies in literature (Randi et al. 2010; Patel and De 2016). The results also agree with the results of a systematic review of the relation between Mediterranean diet and colorectal cancer (Farinetti et al. 2017). Mediterranean diet which is characterized by a high consumption of fruits, vegetables, and carbohydrates and low consumption of meat is associated with reduction of CRC initiation and progression (Farinetti et al. 2017). Worth noting that the p-value for all the estimated parameters are less than 0.001 which satisfies the first criteria presented in section 2 for a meaningful calculation.
Figure 6.
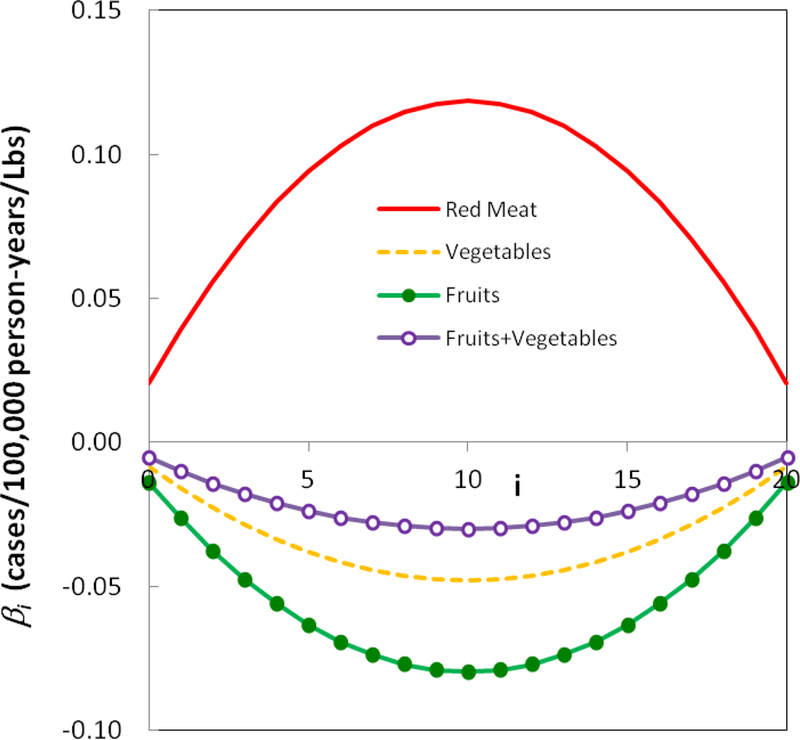
Coefficients for lag=20 years. Red meat has a positive effect on the CRC rate whilst fruits and vegetables have a negative effect.
The long-run or total impact of foods under study (Equation 2) is presented in Table 2. Red meat has the highest impact on the CRC rate which is a positive impact whilst the fruits have the highest negative impact on CRC rate.
Table 2.
The long-run total impact (Equation 5) of the foods under study with a lag of 20 year. The unit is cases/100,000 person-years/Lbs.
| Meat | Vegetables | Fruits |
|---|---|---|
| 1.74 | −0.70 | −1.17 |
The parameter β*i, for meat calculations for a lag of 20 years at different years before CRC diagnosis is shown in Figure 7. The analysis with vegetables and fruits leads to same results. For a lag of 20 years, the food consumed 10 years before the CRC diagnosis has the greatest impact. The effect of the food consumed 10 years before CRC diagnosis has an impact of almost 6 times of that at 20 years before the diagnosis.
Figure 7.
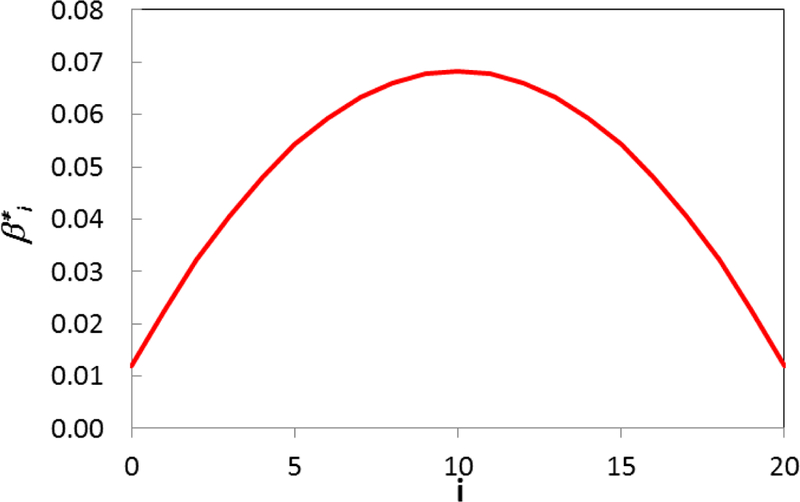
The total impact felt by a certain time, , for meat. The analysis with vegetables and fruits leads to same results. For a lag=20 years, the food consumed 10 years before the CRC diagnosis has the greatest impact (almost 6 times the food consumed 20 years before the diagnosis).
4. Discussion
As it is seen in Figure 1 the CRC rate is declining since 1985 while the decline in red meat availability was started even earlier. According to the recent studies, screening is one of the important non-dietary risk factors in declining the CRC rate (Murphy et al. 2016). On the other hand, many research in different parts of the world talked about the increasing effects of high intake of red meat on CRC rate (Chao et al. 2005; Larsson and Wolk 2006; Chan et al. 2011; McCullough et al. 2013; Safari et al. 2013; Chen et al. 2015; Tayyem et al. 2017). Using distributed lag model, we also showed that the red meat has a positive effect on the CRC rate; therefore the observation of the reduction in red meat availability could be a reason for the reduction in cancer rates rather than non-dietary risk factors. There are several possible theories for increasing effect of red meat on CRC risk. One of the theories related to increase the intake of heme iron by increasing consumption of red meat. Through several mechanisms heme iron elevate cytotoxicity and stimulation of an inflammatory response, which can increase risk of CRC (Knöbel et al. 2007). Another theory is connected to the production malondialdehyde, through consumption of red meat. Malondialdehyde can cause DNA degeneration and can be considered as a carcinogenic substance (O’Callaghan et al. 2012). Also, applying frying or grilling methods at high temperatures for preparing red meat can cause degradation of muscle creatinine and amino acids, which can lead to the formation of abundant carcinogenic heterocyclic amines (Sugimura et al. 2004; Martinez et al. 2007). Moreover, carcinogenic N-nitroso compounds are formed through the digestion of red meat in gastrointestinal tract (O’Callaghan et al. 2012).
We also observed a negative effect of poultry availability on the CRC rate (results not shown). This is consistent with some other studies, which found inverse or no association between poultry intake and CRC risk (Tiemersma et al. 2002; Chao et al. 2005; Norat et al. 2005; Makambi et al. 2011; Shi et al. 2015; Carr et al. 2016). However, this negative effect might be because of the reduction in red meat consumption. In Figure 8 we have shown the relationship between poultry and red meat availabilities. The data clearly show that there is a linear relationship between red meat consumption reduction and increase in poultry consumption. This observation is consistent with the previously published results (Daniel, Cross, Graubard, et al. 2011; Daniel, Cross, Koebnick, et al. 2011). We fitted a linear equation to the data. It seems for each pound of increase in poultry availability, 0.7 pounds reduction in red meat availability is observed. The total meat consumption (red meat + poultry) stays within ~5% of 137 Lbs/year (Figure 9). In addition, some other studies showed that the negative effect of poultry might be related to an overall healthier diet and life style (Flood et al. 2008; Shi et al. 2015).
Figure 8.
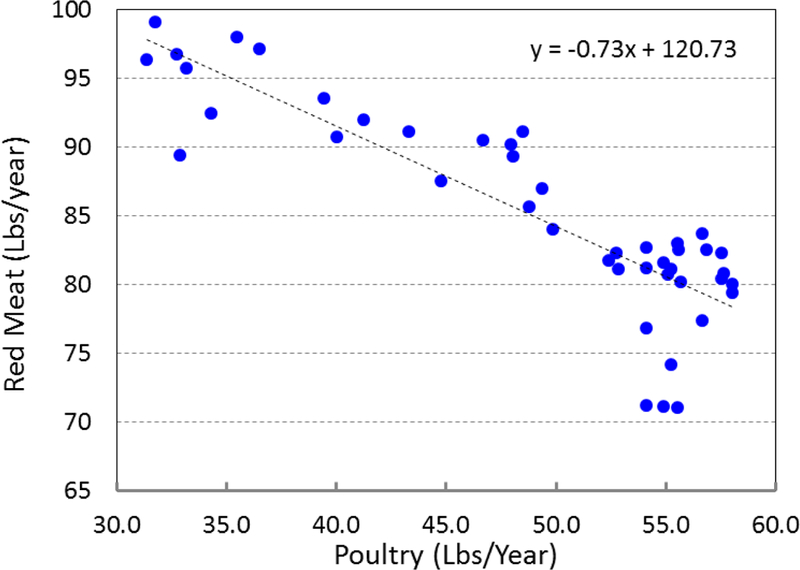
The consumption of red meat versus consumption of poultry in the period 1970–2013 (closed circles). Fitted equation (dashed line) shows that for each pound of consumed chicken, ~0.7 pound of reduction in meat consumption is observed.
Figure 9.
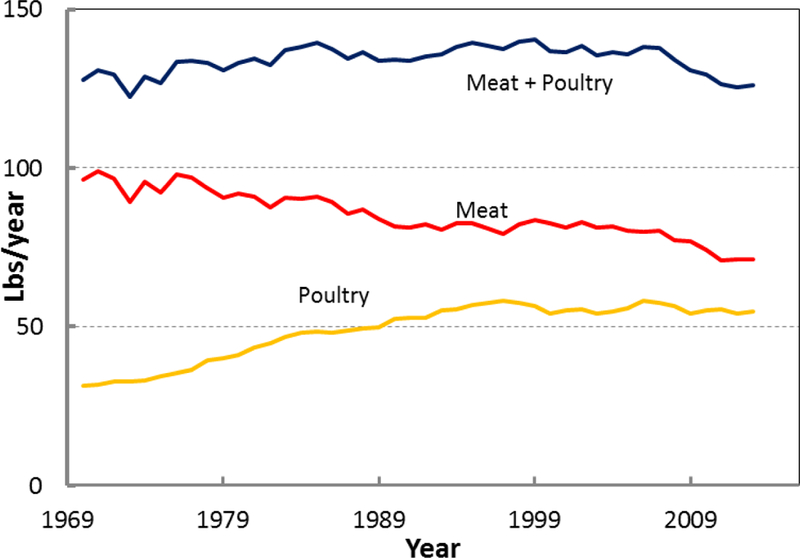
A decline in meat consumption is evident since 1970, which is associated with a rise in poultry consumption. The total red meat and poultry consumption is ~137 ± 6 Lbs/Yr.
Moreover, fruits and vegetables showed negative effect on CRC rate, which is confirmed by several other studies (Randi et al. 2010; Arafa et al. 2011; De Stefani et al. 2011; Safari et al. 2013; Chen et al. 2015; Farinetti et al. 2017).
The negative effect (protective effect) of fruits and vegetable might be related to high amount of fiber. Previous studies showed that high level of fiber in meal can reduce transit time through the gastrointestinal tract, dilute colonic contents, and increase bacterial fermentation, which can elevate the production of short-chain fatty acids (acetate, propionate, and butyrate) (Scharlau et al. 2009). Short-chain fatty acids themselves by involving in several regulators of the cell cycle showed negative effect on CRC rates (Feregrino-Perez et al.).
It has been found that plasma retinol and intakes of dietary β-carotene and vitamins E and C were inversely associated with colon cancer (Farinetti et al. 2017). It was suggested that consumption of fruit and vegetable has a protective effect on carcinogenesis based on components with antioxidantive properties (Young and Woodside 2001; Farinetti et al. 2017).
Moreover, another theory for negative effect of fruits and vegetables is related to existing anticancer phytochemicals such as polyphenols, carotenoids, terpenes, and thioethers in these groups of foods (Surh 2003).
Also, some studies showed that high intake of natural dietary folic acid, which can be found in leafy green vegetable can reduce risk of colorectal cancer and adenomas (Cole et al. 2007). In addition, various types of fruits and vegetable contains vitamin B6, which is one of the important anticancer substance (Larsson et al. 2010).
Regarding the source of food consumption data we would like to mention that two types of monitoring and surveillance data for assessing the concentration of a defined chemical in a food are frequently used: results of a random nature from stratified sampling plans or targeted sampling. The first tries to obtain a representative picture of chemical levels present in food whereas the second is aimed at sampling those products expected to contain higher levels in a cost effective way (Kroes et al. 2002). Targeted data are often collected for enforcement purposes in response to specific problems. They should be used with caution in dietary exposure assessment, as they may not be representative of all food available for sale (WHO 2009). A Total Diet Study (TDS) consists of selecting, collecting and analyzing commonly consumed food purchased at retail level, processing the food as for consumption, pooling the prepared food items into representative food groups, homogenizing the pooled samples, and analyzing them for harmful and beneficial chemical substances. TDSs are designed to cover the average diet or the most commonly consumed foods, based on data from dietary surveys, in a country or by a specific population group.
In principle, a TDS should provide the most accurate measure of the average amount of a chemical actually ingested through food by the population or population subgroups living in a country. The data from a TDS also differ from data obtained from other monitoring or surveillance programs in that concentrations of chemicals are measured in foods after they have been prepared for normal consumption. However, the accuracy of a TDS survey depends on the sampling design and, in particular, on the sample size. The TDS method might not be suitable for the assessment of acute dietary exposures when a high degree of compositing of samples is used since high contamination of less consumed foods might be masked by the dilution effect (WHO 2009). Individual dietary surveys are the best surveys that provide information on the distribution of food consumption in well-defined groups of individuals and are therefore preferred for the assessment of dietary exposure within the risk assessment process (Kroes et al. 2002; WHO 2009).
5. Conclusions
In this manuscript we found a relationship between certain food availabilities in the US and CRC rate. A technique well-known to the economic community, so called, distributed lag mode was used to find a relationship between food consumed in past to the CRC rate in a later time. It was found that red meat, as expected, has a positive impact on CRC rate whilst fruits and vegetables (rich sources of dietary fibers) have negative impacts on the CRC rate. Distributed lag model can be used as a useful technique to study the effect of nutrition on different disease.
Acknowledgements
The authors would like to acknowledge Dr. Kim Sydnor and Dr. Farin Kamangar for their continuous support.
Appendix: Almon distributed lag model
Algebraically, we can represent the lag effect by considering that a change in food availability xt at time t has an effect on CRC rates yt, yt+1, yt+2 …. On the other hand, we can say that yt is affected by the values of xt, xt-1, xt-2…, or
As a first approximation it is assumed that the functional form is linear, so that the finite lag model, with an additive error term, is
Solving Equation 2 with a linear regression technique will lead to estimates of coefficients. If there are T data pairs (yt,xt) then only T-n-2 complete data pairs are available for estimation because n data pairs are lost in creating the regression equations for β1-βn, one equation for β0, and another one for α. Therefore, long enough data needed to construct the distributed-lag model. If many lags are included, then the degree of freedom is lost and it makes the statistical interpretation unreliable.
Equation 2 can be rewritten as
In Almon polynomial model, in order to solve the problem, βi is represented and approximated by a suitable-degree polynomial in i, the length of the lag:
which is an mth-degree polynomial in i. The value of m is determined by iteration; the calculations are repeated with different values of m until the estimate of am is statistically insignificant. The goodness of fit is measured not only by R2, but also by another criterion so called Akaike’s AIC:
SSE is the sum of squared errors of prediction, which is sum of the squares of residuals (deviations predicted from actual empirical values of data).
The parameter β0 is known as the short run multiplier, or impact multiplier. The summation of all βs
is called the long run multiplier or total multiplier. Another parameter is gives the proportion of the long run, or total impact felt by a certain period.
References
- Arafa MA, Waly MI, Jriesat S, Al Khafajei A, Sallam S. 2011. Dietary and lifestyle characteristics of colorectal cancer in Jordan: a case-control study. Asian Pac J Cancer Prev. 12(8):1931–1936. [PubMed] [Google Scholar]
- Bentley J 2017. U.S. Trends in Food Availability and a Dietary Assessment of LossAdjustedFood Availability, 1970–2014. U.S. Department of Agriculture, Economic Research Service. [Google Scholar]
- Buzby JC, Hyman J. 2012. Total and per capita value of food loss in the United States. Food Policy. 37(5):561–570. [Google Scholar]
- Canchola AJ, Shariff-Marco S, Yang J, Albright C, Hertz A, Park S-Y, Shvetsov YB, Monroe KR, Le Marchand L, Gomez SL. 2017. Association between the neighborhood obesogenic environment and colorectal cancer risk in the Multiethnic Cohort. Cancer Epidemiology. 50:99–106. [DOI] [PMC free article] [PubMed] [Google Scholar]
- Carr PR, Walter V, Brenner H, Hoffmeister M. 2016. Meat subtypes and their association with colorectal cancer: Systematic review and meta‐analysis. International journal of cancer. 138(2):293–302. [DOI] [PubMed] [Google Scholar]
- Chan DS, Lau R, Aune D, Vieira R, Greenwood DC, Kampman E, Norat T. 2011. Red and processed meat and colorectal cancer incidence: meta-analysis of prospective studies. PloS one. 6(6):e20456. [DOI] [PMC free article] [PubMed] [Google Scholar]
- Chao A, Thun MJ, Connell CJ, et al. 2005. Meat consumption and risk of colorectal cancer. JAMA. 293(2):172–182. [DOI] [PubMed] [Google Scholar]
- Chen Z, Wang PP, Woodrow J, Zhu Y, Roebothan B, Mclaughlin JR, Parfrey PS. 2015. Dietary patterns and colorectal cancer: results from a Canadian population-based study. Nutrition journal. 14(1):8. [DOI] [PMC free article] [PubMed] [Google Scholar]
- Cole BF, Baron JA, Sandler RS, Haile RW, Ahnen DJ, Bresalier RS, McKeown-Eyssen G, Summers RW, Rothstein RI, Burke CA. 2007. Folic acid for the prevention of colorectal adenomas: a randomized clinical trial. Jama. 297(21):2351–2359. [DOI] [PubMed] [Google Scholar]
- D’Alessandro A, De Pergola G, Silvestris F. 2016. Mediterranean Diet and cancer risk: an open issue. International Journal of Food Sciences and Nutrition. 67(6):593–605. [DOI] [PubMed] [Google Scholar]
- Daniel CR, Cross AJ, Graubard BI, Hollenbeck AR, Park Y, Sinha R. 2011. Prospective Investigation of Poultry and Fish Intake in Relation to Cancer Risk. Cancer Prevention Research. 4(11):1903–1911. [DOI] [PMC free article] [PubMed] [Google Scholar]
- Daniel CR, Cross AJ, Koebnick C, Sinha R. 2011. Trends in meat consumption in the USA. Public Health Nutrition. 14(4):575–583. [DOI] [PMC free article] [PubMed] [Google Scholar]
- De Stefani E, Deneo-Pellegrini H, Ronco AL, Correa P, Boffetta P, Aune D, Acosta G, Mendilaharsu M, Luaces ME, Landó G. 2011. Dietary patterns and risk of colorectal cancer: a factor analysis in Uruguay. Asian Pac J Cancer Prev. 12(3):753–759. [PubMed] [Google Scholar]
- Farinetti A, Zurlo V, Manenti A, Coppi F, Mattioli AV. 2017. Mediterranean diet and colorectal cancer: A systematic review. Nutrition. 43:83–88. [DOI] [PubMed] [Google Scholar]
- Feregrino-Perez AA, Berumen LC, Garcia-Alcocer G, Guevara-Gonzalez ROG, Ramos-Gomez M, Reynoso-Camacho R, Acosta-Gallegos JA, Loarca-Pin G. Composition and Chemopreventive Effect of Polysaccharides from Common Beans (Phaseolus vulgaris L.) on Azoxymethane-Induced Colon Cancer. [DOI] [PubMed]
- Flood A, Rastogi T, Wirfält E, Mitrou PN, Reedy J, Subar AF, Kipnis V, Mouw T, Hollenbeck AR, Leitzmann M. 2008. Dietary patterns as identified by factor analysis and colorectal cancer among middle-aged Americans. The American journal of clinical nutrition. 88(1):176–184. [DOI] [PMC free article] [PubMed] [Google Scholar]
- Grosso G, Marventano S, D’Urso M, Mistretta A, Galvano F. 2017. The Mediterranean healthy eating, ageing, and lifestyle (MEAL) study: rationale and study design. International Journal of Food Sciences and Nutrition. 68(5):577–586. [DOI] [PubMed] [Google Scholar]
- Gujarati DN. 2009. Basic econometrics. Tata McGraw-Hill Education. [Google Scholar]
- Gujarati DN, Porter DC. 1999. Essentials of econometrics.
- Kamangar F, Dores GM, Anderson WF. 2006. Patterns of cancer incidence, mortality, and prevalence across five continents: defining priorities to reduce cancer disparities in different geographic regions of the world. Journal of clinical oncology. 24(14):2137–2150. [DOI] [PubMed] [Google Scholar]
- Knöbel Y, Weise A, Glei M, Sendt W, Claussen U, Pool-Zobel B. 2007. Ferric iron is genotoxic in non-transformed and preneoplastic human colon cells. Food and chemical toxicology. 45(5):804–811. [DOI] [PubMed] [Google Scholar]
- Kroes R, Müller D, Lambe J, Löwik M, Van Klaveren J, Kleiner J, Massey R, Mayer S, Urieta I, Verger P. 2002. Assessment of intake from the diet. Food and Chemical Toxicology. 40(2–3):327–385. [DOI] [PubMed] [Google Scholar]
- Larsson SC, Orsini N, Wolk A. 2010. Vitamin B6 and risk of colorectal cancer: a meta-analysis of prospective studies. Jama. 303(11):1077–1083. [DOI] [PubMed] [Google Scholar]
- Larsson SC, Wolk A. 2006. Meat consumption and risk of colorectal cancer: a meta‐analysis of prospective studies. International journal of cancer. 119(11):2657–2664. [DOI] [PubMed] [Google Scholar]
- Lewis DR, Chen HS, Cockburn M, Wu XC, Stroup AM, Midthune DN, Krapcho MF, Miller DG, Penberthy L, Feuer EJ. 2016. Preliminary estimates of SEER cancer incidence for 2013. Cancer. 122(10):1579–1587. [DOI] [PubMed] [Google Scholar]
- Magalhães B, Peleteiro B, Lunet N. 2012. Dietary patterns and colorectal cancer: systematic review and meta-analysis. European Journal of Cancer Prevention. 21(1):15–23. [DOI] [PubMed] [Google Scholar]
- Makambi KH, Agurs-Collins T, Bright-Gbebry M, Rosenberg L, Palmer JR, Adams-Campbell LL. 2011. Dietary patterns and the risk of colorectal adenomas: the Black Women’s Health Study. Cancer Epidemiology and Prevention Biomarkers. 20(5):818–825. [DOI] [PMC free article] [PubMed] [Google Scholar]
- Martinez ME, Jacobs ET, Ashbeck EL, Sinha R, Lance P, Alberts DS, Thompson PA. 2007. Meat intake, preparation methods, mutagens and colorectal adenoma recurrence. Carcinogenesis. 28(9):2019–2027. [DOI] [PubMed] [Google Scholar]
- McCullough ML, Gapstur SM, Shah R, Jacobs EJ, Campbell PT. 2013. Association Between Red and Processed Meat Intake and Mortality Among Colorectal Cancer Survivors. Journal of Clinical Oncology. 31(22):2773–2782. [DOI] [PMC free article] [PubMed] [Google Scholar]
- Miller PE, Lesko SM, Muscat JE, Lazarus P, Hartman TJ. 2010. Dietary patterns and colorectal adenoma and cancer risk: a review of the epidemiological evidence. Nutrition and cancer. 62(4):413–424. [DOI] [PubMed] [Google Scholar]
- Murphy CC, Sandler RS, Sanoff HK, Yang YC, Lund JL, Baron JA. 2016. Decrease in Incidence of Colorectal Cancer Among Individuals 50 Years or Older After Recommendations for Population-based Screening. Clinical Gastroenterology and Hepatology. [DOI] [PMC free article] [PubMed] [Google Scholar]
- mNCI. April 2016, based on the November 2015 submission. Surveillance, Epidemiology, and End Results (SEER) Program (www.seer.cancer.gov) Research Data (1973–2013),. National Cancer Institute, DCCPS, Surveillance Research Program, Surveillance Systems Branch.
- Norat T, Bingham S, Ferrari P, Slimani N, Jenab M, Mazuir M, Overvad K, Olsen A, Tjønneland A, Clavel F. 2005. Meat, fish, and colorectal cancer risk: the European Prospective Investigation into cancer and nutrition. Journal of the national cancer institute. 97(12):906–916. [DOI] [PMC free article] [PubMed] [Google Scholar]
- O’Callaghan NJ, Toden S, Bird AR, Topping DL, Fenech M, Conlon MA. 2012. Colonocyte telomere shortening is greater with dietary red meat than white meat and is attenuated by resistant starch. Clinical nutrition. 31(1):60–64. [DOI] [PubMed] [Google Scholar]
- Patel P, De P. 2016. Trends in colorectal cancer incidence and related lifestyle risk factors in 15–49-year-olds in Canada, 1969–2010. Cancer epidemiology. 42:90–100. [DOI] [PubMed] [Google Scholar]
- Randi G, Edefonti V, Ferraroni M, La Vecchia C, Decarli A. 2010. Dietary patterns and the risk of colorectal cancer and adenomas. Nutrition Reviews. 68(7):389–408. [DOI] [PubMed] [Google Scholar]
- Safari A, Shariff ZM, Kandiah M, Rashidkhani B, Fereidooni F. 2013. Dietary patterns and risk of colorectal cancer in Tehran Province: a case–control study. BMC Public Health. 13(1):222. [DOI] [PMC free article] [PubMed] [Google Scholar]
- Sasso A, Latella G. 2017. Dietary components that counteract the increased risk of colorectal cancer related to red meat consumption. International Journal of Food Sciences and Nutrition.1–13. [DOI] [PubMed] [Google Scholar]
- Scharlau D, Borowicki A, Habermann N, Hofmann T, Klenow S, Miene C, Munjal U, Stein K, Glei M. 2009. Mechanisms of primary cancer prevention by butyrate and other products formed during gut flora-mediated fermentation of dietary fibre. Mutation Research/Reviews in Mutation Research. 682(1):39–53. [DOI] [PubMed] [Google Scholar]
- Shi Y, Yu P-W, Zeng D- Z. 2015. Dose–response meta-analysis of poultry intake and colorectal cancer incidence and mortality. European journal of nutrition. 54(2):243–250. [DOI] [PubMed] [Google Scholar]
- Siegel RL, Miller KD, Fedewa SA, Ahnen DJ, Meester RG, Barzi A, Jemal A. 2017. Colorectal cancer statistics, 2017. CA: a cancer journal for clinicians. 67(3):177–193. [DOI] [PubMed] [Google Scholar]
- Sugimura T, Wakabayashi K, Nakagama H, Nagao M. 2004. Heterocyclic amines: Mutagens/carcinogens produced during cooking of meat and fish. Cancer Science. 95(4):290–299. [DOI] [PMC free article] [PubMed] [Google Scholar]
- Surh Y-J. 2003. Cancer chemoprevention with dietary phytochemicals. Nature reviews Cancer. 3(10):768. [DOI] [PubMed] [Google Scholar]
- Tayyem RF, Bawadi HA, Shehadah I, Agraib LM, AbuMweis SS, Al-Jaberi T, Al-Nusairr M, Bani-Hani KE, Heath DD. 2017. Dietary patterns and colorectal cancer. Clinical Nutrition. 36(3):848–852. [DOI] [PubMed] [Google Scholar]
- Tiemersma EW, Kampman E, de Mesquita HBB, Bunschoten A, van Schothorst EM, Kok FJ, Kromhout D. 2002. Meat consumption, cigarette smoking, and genetic susceptibility in the etiology of colorectal cancer: results from a Dutch prospective study. Cancer Causes & Control. 13(4):383–393. [DOI] [PubMed] [Google Scholar]
- Van Blarigan EL, Meyerhardt JA. 2015. Role of physical activity and diet after colorectal cancer diagnosis. Journal of Clinical Oncology. 33(16):1825–1834. [DOI] [PMC free article] [PubMed] [Google Scholar]
- WCRF/AICR. 2007. Food, Nutrition, Physical Activity, and the Prevention of Cancer: a Global Perspective. Washington, DC. Project Report No.
- Wells HF, Buzby JC. 2008. Dietary assessment of major trends in US food consumption, 1970–2005. US Department of Agriculture, Economic Research Service Washington. WHO; 2009. Principles and methods for the risk assessment of chemicals in food. [Google Scholar]
- Young I, Woodside J. 2001. Antioxidants in health and disease. Journal of clinical pathology. 54(3):176–186. [DOI] [PMC free article] [PubMed] [Google Scholar]


