

Abstract
A biomarker is a characteristic that is measured as an indicator of normal biologic processes, pathogenic processes, or responses to an exposure or intervention, including therapeutic interventions. Biomarker modalities include molecular, histologic, radiographic, or physiologic characteristics. In 2015, the FDA-NIH Joint Leadership Council developed the BEST Resource (Biomarkers, EndpointS, and other Tools) to improve the understanding and use of biomarker terminology in biomedical research, clinical practice, and medical product development. The BEST biomarker categories include: (a) susceptibility/risk biomarkers, (b) diagnostic bio-markers, (c) monitoring biomarkers, (d) prognostic biomarkers, (e) predictive biomarkers, (f) pharmacodynamic/response biomarkers, and (g) safety biomarkers. Here we review 30 epilepsy biomarker studies that have identified (a) diagnostic biomarkers for epilepsy, epileptogenesis, epileptogenicity, drug-refractoriness, and status epilepticus - some of the epileptogenesis and epileptogenicity biomarkers can also be considered prognostic biomarkers for the development of epilepsy in subjects with a given brain insult, (b) predictive biomarkers for epilepsy surgery outcome, and (c) a response biomarker for therapy outcome. The biomarker modalities include plasma/serum/exosomal and cerebrospinal fluid molecular biomarkers, brain tissue molecular bio-markers, imaging biomarkers, electrophysiologic biomarkers, and behavioral/cognitive biomarkers. Both single and combinatory biomarkers have been described. Most of the reviewed biomarkers have an area under the curve > 0.800 in receiver operating characteristics analysis, suggesting high sensitivity and specificity. As discussed in this review, we are in the early phase of the learning curve in epilepsy biomarker discovery. Many of the seven biomarker categories lack epilepsy-related biomarkers. There is a need for epilepsy biomarker discovery using proper, statistically powered study designs with validation cohorts, and the development and use of novel analytical methods. A strategic roadmap to discuss the research priorities in epilepsy biomarker discovery, regulatory issues, and optimization of the use of resources, similar to those devised in the cancer and Alzheimer’s disease research areas, is also needed.
Keywords: Antiepileptogenesis, Area under the curve, Diagnosis, Electroencephalogram, Epileptogenesis, Magnetic resonance imaging, microRNA, Receiver operating characteristics
1. Introduction
Globally, an estimated 2.4 million people are diagnosed with epilepsy each year. Thus, a new person is diagnosed with epilepsy every 13 s (http://www.who.int/mediacentre/factsheets/fs999/en). In 60% of those affected, epileptogenesis is initiated by structural causes such as traumatic brain injury (TBI) or stroke (Hauser et al., 1993; Scheffer et al., 2017). Over 40 hypothesis-driven monotherapy approaches have demonstrated some disease-modifying effects in animal models of epileptogenesis (Pitkänen and Engel Jr., 2014; Pitkänen and Lukasiuk, 2011). Currently, however, no clinical treatments are available to stop or alleviate epileptogenesis in at-risk patients or to alleviate the course of epilepsy after its diagnosis. The development of treatments to combat epileptogenesis remains a major unmet medical need and a research priority both in Europe and the USA (Baulac and Pitkänen, 2009; Kelley et al., 2009).
One reason for the stalled progression of compounds showing proof-of-concept evidence in animal models to clinical antiepileptogenesis trials is the lack of diagnostic biomarkers for epileptogenesis that could be used to stratify patient populations for antiepileptogenesis trials and reduce study costs (Engel et al., 2013). Also, little effort has been aimed at identifying and using response biomarkers that could inform about target engagement in the early treatment development phase and provide an early go/no-go signal for further development.
Here we review the current status of biomarker discovery in epilepsy, using the BEST (Biomarkers, EndpointS, and other Tools) recommendations for categorizing the different types of epilepsy bio-markers (https://www.ncbi.nlm.nih.gov/books/NBK326791/). In addition, we outline the epilepsy-related challenges that need to be discussed and solved to further the progress in biomarker discovery for different epilepsy indications (Table 1).
Table 1.
Examples of biomarkers that are needed in different epilepsy indications.
| Diagnostic biomarkers |
| Epileptogenesis |
| Confirmation of epilepsy diagnosis after the 1st seizure |
| Status epilepticus (type, refractoriness, risk of mortality) |
| Epileptogenicity of the focal area |
| Prognostic biomarkers |
| Progression of epilepsy |
| Co-morbidogenesis |
| Response to epilepsy surgery |
| Cure |
| SUDEP |
| Predictive biomarkers |
| Drug-responsiveness |
| Drug-refractoriness |
| Response to monotherapy |
| Pharmacodynamic/response biomarkers |
| Target engagement in AEG and AED studies |
| Susceptibility/risk biomarkers |
| Risk of epilepsy after brain insult (e.g., genetic markers) |
| Monitoring biomarkers |
| Treatment effect |
| Safety biomarkers |
| Adverse events |
Abbreviations: AED, antiepileptic drug; AEG, antiepileptogenic drug; SUDEP, sudden unexpected death.
2. Epileptogenesis is a process and a rich source for biomarker discovery
Epileptogenesis refers to the development and extension of tissue capable of generating spontaneous seizures, resulting in (a) the development of an epileptic condition and/or (b) progression of the epilepsy after it is established (Pitkänen and Engel Jr., 2014). Like any progressive pathology (e.g., Alzheimer’s disease), the evolution of epileptogenesis is a “moving target” (Fig. 1A). Antiepileptogenesis is a process that counteracts the effects of epileptogenesis, including prevention, seizure modification, and cure (Pitkänen and Engel Jr., 2014) (Fig. 1B).
Fig. 1.
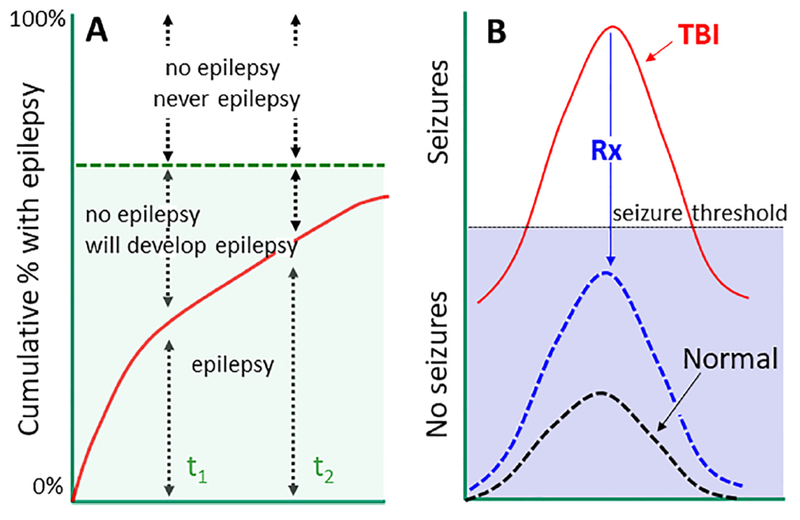
Epileptogenesis is an evolving target - implications for biomarker discovery. (A) In a follow-up cohort, the proportion of subjects with epilepsy will increase from time-point t1 to t2. Thus, selection of the analysis endpoint (based on previous follow-up studies in a given animal model or patient cohort) significantly affects the power calculations related to the number of subjects needed to conduct a sufficiently-powered epileptogenesis biomarker study. Also, the ability of the biomarker to detect epileptogenesis is affected by the time-point selected. (B) At the cellular level, neuronal excitability will increase during epileptogenesis, and will occasionally fluctuate over the seizure threshold. The diagnostic biomarker of epileptogenesis (i.e., prognostic biomarker for development of epilepsy after an epileptogenic brain insult) should be sensitive and specific to differentiate subjects with seizure susceptibility fluctuating over the threshold from those in whom it stays below the threshold. Predictive bio-markers of therapy response should be able to identify a subject in which the treatment (Rx) prevents an increase in seizure susceptibility over the threshold or repairs the tissue to bring the seizure susceptibility below the threshold.
At the molecular and cellular levels, epileptogenesis refers to a process in which an initial brain-dam aging insult triggers a cascade of molecular and cellular changes that eventually lead to the occurrence of unprovoked seizures (Fig. 2). Cellular alterations include neurodegeneration, neurogenesis, axonal sprouting, axonal and myelin injury, dendritic remodeling, various types of gliosis, inflammatory cell invasion, blood-brain-barrier damage, angiogenesis, alterations in extracellular matrix composition, possible aggregation of materials (e.g., iron and calcium), and acquired channelopathies (Pitkänen and Lukasiuk, 2011) (Fig. 3). These pathologies generate a “cellular and molecular ecosystem” in which increased excitability develops, eventually triggers seizures, and can be modulated by treatments. The epileptogenic tissue milieu expresses and secretes molecules that can be measured as biomarkers in different epilepsy indications, including therapy trials, using various approaches such as blood/cerebrospinal fluid (CSF) analysis, brain tissue analysis (e.g., cortical or hippocampal tissue), imaging, or electrophysiology. Importantly, at each stage, the epileptogenic process and biomarker discovery can be modulated by the genetic make-up, microbiota, and exposome (Fig. 2).
Fig. 2.
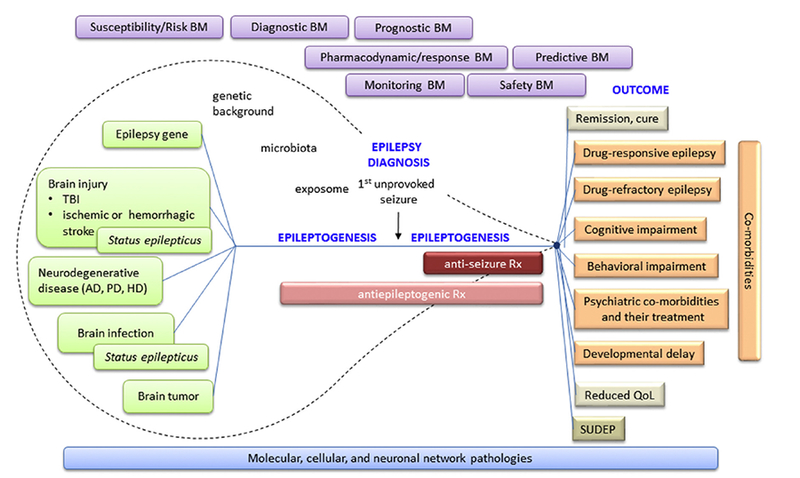
Epileptogenic process and need of biomarkers for different purposes in basic science, clinical practice, and medical product (including pharmacotherapy) development. Epileptogenesis is initiated by an “epilepsy gene” or various types of acute brain insults or chronic neurodegenerative diseases. Some of the conditions can present with status epilepticus. The entire epileptogenic process is modulated by an individual’s genetic background, microbiota, and exposome (non-genetic exposures of an individual in a lifetime, e.g., lifestyle, medications, etc.; Miller and Jones, 2014; Wild, 2012). Epileptogenesis continues after epilepsy diagnosis (i.e., occurrence of the first unprovoked seizure). Different phases of epileptogenic process can benefit from different biomarker types: susceptibility/risk biomarkers (BM), diagnostic biomarkers, prognostic biomarkers, pharmacodynamic/response biomarkers, predictive biomarkers, monitoring biomarkers, and safety biomarkers. As epilepsy can occur with a myriad of co-morbidities, epilepsy biomarkers can also apply to co-morbidities as well as to progression to remission/cure or occurrence of sudden unexpected death (SUDEP).
Fig. 3.
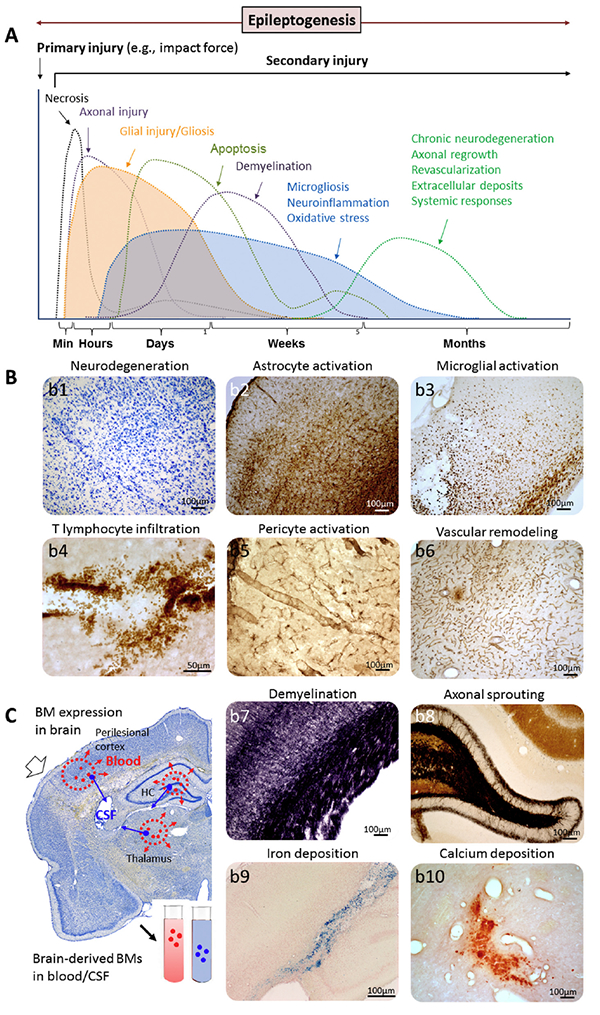
Tissue ecosystem during epileptogenesis as a biomarker source. (A) Secondary tissue damage and temporal regulation of underlying molecular networks will progress and vary with the development of epilepsy (epileptogenesis). (B) Mechanistic bio-markers (BM) representing the regulated gene networks and molecular pathways originate in different cellular sources, including (b1) apoptotic and necrotic cells, (b2) activated astrocytes, (b3) activate microglia, (b4) intraparenchymal T cells, (b5) activated pericytes, (b6) vascular remodeling, including vascular damage and blood-brain-barrier leakage, and consequent angiogenesis, (b7) myelin damage, (b8) axonal sprouting (e.g., mossy fiber sprouting in the dentate gyrus), (b9) iron deposits indicating hemorrhage, and (b10) calcifications (e.g., in the thalamus after lateral fluid-percussion injury). (C) A coronal Nissl sections showing a schematic of bio-marker expression at possible injury sites (perilesional cortex, thalamus, hippocampus [HC]) after lateral fluid-percussion injury in the rat brain. Various biomarkers are expressed (red and blue dots), some of which can be secreted into the blood (red dots) or cerebrospinal fluid (CSF; blue dots). The efficiency and region dependency of biomarker secretion is unknown. Also, the possible exposure of a given biomarker to degradation during the secretion phase is poorly understood. Some cellular changes can be imaged, for example, with magnetic resonance imaging or spectroscopy. Some of the changes can be measured with electrophysiology.
3. Biomarkers
3.1. Definitions
In 2015, the FDA-NIH Joint Leadership Council developed the BEST Resource [BEST (Biomarkers, EndpointS, and other Tools) Resource] to improve the accuracy in the understanding and use of biomarker terminology in biomedical research, clinical practice, and medical product development. A biomarker is a characteristic that is measured as an indicator of normal biologic processes, pathogenic processes, or responses to an exposure or intervention, including therapeutic interventions. Biomarkers may have molecular, histologic, radiographic, and physiologic characteristics. The BEST Glossary of biomarker categories includes: (a) susceptibility/risk biomarkers, (b) diagnostic biomarkers, (c) monitoring biomarkers, (d) prognostic biomarkers, (e) predictive biomarkers, (f) pharmacodynamic/response biomarkers, and (g) safety biomarkers. Biomarkers are developed through the process of analytical validation, clinical validation, and the demonstration of clinical utility (Frisoni et al., 2017).
3.2. Biomarker discovery process and statistics
A major objective of epilepsy biomarker discovery is to identify “hot lesions” in the epileptogenic brain tissue ecosystem that express a highly specific and sensitive biomarker signature for a given indication and can be detected using an optimized analysis platform, preferably in liquid biopsy. As an example, we outline the discovery process for a molecular diagnostic biomarker for epileptogenesis and the parallel development of an analysis platform (Fig. 4). The design of the discovery process depends on the biomarker type of interest (see below).
Fig. 4.
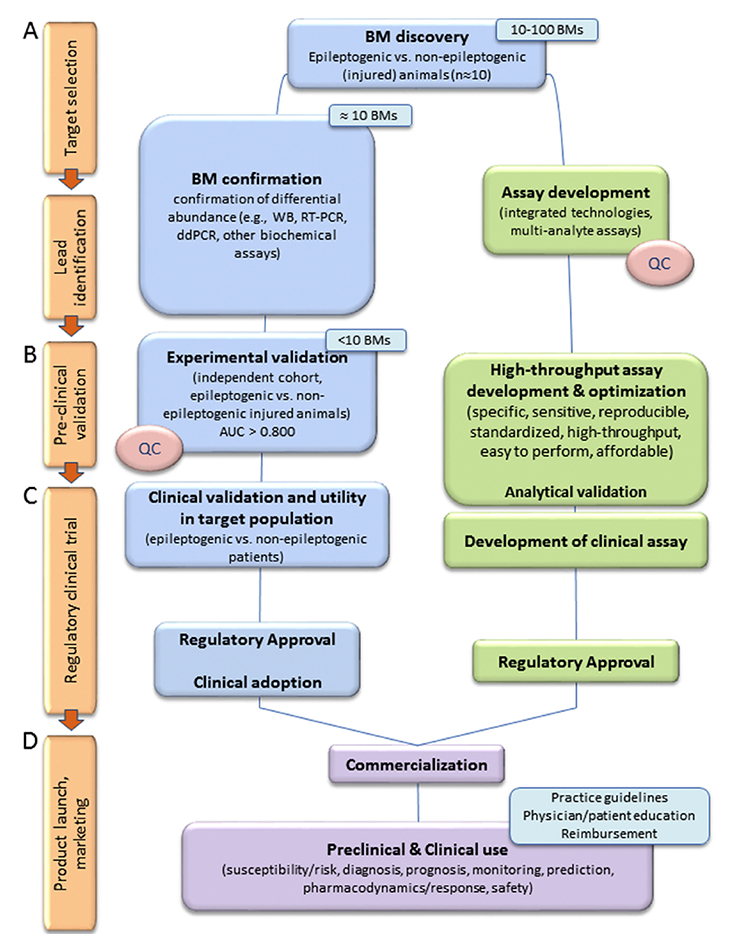
A schematics of the biomarker discovery process to identify diagnostic biomarkers for epileptogenesis. (A) Targetselection and lead identification. Biomarker discovery can be hypothesis or non-hypothesis driven (e.g., tissue molecular omics, imaging). A small number of epileptogenic and non-epileptogenic animals (~10) is analyzed to find differences in markers and generate a biomarker (BM) candidate list. In case of omics findings, confirmation of positive hits is established using lower-throughput independent analysis platforms. The top leads (typically < 10) will be taken for further analysis. (B) Statistically powered pre-clinical validation studies demonstrate that the candidate biomarker differentiates epileptogenic from non-epileptogenic animals with high sensitivity and specificity. The area under the curve (AUC) in receiver operating characteristics (ROC) analysis should be > 0.800. In parallel, assay platforms should be developed to achieve a highly sensitive and specific assay for high-throughput analysis. Its analytical performance, including accuracy, precision, linearity, limit of detection, and limit of quantification should be determined. Also, standardization and quality control (QC) in tissue sampling (e.g., plasma quality) should be performed both for preclinical and clinical samples. (C) Clinical validation in a target patient population should estimate the frequency of true positives and false positives (ROC analysis). It should analyze co-variates, including age, sex, ethnicity, injury, nutrition, sports and training, other medical conditions and their treatment. Studies can be retrospective on data available from repositories or prospective. After regulatory approval (D) product launch and marketing is accompanied by generation of best practice guidelines that define indications for the use of a given biomarker, and educational programs to train and educate clinicians and patients for their use, benefits, and limitations. It should be noted that the experimental design of the discovery process for identifying susceptibility/risk biomarkers, diagnostic biomarkers, prognostic biomarkers, monitoring biomarkers, predictive biomarkers, pharmacodynamic/response biomarkers, or safety biomarkers needs to be tailored accordingly.
Not every statistically significant difference in the mean value of a given parameter (e.g., microRNA [miRNA] level in plasma) between two groups justifies its use as a diagnostic biomarker for epileptogenesis. The usefulness of a diagnostic test is commonly evaluated using statistical measures such as the true positive rate (i.e., sensitivity), false positive rate (1-specificity), receiver operating characteristic (ROC) curve, and area under the ROC curve (AUC) (Ma et al., 2015; Yang et al., 2017). Sensitivity measures the proportion of correctly identified subjects having the specific condition or disease. Specificity measures the proportion of correctly identified subjects not having the disease. Sensitivity and specificity can be calculated from true positive (TP), true negative (TN), false positive (FP), and false negative (FN) values as follows: sensitivity = TP / (TP + FN) and specificity = TN / (TN + FP). True positives are subjects with a disease that the test correctly identifies as such. True negatives are healthy subjects that the test correctly identifies as healthy. False positives are incorrectly identified as diseased cases, and false negatives are incorrectly identified as healthy. The relationship of TP, FP, FN, and TN is shown in Table 2 and Figs. 5A-B. True and false positive rates are combined to calculate the ROC curve and the AUC (Fig. 5B). The AUC is used to demonstrate the performance of the ROC curve in discriminating between positive and negative cases. A biomarker is often considered acceptable if its AUC is > 0.800.
Table 2.
Confusion matrix of true positive (TP), false positive (FP), false negative (FN), and true negative (TN), representing events or their probabilities.
| A | Not A | |
|---|---|---|
| Test indicates “A” | TP | FP |
| Test indicates “Not A” | FN | TN |
Fig. 5.
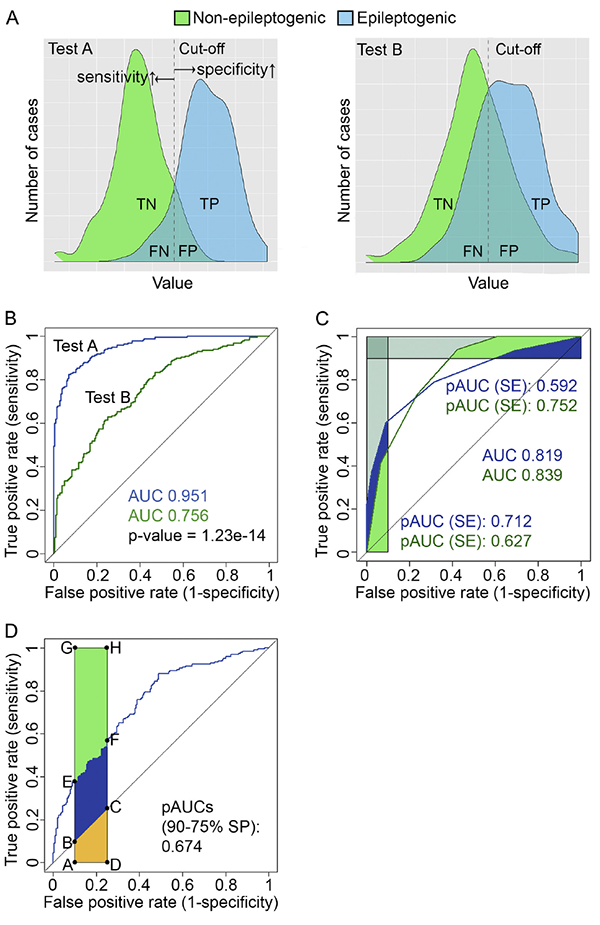
Statistical issues related to bio-marker analysis. (A) Density plots showing the proportions of TN (true negative), TP (true positive), FN (false negative), and FP (false positive) cases in two hypothetical diagnostic tests [test A and test B; simulated data, 200 cases per group] that were used to diagnose epileptogenesis after brain injury. The black dashed line indicates a cut-off test value (e.g., plasma miRNA concentration) that is used to calculate the receiver operating characteristics (ROC) curve (see below). Movement of the cut-off line to the left or right increases sensitivity or specificity, respectively. Sensitivity and specificity are calculated from the distribution of positive (epileptogenic) and negative (non- epileptogenic) cases: sensitivity = TP / (TP + FN), specificity = TN / (TN + FP). (B) Sensitivity and specificity of test A and test B are plotted across a series of cut-off test values as ROC curves, revealing the area under the curve (AUC) values for each test. In this example, the ROC curve of test A is better than that of test B in discriminating the non-epileptogenic from epileptogenic subjects (p < 1.23e-14, bootstrap test). (C) Comparison of the two ROC curves with similar AUC values. Partial AUC (pAUC) can be calculated for both the sensitivity and specificity. In our example, the pAUC is calculated and standardized for 90%−100% sensitivity and 90%−100% specificity. ROC curve A performs better that B when high biomarker specificity is needed. ROC curve B is superior to A when high sensitivity is needed. (D) Illustration of a standardized pAUC and the relevant areas: randomAUC = area(ABCD), pAUC = area (AEFD), perfectAUC = (AGHD). All data were generated and statistics performed with R version 3.4.2 and RStudio version 1.1.383 (https://www.R-project.org; https://www.rstudio.com/) using R packages pROC (Robin et al., 2011) and ggplot2 (Wickham, 2009).
A group difference and the AUC value, however, are not always sufficient to describe the usefulness of a given biomarker. Their biologic and clinical relevance should also be evaluated. One must ask which is better for the patient: over-diagnosis or under-diagnosis, over-treatment or under-treatment? One approach is to calculate the partial AUC (pAUC) instead of the AUC to justify biomarker performance, especially when two diagnostic tests have com parable AUCs (Fig. 5C) (Liu et al., 2018). The standardized pAUC is mathematically defined as:
in which the random AUC is the pAUC obtained by the random model, and the perfectAUC is the perfect area of the pAUC (Fig. 5D). The test values used to calculate the pAUC values can be tailored toward higher specificity or sensitivity depending on the need (Fig. 5C). Standardized pAUC values can be used and compared like normal AUC values (Walter, 2005). Furthermore, Support Vector Machine-based estimation algorithms have been developed to optimize pAUC performance (Narasimhan and Agarwal, 2017). Better tools are needed to estimate biologically relevant sensitivity and specificity cut-off values for calculating the pAUC.
In its most simple form, a biomarker is dichotomous, that is, it is expressed during a disease state like, for example, pathologic high-frequency oscillations (HFO) (Bragin et al., 2016). Most biomarkers, however, are continuous variables (e.g., plasma miRNA levels), and a cut-off value must be defined to determine whether or not a condition is present. Many recent studies have attempted to define “multivariate biomarker signatures”, e.g., a combinatory biomarker, reporting on molecular tissue microenvironment (Gallek et al., 2016), multistructure magnetic resonance imaging (MRI) abnormalities (Pitkänen and Immonen, 2014), combined imaging and behavioral abnormalities (Pascente et al., 2016), or combined behavioral abnormalities (Bröer and Löscher, 2015). Although combinatory biomarkers can be useful in some conditions (e.g., response biomarkers), standardization and setting the cut-off values for combinatory biomarker panels is a challenge, as is translation from the laboratory to the clinic. The time window for the use of a given biomarker should also be specified. As there are some similarities between the brain pathologies in different neurologic and psychiatric diseases, the discovery of a mechanistic biomarker specific for epilepsy will be challenging. Finally, as circulating biomarkers may not be specific for brain diseases, the contribution of systemic conditions to blood biomarker levels should also be assessed.
4. Current state of epilepsy biomarker discovery
As summarized in Table 3, approximately 30 publications over the past 4 years have reported biomarkers for different indications in the field of epilepsy. The study designs used indicate that most of the reported biomarkers are diagnostic biomarkers, and only a few belong to the category of predictive or response biomarkers. No candidates have so far been investigated in four of the seven biomarker categories. As indicated below, the borders between biomarker categories are not strict, and one biomarker can fall into several categories, depending on when and how often it is measured.
Table 3.
Epilepsy biomarkers. Studies area divided into molecular (blood, brain tissue), imaging, electrophysiologic, and behavioral or cognitive biomarkers. Biomarker indications are defined according to the BEST nomenclature (https://www.ncbi.nlm.nih.gov/books/NBK326791/).
| Indication | Comparisons (study populations) | Tissue | Modality and assay | Biomarker | AUC | Reference |
|---|---|---|---|---|---|---|
| Molecular biomarker - blood | ||||||
| Diagnostic biomarker for drug-resistant focal epilepsy | Adult patients with drug-resistant focal onset epilepsy vs. healthy controls | Plasma | Molecular analysis Human Pro Inflammatory 9 Plex assay and Human Chemokine 9 Plex Assay | Increased TARC/sICAM5 ratio | 1.0 | (Pollard et al., 2012) |
| Diagnostic biomarker for epilepsy | Patients with cryptogenic, symptomatic, or idiopathic epilepsy vs. healthy controls (gender-matched) | Serum | Molecular analysis Illumina HiSeq 2000, RT-qPCR |
Increased | (Wang et al., 2015b) | |
| miR-106b-5p | 0.882 | |||||
| let-7d-5p | 0.785 | |||||
| miR-130a-3p | 0.780 | |||||
| miR-146a-5p | 0.784 | |||||
| Decreased | ||||||
| miR-15a-5p | 0.836 | |||||
| miR-194-5p | 0.813 | |||||
| Diagnostic biomarker for drug-refractory epilepsy | Adult drug-resistant or drug-responsive patients with idiopathic or cryptogenic epilepsy, vs. healthy controls (gender-matched) | Serum | Molecular analysis Illumina HiSeq 2000, RT-qPCR |
DecreasedmiR-301a-3p | 0.893 | (Wang et al., 2015a) |
| Combination of miR-194p, miR-301a-3p, miR-30b-5p, miR-4446-3p | 0.902 | |||||
| Diagnostic biomarker for epilepsy | Patients with cryptogenic, symptomatic, or idiopathic epilepsy vs. healthy controls (gender-matched) | Serum | Molecular analysis RT-qPCR |
Increased | (An et al., 2016) | |
| miR-106b | 0.786 | |||||
| miR-146a | 0.774 | |||||
| miR-301a | 0.673 | |||||
| Decreased | ||||||
| miR-194-5p | 0.686 | |||||
| Combination of miR-106b and miR-146a | 0.887 | |||||
| Diagnostic biomarker for drug-refractory TLE with focal cortical dysplasia | Adult refractory TLE patients with focal cortical dysplasia vs. adult patients with hypertension and intracranial hematoma (controls) (sex-matched) | Cortical brain tissue Plasma |
Molecular analysis Affymetrix miRNA 4.0 microarray, RT-qPCR |
Increased | (Sun et al., 2016b) | |
| miR-129-2-3p | 0.929 | |||||
| Increased | ||||||
| miR-129-2-3p | 0.778 | |||||
| Diagnostic biomarker for focal cortical dysplasia with refractory TLE | Adult refractory TLE patients with focal cortical dysplasia and HS vs. adult patients with hypertension and intracranial hematoma (controls) (sex-matched) | Cortical brain tissue Serum |
Molecular analysis Affymetrix 4.0, RT-qPCR |
Increased | (Wang et al., 2015) | |
| miR-4521 | 0.813 | |||||
| (no sex difference) | 0.718 | |||||
| Diagnostic biomarker for epilepsy | Patients with idiopathic, symptomatic, and cryptogenic epilepsy vs. controls | Serum | Molecular analysis Luminex |
Decreased MMP-3 | > 0.732* | (Wang et al., 2016a) |
| *Age-and sex dependent | ||||||
| Diagnostic biomarker for epilepsy | Patients with idiopathic, symptomatic, and cryptogenic epilepsy vs. controls | Serum | Molecular analysis Luminex |
Decreased MMP-2 | 0.697* | (Wang et al., 2016b) |
| *Age-dependent | ||||||
| Diagnostic biomarker for mTLE-HS epilepsy | Drug-resistant patients operated due to drug-refractory mTLE epilepsy with HS vs. healthy controls (sex-matched) | Plasma exosomes | Molecular analysis Exo quick precipitation followed by Affymetrix Gene Chip miRNA 4.0 Array |
Decreased | (Yan et al., 2017) | |
| miR-3613-5P | 0.044 | |||||
| miR-4668-5P | 0.789 | |||||
| miR-8071 | 0.932 | |||||
| miR-197-5P | 0.802 | |||||
| Diagnostic biomarker for TLE | Patients with TLE vs. controls | CSF | Molecular analysis | Reduced miR-19b-3p | 0.730 | (Raoof et al., 2017) |
| Diagnostic biomarker for SE | Patients with SE vs. controls | CSF | RT-qPCR | Elevated miR-451a | 0.800 | |
| Digital PCR | Elevated miR-21-5p | 0.830 | ||||
| Diagnostic biomarker for mTLE | Patients with medial TLE vs. controls (*validation cohort) | Plasma | Molecular analysis RT-qPCR |
Decreasedhsa-miR-134 | 0.750 | (Avansini et al., 2017) |
| 0.671* | ||||||
| Diagnostic biomarker for drug-refractoriness | Drug-responsive vs. drug-resistant patients with TLE, extratemporal lobe epilepsy, juvenile myoclonus epilepsy, or idiopathic generalized epilepsy | Serum | Molecular analysis Electrospray ionization LC/MS |
Increased acetylated HMGB1 | 0.990 | (Walker et al., 2017) |
| Diagnostic biomarker for drug-resistant epilepsy | Drug-resistant patients with TLE, extratemporal lobe epilepsy, or idiopathic generalized epilepsy vs. controls | Serum | Molecular analysis Electrospray ionization LC/MS |
Increased acetylated HMGB1 | 0.990 | |
| Diagnostic biomarker for epileptogenesis or Prognostic biomarker for development epilepsy in rats who have experienced electrically-induced SE Response biomarker for treatment effect |
Rats which develop epilepsy vs. rats which do not develop epilepsy after electrical stimulation-induced SE Post-SE rats treated with vehicle vs. anakinra+BoxA+ifenprodil polytherapy | Plasma Plasma |
Molecular analysis ELISA Electrospray ionization LC/MS Molecular analysis ELISA Electrospray ionization LC/MS |
Increased total HMGB1 | 1.000* | |
| Increased acetylated HMGB1 | 1.000* | |||||
| Increased reduced HMGB1 | 1.000* | |||||
| Increased disulfide HMGB1 | 1.000* | |||||
| *Both before, at, and after epilepsy onset | ||||||
| Prevention in the increase in total HMGB1 | ≥0.900* | |||||
| Prevention in the increase in acetylated HMGB1 | ≥0.900* | |||||
| Prevention in the increase in reduced HMGB1 | ≥0.900* | |||||
| Prevention in the increase in disulfide HMGB1 | 1.000# | |||||
| *Both before and at epilepsy onset; #at epilepsy onset | ||||||
| Molecular biomarker - brain tissue | ||||||
| Predictive biomarker signature for seizure-free outcome after epilepsy surgery | Patients undergoing temporal lobectomy with amygdalohippocampectomy due to intractable TLE with seizure-free vs. non-seizure-free outcome | Lateral temporal cortex | Molecular analysis Affymetrix GeneChip Human Gene 1.0 ST Array |
Relative down-regulation of | (Gallek etal., 2016) | |
| ZNF852 | 0.958* | |||||
| CDCP2 | 0.941* | |||||
| PRRT1 | 0.942* | |||||
| FLJ41170 and 7 RNA probes in sz-free subjects | 0.908* | |||||
| *Logistic regression | ||||||
| Diagnostic biomarker for temporal lobe epileptogenicity | Patients with high (median > 4 sz/month) vs. low (< 4) seizure frequency undergoing temporal lobectomy with amygdalohippocampectomy due to intractable TLE | Lateral temporal cortex | Molecular analysis Affymetrix GeneChip Human Gene 1.0 ST Array |
Relative down-regulation of 35 genes and up-regulation of 5 genes in ≥ 4 sz/month group | ≥0.904* | (McCallum et al., 2016) |
| *Logistic regression | ||||||
| Brain imaging | ||||||
| Diagnostic biomarker for epileptogenesis or Prognostic biomarker for development epilepsy in rats with hyperthermia-induced SE at P11 | Rats with or without epilepsy after hyperthermia-induced SE at P11 | Brain tissue - amygdala, thalamus | Imaging T2 MRI |
T2 relaxation time ⇩ in basolateral amygdala | 0.910 | (Choy et al., 2014) |
| T2 relaxation time ⇩ in medial amygdala | 0.820 | |||||
| T2 relaxation time ⇩ in medial thalamus | 0.780 | |||||
| Diagnostic biomarker for increased seizure susceptibility after TBI | Rats with or without increased seizure susceptibility in the PTZ test after TBI | Brain tissue - cortex, hippocampus, thalamus | Imaging MRI |
T1σ in S1 cortex | 0.881 | (Pitkanen and Immonen, 2014) |
| T1σ in Prh cortex | 0.929 | |||||
| T2 in thalamus | 0.893 | |||||
| T1σ in S1 HC | 0.857 | |||||
| Diagnostic biomarker for drug-refractory mTLE | Patients with benign vs. refractory mTLE (age and sex-matched) | Brain tissue - temporal lobe grey and white matter | Imaging DTI-MRI |
⇧ ipsilateral MD | 0.670 | (Labate et al., 2015) |
| ⇩ ipsilateral FA | 0.770 | |||||
| ⇩ ipsilateral HC vol | 0.670 | |||||
| ipsilateral HS | 0.660 | |||||
| FA + HS | 0.768 | |||||
| Diagnostic biomarker for mTLE | Right and left mTLE patients vs. healthy controls (sex-matched) | Brain tissue - anterior corpus callosum | Imaging DTI/DWI-MRI |
Reduced local diffusion homogeneity in anterior corpus callosum | RmTLE 0.935 | (Liu et al., 2016) |
| LmTLE 0.919 | ||||||
| Diagnostic biomarker for epileptogenesis or Prognostic biomarker for development epilepsy in rats with pilocarpine-induced SE |
P21 rats which develop epilepsy vs. P21 rats which do not develop epilepsy after systemic pilocarpine-induced SE | Septal pole of the hippocampus | Imaging MRS |
Increased hippocampal mIns/tCr on day 72 post-SE | 0.830 | (Pascente etal., 2016) |
| Diagnostic biomarker for PTE in patients with TBI | Patients with vs. without epilepsy after TBI | Cerebral cortex | Imaging Gadolinium-MRI |
Area of gadolinium leakage around cortical lesion after TBI | 0.850 | Data by A Friedman in Pitkanen et al. (Pitkanen et al., 2016) |
| Diagnostic biomarker for epileptogenesis or Prognostic biomarker for development epilepsy in rats with paraoxan-induced SE |
Rats with or without epilepsy after paraoxan-induced status epilepticus | Blood-brain-barrier pathology in the piriform network | Imaging | Increased T2-weighted signal | 0.720 | (Bar-Klein et al., 2017) |
| Brain electrophysiology | ||||||
| Diagnostic biomarker for localization of seizure onset zone (tissue epileptogenicity) | Seizure onset zone vs. other brain areas in humans evaluated for epilepsy surgery | Brain | Electrophysiology iHC or iECEEG scalp EEG | Occurrence of HFOs Stereotypical HFOs with waveform similarity Spikes × HFO |
No data | (Andrade-Valenca et al.,
2011; Bragin et al., 1999) (Liu et al., 2018) (Roehri et al., 2017) |
| Diagnostic biomarker for PTE in rats after lateral FPI-induced TBI | Rats with epilepsy vs. no epilepsy after lateral fluid-percussion induced TBI | Brain | Electrophysiology Sleep EEG |
Shortening of the duration of sleep spindles occurring at transition from N3 to REM | 0.907 | (Andrade et al., 2017) |
| Diagnostic biomarker for epileptogenesis or Prognostic biomarker for development epilepsy in adult rats with lateral fluid-percussion induced TBI |
Rats with epilepsy vs. without epilepsy after lateral fluid-percussion induced TBI | Electrophysiology intracortical EEG |
Occurrence of perilesional pHFOs and rHFOSs during the first 2 post-TBI weeks only in rats that will develop PTE | No data | (Bragin et al., 2016) | |
| Diagnostic biomarker for idiopathic generalized epilepsy | Patients with idiopathic generalized epilepsy vs. controls | Brain | Electrophysiology Interictal VEP - visual hyperexcitability assessed using contrast response function | Relative lack of gain control at high contrasts | 0.870 | (Won et al., 2017) |
| Diagnostic biomarker for epileptogenesis or Prognostic biomarker for development epilepsy in rodents with brain injury |
Mice with or without epilepsy after i.c.v. injection of albumin, TGF-β, or
IL-6 Rats with or without epilepsy after photothrombotic stroke Rats with or without epilepsy after bilateral hippocampal electrical stimulation-induced SE |
Brain | Electrophysiology Theta dynamics in EEG on days 2–4 |
Absolute slope value of dynamic change in theta band | 0.910 | (Milikovsky et al., 2017) |
| Distance from the mean control group | 0.997 | |||||
| Behavioral or cognitive tests | ||||||
| Diagnostic biomarker for epileptogenesis or Prognostic biomarker for development epilepsy in adult rats with Li-pilocarpine-induced SE |
Female adult rats with or without epilepsy after i.p. Li-pilocarpine-induced SE | 3 wk. follow-up, including increased excitability in PTZ test, post-PTZ behavior, and pick-up test | PTZ threshold at 3 wk. | 0.732 | (Bröer and Loscher, 2015) | |
| Combinatory phenotypic biomarker> | 0.959 | |||||
| Diagnostic biomarker for epileptogenesis or Prognostic biomarker for development epilepsy in adult rats with pilocarpine-induced SE |
P21 rats which develop epilepsy vs. P21 rats which do not develop epilepsy after systemic pilocarpine-induced SE | Behavior Morris Water-maze |
Slower rate of learning on day 15 post-SE | 0.790 | (Pascente et al., 2016) | |
| Accelerated forgetting on day 65 post-TBI | 0.840 | |||||
4.1. Diagnostic biomarkers
Diagnostic biomarkers are “used to detect or confirm presence of a disease or condition of interest or to identify individuals with a subtype of the disease”. Diagnostic biomarkers are used to determine whether a patient has a particular condition for which treatment may be indicated.
4.1.1. Gold standard of epilepsy diagnosis – seizures
Epilepsy is a disease with various subtypes that show variable prognoses and responses to specific treatments (Fisher et al., 2014; Scheffer et al., 2017). Occurrence of a clinical or electrographic seizure is the gold-standard diagnostic biomarker for epilepsy, and is used as a reference diagnostic to categorize subjects into epilepsy vs. no-epilepsy groups in published biomarker studies (Table 3). However, there are many situations where an epileptic seizure occurs as a natural reactive, acute symptomatic, or provoked event in response to a transient insult that does not warrant a diagnosis of epilepsy. Many people who experience a provoked or reactive epileptic seizure will not go on to have epilepsy. According to WHO, up to 10% of people worldwide have one seizure during their lifetime (http://www.who.int/mediacentre/factsheets/fs999/en). Thus, if we have 100 people, from which 10 have a seizure, there is 1 true positive epilepsy case (prevalence of epilepsy is about 1%) and 9 false positives. If we assume that there is no epilepsy diagnosis without a seizure (all 90 negatives are true negatives), sensitivity of a seizure as a diagnostic biomarker is 100% but its specificity is 91%. So, there is some room for improvement with novel diagnostic biomarkers, which in some epilepsy syndromes may be more needed than in others.
An epileptic seizure also has a biomarker value beyond that of a diagnostic biomarker. The type of the clinical or electrographic seizure can identify a particular population of epilepsy patients who respond to a given antiepileptic drug (AED) treatment, that is, seizure type serves as a predictive biomarker for therapy response. Various genetic markers (e.g., encephalopathy genes) associated with a particular seizure type can predict the course of the disease, that is, they are prognostic biomarkers. Thus, a diagnostic biomarker (in this case clinical or electrographic seizure) can identify a disease, but also be used for diagnostic classification, consequently serving as both a prognostic and a predictive biomarker.
4.1.2. Diagnostic biomarkers for epilepsy
The design of most of the molecular, electrophysiologic, or MRI bio-marker studies performed in epilepsy populations indicates that the objective has been to discover sensitive and specific biomarkers differentiating the epilepsy population from controls (Table 3). These studies report plasma/serum/CSF miRNA and protein biomarkers, plasma exosome miRNA biomarkers, cortical brain tissue miRNA biomarkers, brain diffusion tensor imaging/diffusion-weighted imaging-MRI biomarkers, and electrophysiologic biomarkers that differentiate patients with epilepsy (Wang et al., 2015b; Wang et al., 2016a, 2016b), temporal lobe epilepsy (TLE) (Raoof et al., 2017), medial TLE (mTLE) (Avansini et al., 2017; Liu et al., 2016), mTLE with hippocampal sclerosis (Yan et al., 2017), idiopathic generalized epilepsy (Won et al., 2017), drug-refractory epilepsy (An et al., 2016; Wang et al., 2015a), drug-resistant focal epilepsy (Pollard et al., 2012), drug-refractory TLE (Walker et al., 2017), or focal cortical dysplasia with refractory TLE (Sun et al., 2016b; Wang et al., 2015) from controls (Table 3). Many of these diagnostic epilepsy biomarkers have an AUC > 0.800, suggesting acceptable sensitivity and specificity to make an epilepsy diagnosis without evidence of the occurrence of a seizure. It is important to note that most of these studies were performed using a small discovery study cohort without a validation cohort. A large majority of the studies report no cut-off values that would differentiate epilepsy vs. control groups. Also, the specificity of markers for epilepsy compared with other brain diseases, particularly those important for a differential diagnosis of epilepsy, has not been analyzed. Recently, Raoof et al. (Raoof et al., 2017) designed a study in which CSF miRNA levels in mTLE patients were compared with CSF miRNA levels in a group of patients with other neurologic diseases (i.e., Alzheimer’s disease, multiple sclerosis, metastatic brain tumor, undefined gait disorder, sinus vein thrombosis, choroidal melanoma, motor neuron disease, and right hypoglossal paresis). They reported AUCs of 0.760 for miR-19–3p, 0.720 for miR-21–5p, and 0.740 for miR-451a, indicating some differential diagnostic value between the two cohorts. Applying these findings to clinical practice, however, is difficult due to the heterogeneity of the reference populations that must be set and standardized at each study site.
Some investigators have used a study design in which the injured study population with epilepsy was compared to injured subjects without epilepsy. Tomkins et al. (Tomkins et al., 2008) (see in Fig. 3 in Pitkänen et al., 2016) showed that blood-brain-barrier gadolinium leakage around cortical lesions differentiated patients with or without epilepsy after TBI. Andrade et al. (2017) reported that a shortened duration and slowing of the dominant frequency of sleep spindles at the transition from the N3 sleep state to rapid-eye-movement sleep diagnosed rats with epilepsy after lateral fluid-percussion injury (FPI)-induced TBI. Whether the gadolinium leakage and shortened sleep spindles would also serve as diagnostic biomarkers for post-traumatic epileptogenesis remains to be explored.
4.1.3. Diagnostic biomarkers for epileptogenesis and epileptogenicity
Epileptogenesis is a continuum that begins before the first seizure and continues after epilepsy diagnosis. Consequently, epileptogenicity of the brain tissue can vary from subthreshold levels to frequently seizing (Fig. 1B). Identification of subjects undergoing epileptogenesis and delineation of the epileptogenic brain tissue are the major diagnostic challenges in preclinical and clinical research.
Several preclinical studies have made elegant attempts to identify noninvasive diagnostic biomarkers for epileptogenesis. These studies are laborious as they require long-term video-electroencephalography (EEG) monitoring to demonstrate whether or not the animal eventually developed epilepsy after the brain insult. The only serum biomarkers for epileptogenesis reported so far are increased total, acetylated, reduced, or disulfide high mobility group box 1 (HMGB1), which can differentiate epileptogenic from non-epileptogenic rats after status epilepticus (SE) (Walker et al., 2017). Several studies have reported noninvasive imaging biomarkers to diagnose epileptogenesis. Choy and colleagues (Choy et al., 2014) reported that a reduced T2 relaxation time in the basolateral amygdala, medial amygdala, and medial thalamus differentiates rats that develop epilepsy from those that will not after hyperthermia-induced SE at postnatal day 11. Pitkänen and Immonen (Pitkänen and Immonen, 2014) reported that post-injury T2 and T1o measured using T2-weighted MRI in the thalamus and hippo-campus differentiate rats with lateral FPI-induced TBI that will or will not develop increased seizure susceptibility in the pentylenetetrazol (PTZ)-test at 12 months post-TBI. Pascente et al. (Pascente et al., 2016) found that an increased hippocampal myoinositol/total creatine (mIns/tCr) ratio was a diagnostic biomarker for epileptogenesis after Li-pilocarpine-induced SE at postnatal day 21. Moreover, a slowed rate of learning and accelerated forgetting behavioral phenotype showed sensitivity and specificity as a diagnostic biomarker for epileptogenesis in the Li-pilocarpine-induced SE model (Bröer and Löscher, 2015; Pascente et al., 2016).
More invasive approaches use intracerebral recordings or stimulation paradigms. Recently, Milikovsky et al. (Milikovsky et al., 2017) reported that theta dynamics in EEG assessed with intracerebral electrodes for days 2 to 4 after various types of brain injury diagnosed epileptogenesis. Bragin et al. (Bragin et al., 2016) reported that the occurrence of HFOs was a diagnostic biomarker for localizing the seizure onset zone after lateral FPI-induced TBI in rats. Previous studies also proposed the use of HFOs for delineation of the epileptogenic region in the human brain (Andrade-Valenca et al., 2011; Bragin et al., 1999). Recent studies suggest that the stereotypical waveform similarity (Liu et al., 2018) or combination of spikes and HFOs (Roehri et al., 2017) in particular represent sensitive and specific biomarkers for delineating the epileptogenic area in the brain. McCallum et al. (McCallum et al., 2016) identified 40 regulated genes that indicate epileptogenicity of the lateral temporal cortex in patients operated on due to drug-refractory TLE.
4.1.4. Diagnostic biomarkers for SE
Raoof and colleagues (Raoof et al., 2017) reported that elevated levels of miR-451a or miR-21p, or decreased levels of miR-19b in the CSF differentiate patients with SE from controls. The SE cohort included patients with focal SE, nonconvulsive SE, and generalized tonic-clonic SE. This is an interesting area for biomarker discovery as under certain circumstances, like after TBI or stroke, the diagnosis of non-convulsive SE can be particularly challenging.
4.1.5. Diagnostic biomarkers for drug-refractoriness
Walker et al. (Walker et al., 2017) reported that increased serum acetylated HM GB1 differentiates drug-responsive from drug-resistant patients with various types of epilepsy. Labate et al. (Labate et al., 2015) differentiated patients with benign mTLE from those with refractory mTLE by assessing temporal lobe white matter fractional anisotropy and mean diffusivity.
4.2. Prognostic biomarkers
Prognostic biomarkers are used to “identify likelihood of a clinical event, disease recurrence or progression in patients who have the disease or medical condition of interest”. For example, the diagnostic biomarkers for epileptogenesis listed in Table 3 can be considered prognostic biomarkers for epilepsy development after a given brain injury type. Another example would be prognostic biomarkers that identify the development of cognitive impairment after an epilepsy diagnosis. Prognostic biomarkers differ from susceptibility or risk biomarkers, as prognostic biomarkers are applied to populations that already have a disease with or without medication. Importantly, the type of medication (e.g., AEDs) may influence the sensitivity and specificity of prognostic biomarkers to differentiate outcomes.
4.3. Pharmacodynamic/response biomarkers
A pharmacodynamic/response biomarker is “a biomarker used to show that a biological response has occurred in an individual who has been exposed to a medical product or an environmental agent”. A change in the pharmacodynamic/response biomarker level (e.g., small plasma molecules) in response to exposure to treatment can indicate target engagement, provide early proof-of-concept evidence that a treatment is biologically active and/or having an effect on a clinical endpoint, advise on dose-ranging of a novel treatment and duration of treatment, or report on possible safety concerns. Because of the serial nature of their assessment, pharmacodynamic/response biomarkers often fall under the category of monitoring biomarkers.
To date, only one of the published biomarker studies on epilepsy can be considered to have assessed pharmacodynamic/response biomarkers. Walker et al. (Walker et al., 2017) reported that anakinra/BoxA/ifenprodil treatment prevents the increase in plasma HMGB1 levels in rats with SE. Only a single analysis point during treatment was assessed, however, and no analysis was performed to assess the treatment effect or dose effect.
4.4. Predictive biomarkers
A predictive biomarker is “a biomarker used to identify individuals who are more likely than similar individuals without the biomarker to experience a favorable or unfavorable effect from exposure to a medical product or an environmental agent”. The response can be a symptomatic benefit, improved survival, or an adverse effect. Also, predictive biomarkers (range of values or dichotomous) could be used to stratify patients into biomarker-positive and biomarker-negative groups in treatment trials, with the primary endpoint being the effect in the biomarker-positive group, which may present a small population of the overall affected individuals. Studies of predictive biomarker-positive subjects are important for demonstrating the feasibility of investigational treatments to progress, for example, antiepileptogenesis treatments. It is important to note that predictive biomarkers for effects of interventions may be characteristics of an individual’s biologic constitution (“host characteristics”) or characteristics of the disease process. For example, the type of epileptogenic lesion or the genetic makeup of a given individual may affect the treatment response, emphasizing the personalized medicine aspect in the discovery of predictive bio-markers.
One of the studies listed in Table 3 can be considered to fall into the predictive biomarker category. Gallek et al. (Gallek et al., 2016) found that a relative downregulation of a set of genes in the lateral temporal cortex serves as a predictive biomarker for seizure-freedom after epilepsy surgery (Table 3).
4.5. Susceptibility/risk biomarkers
A susceptibility/risk biomarker is “a biomarker that indicates the (increased or decreased) potential for developing a disease or medical condition in an individual who does not currently have clinically apparent disease or medical condition”.
For example, mice with a CD1 background or carrying an APP/PS1 mutation are at increased risk of epilepsy after TBI (Guo et al., 2013; Hunt et al., 2009; Miszczuk et al., 2016). Susceptibility/risk biomarkers guide preventive strategies. They also identify individuals in need of intensive surveillance for the presence of the disease.
4.6. Monitoring biomarkers
A monitoring biomarker is “a biomarker measured serially for assessing status of a disease or medical condition or for evidence of exposure (or effect) of a medical product or an environmental agent”. The serial nature of the measurements emphasizes the change in a bio-marker’s value as an indicator of an individual’s current or future condition. The monitoring biomarker category therefore includes other biomarkers defined in the glossary when they are measured serially. Changes in the monitoring biomarker value could, for example, indicate the evolution of epileptogenesis in a subgroup of brain injured patients, progression of epilepsy after its diagnosis, compliance with treatment, treatment efficacy, or toxicity. Subsequent analyses of the occurrence of epileptic spikes/HFOs in a given cortical area after TBI could reveal biomarkers for monitoring the evolution of epileptogenicity. As summarized in Table 3, serial measurements of candidate biomarkers over the disease course have not been obtained in any of the epilepsy biomarker studies performed to date.
4.7. Safety biomarkers
A safety biomarker is “a biomarker measured before or after an exposure to a medical product or an environmental agent to indicate likelihood, presence, or extent of toxicity as an adverse effect”. One task for a safety biomarker is to identify patients for whom particular therapies should not be initiated because of significant safety risk. Liver enzymes are an example of a safety marker to monitor during AED treatment.
5. Challenges in epilepsy biomarker discovery
The number of epilepsy biomarker studies has increased rapidly over the past 4 years. There is still room for optimizing the biomarker discovery process at all levels, however, including reporting information related to study subjects as well as biomarker analysis.
5.1. Subject-related information
In the clinical studies listed in Table 3, the classification of epilepsy varies, making it difficult to compare the data. Most of the clinical studies lack information on the etiology of the epilepsy in the study population. Consequently, neither the etiology-dependency of bio-markers nor their specificity to epilepsy has been assessed in comparison with other brain diseases. Comparisons are mostly made with controls and not a patient population with a comparable injury that did not lead to epilepsy. The study populations are small, and do not address the sex and age dependence of the identified biomarkers. Replication studies are lacking. Timing of sampling relative to the occurrence of the epileptogenic injury has also not been specified. Medication at the time of injury and tissue sampling is often not known or not reported. In preclinical epileptogenesis studies, the intensity and duration of EEG monitoring may not be extensive enough to exclude false negative findings.
Biomarker studies in epilepsy face some specific disease-related challenges. One is the occurrence of seizures near or at the time of sampling. Surges et al. (Surges et al., 2016) reported that a single generalized seizure in video-EEG monitored mTLE patients with hippocampal sclerosis is associated with the regulation of over 200 miRNAs in the serum when assessed within 30 min post-seizure. Moreover, 10 miRNAs remained regulated for up to 20–28 h in a subgroup of patients that experienced a seizure during sleep. miRNA regulation was also reported by Sun et al. (Sun et al., 2016a), who found a correlation between seizure frequency and miR-30a regulation. Although seizure frequency did not affect the plasma miRNA levels in a study with drug-refractory patients (Avansini et al., 2017), the timing of seizure occurrence relative to tissue sampling can be a confounding factor in the analysis and should be monitored and reported in epilepsy biomarker studies. Some of the associations could be biomarker-specific. Recent experimental studies showing reduced secretion of brain-derived biomarkers to blood via the glymphatic system after sleep deprivation or cisternotomy adds another caveat for collecting and interpreting epilepsy biomarker data (Plog et al., 2015).
Another epilepsy-related concern in biomarker analysis relates to the use of AEDs. In addition to identifying pharmacodynamic/response plasma and brain biomarkers that would indicate the target engagement, blood biomarker analyses can be compromised by AEDs. For example, valproic acid (Wang et al., 2017), brivaracetam, lacosamide (Rizzo et al., 2017), and phenobarbital (Koufaris et al., 2013) regulate miRNA expression. On the other hand, non-AED treatments, such as aspirin, can also affect the analyses (de Boer et al., 2013). Finally, systemic treatments can modulate molecular and cellular processes in peripheral tissues, and therefore, the contribution of peripheral tissues to circulating biomarker levels is a particular concern.
5.2. Biomarker analysis-related information
We will focus on miRNA biomarker analyses as they comprise most of the epilepsy biomarker studies published so far, and other chapters in this volume will focus on other modalities. Many of the factors described below can also be extrapolated to the protein analyses.
5.2.1. Pre-analytical variables
So far, no studies have investigated the effect of lesion location in the brain on biomarker levels in the blood or CSF. For example, would the cortical location of an epileptogenic lesion signal to the periphery more robustly than, for example, a thalamic lesion (Fig. 3) Does the proximity of blood-brain-barrier leakage actually affect blood biomarker levels? Does the proximity of the dam aged area to the ventricles affect CSF biomarker levels? What is the systemic contribution to circulating biomarker levels in each condition? What is the optimal time window for expression, and the consequent use for each biomarker during the epileptogenic process? One study compared plasma and CSF miRNA diagnostic biomarkers for TLE and found no correlation, suggesting that the two biomarker pools provide different information on the disease (Raoof et al., 2017).
Emerging evidence indicates that in addition to age and sex, lifestyle factors like smoking or alcohol use, fasting, and miRNAs originating from the diet can cause variability in miRNA biomarker analysis (Duttagupta et al., 2011; Liang et al., 2015; MacLellan et al., 2014). Sample processing is an issue as plasma and serum miRNA levels do not always correlate with each other (Fortunato et al., 2014). Further, plasma or serum sample processing and storage can have a major effect on miRNA levels (Fortunato et al., 2014; van Vliet et al., 2017). First, the method used for plasma or serum collection, selection of collection tubes, additives in the tube, centrifugation, clotting time, and time from sampling to processing can affect the data obtained. Sample storage and stability of a given miRNA in storage can cause variance, even though miRNAs have been thought to be stable when stored at −80 °C (Grasedieck et al., 2012). There is conflicting data on the effect of freeze/thaw-cycles or storage time on miRNA levels, which probably depends on the miRNA sequence (Ge et al., 2014; Mitchell et al., 2008).Importantly, blood cell counts influence the miRNA profile depending on the miRNA type, as some miRNA are secreted by white or red blood cells or platelets (Pritchard et al., 2012b). Sample hemolysis can falsely increase levels of miRNAs present in red blood cells (van Vliet et al., 2017; Yamada et al., 2014). Platelet contamination in samples can especially affect serum miRNA levels. Our observations in rat plasma samples show that measurement of hemolysis informs of the overall sample quality and provides clues about possible platelet contamination. One commonly overlooked factor in circulating biomarker studies is optimization of the sample volume, which may not take into account the effect of the presence of endogenous enzyme inhibitors in the plasma or serum on miRNA levels (Ramón-Núñez et al., 2017). The RNA extraction kit used can further increase the variability of the miRNA profile (Li et al., 2015). Selection of the optimal platform for analyzing circulating miRNAs depends on the research question (Pritchard et al., 2012a).
5.2.2. Post-analytical variables
Post-analytical challenges of circulating miRNA experiments usually come from normalization of the expression data, low power in the analysis, and the replicability of the studies. Determining suitable endogenous controls for quantifying circulating miRNAs is very challenging. Two of the most frequently used endogenous controls are U6 and miR-16. U6, however, is not stable enough, and miR-16, although it is more stable, is easily contaminated by hemolysis (Xiang et al., 2014). Strategies to identify stable endogenous miRNAs for serum or plasma samples should include the selection phase, validation phase, and characterization phase (Chen et al., 2013). Most studies, however, fail to provide evidence for the endogenous control selected and its identification procedure. Under extreme conditions, synthetic spike-in miRNAs may not be stable (Chen et al., 2013). Jarry et al. (Jarry et al., 2014) presented a striking conclusion that up to 40% of studies in oncology could be biased by inappropriate normalization. It is important to realize that differences in data normalization can lead to a highly variable outcome, and can change upregulation to down-regulation of the miRNA of interest.
To conclude, the literature to date includes a high frequency of contradictory data regarding plasma and serum miRNA profiles and their usability as disease biomarkers. Without considering all the pre-analytical and post-analytical factors, it will be impossible to replicate any of the data produced. An ideal diagnostic biomarker should not be too sensitive to analytical factors, and should have a large enough fold-change between the groups to be differentiated, leading to high sensitivity and specificity. Nevertheless, harmonization of sample processing and storage between studies is of utmost importance, because they partly relate to the miRNA biology itself. Finally, according to our bioinformatics analysis (Fig. 6), in addition to comparing dysregulated miRNA lists, it could also be beneficial to compare miRNA targets and the molecular pathways to which they belong to detect “miRNA clusters” in which each miRNA may signal the same pathologic condition (e.g., inflammation, dysregulated transcription or protein synthesis, or neurodegeneration).
Fig. 6.

Current status of circulating epilepsy biomarker discovery - what do the biomarkers monitor? (A) Bioinformatics analysis of targets for diagnostic microRNA (miRNA) biomarkers in the circulation and cerebrospinal fluid (CSF) listed in Table 3. For analysis, we collected all predicted targets for each miRNA from TargetScanHuman (Release 7.1: June 2016). Then, we generated gene lists and submitted the lists to the gene-annotation enrichment analysis using the DAVID Functional Annotation Tool (DAVID Bioinformatics Resources 6.8). In all panels, the x-axis shows the number of predicted targets and the y-axis shows the 10 most enriched gene-annotations for each miRNA in the DAVID analysis. Despite variability in the tissue (serum, plasma, CSF) sampled for miRNA biomarker analysis in different patient populations, variable sampling times relative to the epileptogenic process, and variable miRNA analysis platforms, we found many miRNAs bio-markers to target similar molecular functions, including alternative splicing, phosphoprotein, coiled coil as well as nucleic and cytoplasm functions. (B) A circos plot representing all differentially expressed circulating miRNAs and protein biomarkers found in epilepsy studies. Note that only few miRNAs and proteins were found to be dysregulated in multiple studies (panel B; miR-106b and miR-146a upregulated, red line; miR-194 downregulated, blue line). miR-301a was upregulated in one study and downregulated in another (green line, Table 3). Currently, there are no circulating biomarker studies involving animal models, except the one studying HMGB1 (Walker et al., 2017). No same biomarkers were found when plasma/serum was compared with plasma exosomes or CSF. Interestingly, our bioinformatics prediction of targets for dysregulated miRNAs revealed that miR-130a and miR-301a share the same targets (yellow lines in panel B). In addition, striking similarities were found between gene annotation enrichment of the targets of miR-146a and miR-4521 (purple line in panel B; note that the number of predicted targets for these two miRNAs was different). We suggest that when biomarker studies are compared with each other, bioinformatics prediction of the miRNA targets and molecular pathways to which they belong could be one approach to investigate mechanisms behind the increased/decreased miRNA content in body fluids. Color codes: red text, upregulated; blue text, downregulated; red line, upregulated in multiple studies; blue line, downregulated in multiple studies; green line; opposite expression pattern. Abbreviations: CSF, cerebrospinal fluid; miRNA, microRNA.
6. Future perspectives
The translatability of biomarkers from the laboratory to the clinic should be considered in the early phase of planning a biomarker discovery study and in the selection of biomarker candidates and modalities, to optimize the use of resources. To date, the clinical study populations have been heterogeneous, and studies in animal models and clinical populations have little in common. Based on the available experimental data, temporal expression of molecular and cellular pathologies can vary between the epileptogenic pathologies. On the other hand, some cellular pathologies have qualitative similarities in different structural epilepsies, many of which are brain area-independent. For example, astrogliosis is common to various injury types (e.g., stroke, TBI) and independent of its location (e.g., frontal, temporal). The molecular signature of epileptogenesis, however, which is typically studied in the hippocampus, appears to vary depending on the injury type, although some similarities have been reported (Dingledine et al., 2017; Klein et al., 2017; Pitkänen and Lukasiuk, 2011; Srivastava et al., 2017). A caveat in the studies analyzing the cellular and molecular epileptogenesis signature relates to delineation of the focal epileptogenic area for tissue sampling, which typically has limited spatial accuracy. Consequently, the molecular changes observed may be contaminated by “noise” from surrounding non-focal areas. Aligning the etiologically com parable preclinical and clinical studies, and focusing on one epilepsy etiology at a time could pave the way toward more rapid translational biomarker discovery for syndrome-specific diagnostics and therapy development (Fig. 6).
Like drug-discovery, biomarker discovery requires standardized approaches and statistically-sufficient powered preclinical and clinical studies. Recommendations from ongoing International League Against Epilepsy Working groups on the standardization of preclinical methodologies will undoubtedly help in the design of statistically-sufficient powered preclinical biomarker studies, some of which may need to be conducted with a multi-center design (Galanopoulou et al., 2012; Simonato et al., 2014). Considering the role of the subject-specific exposome as a contributor to biomarker expression and therapy response, monitoring of biomarkers that signal the environmental contributors to epileptogenesis or therapy response and, in turn, possibly affect their biomarker levels, is needed. The application of pharmacodynamic/response biomarkers and monitoring biomarkers that accurately report on dose-response in target engagement (e.g., half maximal inhibitory concentration [IC50] value) should become routine in therapy development to instruct in early phase go/no-go decisions.
Biomarker discovery for various epilepsy indications also has major financial/business implications as biomarker discovery will not progress without the parallel development of high-throughput biomarker analysis platforms. On the other hand, treatment development can generate the need for companion device/diagnostics to provide information (via bio-marker analysis) about safe and effective drug use, and complementary device/diagnostics that aid in the benefit-risk decision-making about the use of a therapeutic product where the difference in the benefit-risk is clinically meaningful (Scheerens et al., 2017).
Biomarker discovery for different epilepsy indications is in an early phase of the learning curve. Strategic roadmaps for biomarker discovery in cancer (Pepe et al., 2001) and Alzheimer’s disease (Frisoni et al., 2017) can facilitate epilepsy biomarker discovery to avoid “reinventing-the-wheel”. This will, however, require bringing together various stakeholders, including academia, industry, funding agencies, scientific societies, regulatory agencies, and policy makers to discuss prioritizing the resources for epilepsy biomarker discovery, which will provide the greatest benefit for drug-discovery and patients.
Acknowledgements
This study was supported by the Medical Research Council of the Academy of Finland (272249 and 273909) and NINDS Center without Walls, U54 NS100064 (EpiBioS4Rx).
References
- An N, Zhao W, Liu Y, Yang X, Chen P, 2016. Elevated serum miR-106b and miR- 146a in patients with focal and generalized epilepsy. Epilepsy Res 127, 311–316. 10.1016/j.eplepsyres.2016.09.019. [DOI] [PubMed] [Google Scholar]
- Andrade P, Nissinen J, Pitkänen A, 2017. Generalized seizures after experimental traumatic brain injury occur at the transition from slow-wave to rapid eye movement sleep. J. Neurotrauma 34, 1482–1487. 10.1089/neu.2016.4675. [DOI] [PubMed] [Google Scholar]
- Andrade-Valenca LP, Dubeau F, Mari F, Zelmann R, Gotman J, 2011. Interictal scalp fast oscillations as a marker of the seizure onset zone. Neurology 77, 524–531. 10.1212/WNL.0b013e318228bee2. [DOI] [PMC free article] [PubMed] [Google Scholar]
- Avansini SH, de Sousa Lima BP, Secolin R, Santos ML, Coan AC, Vieira AS, Torres FR, Carvalho BS, Alvim MKM, Morita ME, Yasuda CL, Pimentel- Silva LR, Dogini DB, Rogerio F, Cendes F, Lopes-Cendes I, 2017. MicroRNA hsa-miR-134 is a circulating biomarker for mesial temporal lobe epilepsy. PLoS One 12, e0173060 10.1371/journal.pone.0173060. [DOI] [PMC free article] [PubMed] [Google Scholar]
- Bar-Klein G, Lublinsky S, Kamintsky L, Noyman I, Veksler R, Dalipaj H, Senatorov VV, Swissa E, Rosenbach D, Elazary N, Milikovsky DZ, Milk N, Kassirer M, Rosman Y, Serlin Y, Eisenkraft A, Chassidim Y, Parmet Y, Kaufer D, Friedman A, 2017. Imaging blood-brain barrier dysfunction as a biomarker for epileptogenesis. Brain 140, 1692–1705. 10.1093/brain/awx073. [DOI] [PubMed] [Google Scholar]
- Baulac M, Pitkänen A, 2009. Research priorities in epilepsy for the next decade — a representative view of the European scientific community: summary of the ILAE Epilepsy Research Workshop, Brussels, 17–18 January 2008: workshop reports. Epilepsia 50 10.1111/j.1528-1167.2008.01811.x. [DOI] [Google Scholar]
- BEST (Biomarkers, EndpointS, and other Tools) Resource [WWW Document]. URLhttps://www.ncbi.nlm.nih.gov/books/NBK326791/. [PubMed]
- de Boer HC, van Solingen C, Prins J, Duijs JMGJ, Huisman MV, Rabelink TJ, van Zonneveld AJ, 2013. Aspirin treatment hampers the use of plasma microRNA-126 as a biomarker for the progression of vascular disease. Eur. Heart J 34, 3451–3457. 10.1093/eurheartj/eht007. [DOI] [PubMed] [Google Scholar]
- Bragin A, Engel J, Wilson CL, Fried I, Mathern GW, 1999. Hippocampal and en-torhinal cortex high-frequency oscillations (100–500Hz) in human epileptic brain and in kainic acid-treated rats with chronic seizures. Epilepsia 40, 127–137. [DOI] [PubMed] [Google Scholar]
- Bragin A, Li L, Almajano J, Alvarado-Rojas C, Reid AY, Staba RJ, Engel J, 2016. Pathologic electrographic changes after experimental traumatic brain injury. Epilepsia 57, 735–745. 10.1111/epi.13359. [DOI] [PMC free article] [PubMed] [Google Scholar]
- Bröer S, Löscher W, 2015. Novel combinations of phenotypic biomarkers predict development of epilepsy in the lithium-pilocarpine model of temporal lobe epilepsy in rats. Epilepsy Behav 53, 98–107. 10.1016/j.yebeh.2015.09.028. [DOI] [PubMed] [Google Scholar]
- Chen X, Liang H, Guan D, Wang C, Hu X, Cui L, Chen S, Zhang C, Zhang J, Zen K, Zhang C-Y, 2013. A combination of Let-7d, Let-7g and Let-7i serves as a stable reference for normalization of serum microRNAs. PLoS One 8, e79652 10.1371/journal.pone.0079652. [DOI] [PMC free article] [PubMed] [Google Scholar]
- Choy M, Dube CM, Patterson K, Barnes SR, Maras P, Blood AB, Hasso AN, Obenaus A, Baram TZ, 2014. A novel, noninvasive, predictive epilepsy biomarker with clinical potential. J. Neurosci 34, 8672–8684. 10.1523/JNEUR0SCI.4806-13.2014. [DOI] [PMC free article] [PubMed] [Google Scholar]
- Dingledine R, Coulter DA, Fritsch B, Gorter JA, Lelutiu N, McNamara J, Nadler JV, Pitkänen A, Rogawski MA, Skene P, Sloviter RS, Wang Y, Wadman WJ, Wasterlain C, Roopra A, 2017. Data Descriptor: transcriptional profile of hippocampal dentate granule cells in four rat epilepsy models. Sci. Data 4 10.1038/sdata.2017.61. [DOI] [PMC free article] [PubMed] [Google Scholar]
- Duttagupta R, Jiang R, Gollub J, Getts RC, Jones KW, 2011. Impact of cellular miRNAs on circulating miRNA biomarker signatures. PLoS One 6, e20769 10.1371/journal.pone.0020769. [DOI] [PMC free article] [PubMed] [Google Scholar]
- Engel J, Pitkänen A, Loeb JA, Dudek FE, Bertram EH, Cole AJ, Moshé SL, Wiebe S, Jensen FE, Mody I, Nehlig A, Vezzani A, 2013. Epilepsy biomarkers. Epilepsia 54 (Suppl. 4), 61–69. 10.1111/epi.12299. [DOI] [PMC free article] [PubMed] [Google Scholar]
- Fisher RS, Acevedo C, Arzimanoglou A, Bogacz A, Cross JH, Elger CE, Engel JJ, Forsgren L, French JA, Glynn M, Hesdorffer DC, Lee BI, Mathern GW, Moshe SL, Perucca E, Scheffer IE, Tomson T, Watanabe M, Wiebe S, 2014. ILAE official report: a practical clinical definition of epilepsy. Epilepsia 55, 475–482. 10.1111/epi.12550. [DOI] [PubMed] [Google Scholar]
- Fortunato O, Boeri M, Verri C, Conte D, Mensah M, Suatoni P, Pastorino U, Sozzi G, 2014. Assessment of circulating microRNAs in plasma of lung cancer patients. Molecules 19, 3038–3054. 10.3390/molecules19033038. [DOI] [PMC free article] [PubMed] [Google Scholar]
- Frisoni GB, Boccardi M, Barkhof F, Blennow K, Cappa S, Chiotis K, Démonet J-F, Garibotto V, Giannakopoulos P, Gietl A, Hansson O, Herholz K, Jack CR, Nobili F, Nordberg A, Snyder HM, Ten Kate M, Varrone A, Albanese E, Becker S, Bossuyt P, Carrillo MC, Cerami C, Dubois B, Gallo V, Giacobini E, Gold G, Hurst S, Lonneborg A, Lovblad K-O, Mattsson N, Molinuevo J-L, Monsch AU, Mosimann U, Padovani A, Picco A, Porteri C, Ratib O, Saint- Aubert L, Scerri C, Scheltens P, Schott JM, Sonni I, Teipel S, Vineis P, Visser PJ, Yasui Y, Winblad B, 2017. Strategic roadmap for an early diagnosis of Alzheimer’s disease based on biomarkers. Lancet Neurol 16, 661–676. 10.1016/S1474-4422(17)30159-X. [DOI] [PubMed] [Google Scholar]
- Galanopoulou AS, Buckmaster PS, Staley KJ, Moshé SL, Perucca E, Engel J Jr., Löscher W, Noebels JL, Pitkänen A, Stables J, White HS, O’Brien TJ, Simonato M, 2012. Identification of newepilepsy treatments: issues in preclinical methodology. Epilepsia 53 10.1111/j.1528-1167.2011.03391.x. [DOI] [PMC free article] [PubMed] [Google Scholar]
- Gallek MJ, Skoch J, Ansay T, Behbahani M, Mount D, Manziello A, Witte M, Bernas M, Labiner DM, Weinand ME, 2016. Cortical gene expression: prognostic value for seizure outcome following temporal lobectomy and amygdalohippocampectomy. Neurogenetics 17, 211–218. 10.1007/s10048-016-0484-2. [DOI] [PMC free article] [PubMed] [Google Scholar]
- Ge Q, Zhou Y, Lu J, Bai Y, Xie X, Lu Z, 2014. miRNA in plasma exosome is stable under different storage conditions. Molecules 19, 1568–1575. 10.3390/molecules19021568. [DOI] [PMC free article] [PubMed] [Google Scholar]
- Grasedieck S, Schöler N, Bommer M, Niess JH, Tumani H, Rouhi A, Bloehdorn J, Liebisch P, Mertens D, Döhner H, Buske C, Langer C, Kuchenbauer F, 2012. Impact of serum storage conditions on microRNA stability. Leukemia 26, 2414–2416. 10.1038/leu.2012.106. [DOI] [PubMed] [Google Scholar]
- Guo D, Zeng L, Brody DL, Wong M, 2013. Rapamycin attenuates the development of posttraumatic epilepsy in a mouse model of traumatic brain injury. PLoS One 8 10.1371/journal.pone.0064078. [DOI] [PMC free article] [PubMed] [Google Scholar]
- Hauser WA, Annegers JF, Kurland LT, 1993. Incidence of epilepsy and unprovoked seizures in Rochester, Minnesota: 1935–1984. Epilepsia 34, 453–468. http://www.who.int/mediacentre/factsheets/fs999/en. [DOI] [PubMed] [Google Scholar]
- Hunt RF, Scheff SW, Smith BN, 2009. Posttraumatic epilepsy after controlled cortical impact injury in mice. Exp. Neurol 215, 243–252. 10.1016/j.expneurol.2008.10.005. [DOI] [PMC free article] [PubMed] [Google Scholar]
- Jarry J, Schadendorf D, Greenwood C, Spatz A, van Kempen LC, 2014. The validity of circulating microRNAs in oncology: five years of challenges and contradictions. Mol. Oncol 8, 819–829. 10.1016/j.molonc.2014.02.009. [DOI] [PMC free article] [PubMed] [Google Scholar]
- Kelley MS, Jacobs MP, Lowenstein DH, NINDS Epilepsy Benchmark Stewards, 2009. The NINDS epilepsy research benchmarks. Epilepsia 50, 579–582. 10.1111/j.1528-1167.2008.01813.x. [DOI] [PMC free article] [PubMed] [Google Scholar]
- Klein P, Dingledine R, Aronica E, Bernard C, Blumcke I, Boison D, Brodie MJ, Brooks-Kayal AR, Engel J, Forcelli PA, Hirsch LJ, Kaminski RM, Klitgaard H, Kobow K, Lowenstein DH, Pearl PL, Pitkänen A, Puhakka N, Rogawski MA, Schmidt D, Sillanpää M, Sloviter RS, Steinhäuser C, Vezzani A, Walker MC, Löscher W, 2017. Commonalities in epileptogenic processes from different acute brain insults: do they translate? Epilepsia. 10.1111/epi.13965. [DOI] [PMC free article] [PubMed] [Google Scholar]
- Koufaris C, Wright J, Osborne M, Currie RA, Gooderham NJ, 2013. Time and dose-dependent effects of phenobarbital on the rat liver miRNAome. Toxicology 314, 247–253. 10.1016/j.tox.2013.10.004. [DOI] [PubMed] [Google Scholar]
- Labate A, Cherubini A, Tripepi G, Mumoli L, Ferlazzo E, Aguglia U, Quattrone A, Gambardella A, 2015. White matter abnormalities differentiate severe from benign temporal lobe epilepsy. Epilepsia 56, 1109–1116. 10.1111/epi.13027. [DOI] [PubMed] [Google Scholar]
- Li X, Mauro M, Williams Z, 2015. Comparison of plasma extracellular RNA isolation kits reveals kit-dependent biases. Biotechniques 59, 13–17. 10.2144/000114306. [DOI] [PubMed] [Google Scholar]
- Liang H, Zhang S, Fu Z, Wang Y, Wang N, Liu Y, Zhao C, Wu J, Hu Y, Zhang J, Chen X, Zen K, Zhang C-Y, 2015. Effective detection and quantification of dietetically absorbed plant microRNAs in human plasma. J. Nutr. Biochem 26, 505–512. 10.1016/j.jnutbio.2014.12.002. [DOI] [PubMed] [Google Scholar]
- Liu H-H, Wang J, Chen X-M, Li J-P, Ye W, Zheng J, 2016. Reduced local diffusion homogeneity as a biomarker for temporal lobe epilepsy. Medicine (Baltimore) 95, e4032 10.1097/MD.0000000000004032. [DOI] [PMC free article] [PubMed] [Google Scholar]
- Liu S, Gurses C, Sha Z, Quach MM, Sencer A, Bebek N, Curry DJ, Prabhu S, Tummala S, Henry TR, Ince NF, 2018. Stereotyped high-frequency oscillations discriminate seizure onset zones and critical functional cortex in focal epilepsy. Brain. 10.1093/brain/awx374. [DOI] [PMC free article] [PubMed] [Google Scholar]
- Ma H, Bandos AI, Gur D, 2015. On the use of partial area under the ROC curve for comparison of two diagnostic tests. Biom. J 57, 304–320. 10.1002/bimj.201400023. [DOI] [PubMed] [Google Scholar]
- MacLellan SA, MacAulay C, Lam S, Garnis C, 2014. Pre-profiling factors influencing serum microRNA levels. BMC Clin. Pathol 14, 27 10.1186/1472-6890-14-27. [DOI] [PMC free article] [PubMed] [Google Scholar]
- McCallum AP, Gallek MJ, Ramey W, Manziello A, Witte MH, Bernas MJ, Labiner DM, Weinand ME, 2016. Cortical gene expression correlates of temporal lobe epileptogenicity. Pathophysiology 23, 181–190. 10.1016/j.pathophys.2016.05.006. [DOI] [PubMed] [Google Scholar]
- Milikovsky DZ, Weissberg I, Kamintsky L, Lippmann K, Schefenbauer O, Frigerio F, Rizzi M, Sheintuch L, Zelig D, Ofer J, Vezzani A, Friedman A, 2017. Electrocorticographic dynamics as a novel biomarker in five models of epileptogenesis. J. Neurosci 37, 4450–4461. 10.1523/JNEUROSCI.2446-16.2017. [DOI] [PMC free article] [PubMed] [Google Scholar]
- Miller GW, Jones DP, 2014. The nature of nurture: refining the definition of the ex- posome. Toxicol. Sci 137, 1–2. 10.1093/toxsci/kft251. [DOI] [PMC free article] [PubMed] [Google Scholar]
- Miszczuk D, Dębski KJ, Tanila H, Lukasiuk K, Pitkänen A, 2016. Traumatic brain injury increases the expression of Nos1, Aβ clearance, and epileptogenesis in APP/ PS1 mouse model of Alzheimer’s disease. Mol. Neurobiol 53, 7010–7027. 10.1007/s12035-015-9578-3. [DOI] [PubMed] [Google Scholar]
- Mitchell PS, Parkin RK, Kroh EM, Fritz BR, Wyman SK, Pogosova-Agadjanyan EL, Peterson A, Noteboom J, O’Briant KC, Allen A, Lin DW, Urban N, Drescher CW, Knudsen BS, Stirewalt DL, Gentleman R, Vessella RL, Nelson PS, Martin DB, Tewari M, 2008. Circulating microRNAs as stable blood-based markers for cancer detection. Proc. Natl. Acad. Sci. U. S. A 105, 10513–10518. 10.1073/pnas.0804549105. [DOI] [PMC free article] [PubMed] [Google Scholar]
- Narasimhan H, Agarwal S, 2017. Support vector algorithms for optimizing the partial area under the ROC curve. Neural Comput. 29, 1919–1963. 10.1162/NEC0_a_00972. [DOI] [PubMed] [Google Scholar]
- Pascente R, Frigerio F, Rizzi M, Porcu L, Boido M, Davids J, Zaben M, Tolomeo D, Filibian M, Gray WP, Vezzani A, Ravizza T, 2016. Cognitive deficits and brain myo-Inositol are early biomarkers of epileptogenesis in a rat model of epilepsy. Neurobiol. Dis 93, 146–155. 10.1016/j.nbd.2016.05.001. [DOI] [PubMed] [Google Scholar]
- Pepe MS, Etzioni R, Feng Z, Potter JD, Thompson ML, Thornquist M, Winget M, Yasui Y, 2001. Phases of biomarker development for early detection of cancer. J. Natl. Cancer Inst 93, 1054–1061. [DOI] [PubMed] [Google Scholar]
- Pitkänen A, Engel J Jr., 2014. Past and present definitions of epileptogenesis and its biomarkers. Neurotherapeutics 11 10.1007/s13311-014-0257-2. [DOI] [PMC free article] [PubMed] [Google Scholar]
- Pitkänen A, Immonen R, 2014. Epilepsy related to traumatic brain injury. Neurotherapeutics. 10.1007/s13311-014-0260-7. [DOI] [PMC free article] [PubMed] [Google Scholar]
- Pitkänen A, Lukasiuk K, 2011. Mechanisms of epileptogenesis and potential treatment targets. Lancet Neurol 10, 173–186. 10.1016/S1474-4422C10)70310-0. [DOI] [PubMed] [Google Scholar]
- Pitkänen A, Loscher W, Vezzani A, Becker AJ, Simonato M, Lukasiuk K, Grohn O, Bankstahl JP, Friedman A, Aronica E, Gorter JA, Ravizza T, Sisodiya SM, Kokaia M, Beck H, 2016. Advances in the development of biomarkers for epilepsy. Lancet Neurol 15, 843–856. 10.1016/S1474-4422(16)00112-5. [DOI] [PubMed] [Google Scholar]
- Plog BA, Dashnaw ML, Hitomi E, Peng W, Liao Y, Lou N, Deane R, Nedergaard M, 2015. Biomarkers of traumatic injury are transported from brain to blood via the glymphatic system. J. Neurosci 35, 518–526. 10.1523/JNEUR0SCI.3742-14.2015. [DOI] [PMC free article] [PubMed] [Google Scholar]
- Pollard JR, Eidelman O, Mueller GP, Dalgard CL, Crino PB, Anderson CT, Brand EJ, Burakgazi E, Ivaturi SK, Pollard HB, 2012. The TARC/sICAM5 ratio in patient plasma is a candidate biomarker for drug resistant epilepsy. Front. Neurol 3, 181 10.3389/fneur.2012.00181. [DOI] [PMC free article] [PubMed] [Google Scholar]
- Pritchard CC, Cheng HH, Tewari M, 2012a. MicroRNA profiling: approaches and considerations. Nat. Rev. Genet 13, 358–369. 10.1038/nrg3198. [DOI] [PMC free article] [PubMed] [Google Scholar]
- Pritchard CC, Kroh E, Wood B, Arroyo JD, Dougherty KJ, Miyaji MM, Tait JF, Tewari M, 2012b. Blood cell origin of circulating microRNAs: a cautionary note for cancer biomarker studies. Cancer Prev. Res. (Phila.) 5, 492–497. 10.1158/1940-6207.CAPR-11-0370. [DOI] [PMC free article] [PubMed] [Google Scholar]
- Ramón-Núñez LA, Martos L, Fernández-Pardo Á, Oto J, Medina P, España F, Navarro S, 2017. Comparison of protocols and RNA carriers for plasma miRNA isolation. Unraveling RNA carrier influence on miRNA isolation. PLoS One 12, e0187005 10.1371/journal.pone.0187005. [DOI] [PMC free article] [PubMed] [Google Scholar]
- Raoof R, Jimenez-Mateos EM, Bauer S, Tackenberg B, Rosenow F, Lang J, Onugoren MD, Hamer H, Huchtemann T, Körtvélyessy P, Connolly NMC, Pfeiffer S, Prehn JHM, Farrell MA, O’Brien DF, Henshall DC, Mooney C, 2017. Cerebrospinal fluid microRNAs are potential biomarkers of temporal lobe epilepsy and status epilepticus. Sci. Rep 7, 3328 10.1038/s41598-017-02969-6. [DOI] [PMC free article] [PubMed] [Google Scholar]
- Rizzo A, Donzelli S, Girgenti V, Sacconi A, Vasco C, Salmaggi A, Blandino G, Maschio M, Ciusani E, 2017. In vitro antineoplastic effects of brivaracetam and lacosamide on human glioma cells. J. Exp. Clin. Cancer Res 36, 76 10.1186/s13046-017-0546-9. [DOI] [PMC free article] [PubMed] [Google Scholar]
- Robin X, Turck N, Hainard A, Tiberti N, Lisacek F, Sanchez J-C, Muller M, 2011. pROC: an open-source package for R and S+ to analyze and compare ROC curves. BMC Bioinformatics 12, 77 10.1186/1471-2105-12-77. [DOI] [PMC free article] [PubMed] [Google Scholar]
- Roehri N, Pizzo F, Lagarde S, Lambert I, Nica A, McGonigal A, Giusiano B, Bartolomei F, Benar C-G, 2017. High-frequency oscillations are not better bio-markers of epileptogenic tissues than spikes. Ann. Neurol 10.1002/ana.25124. [DOI] [PubMed] [Google Scholar]
- Scheerens H, Malong A, Bassett K, Boyd Z, Gupta V, Harris J, Mesick C, Simnett S, Stevens H, Gilbert H, Risser P, Kalamegham R, Jordan J, Engel J, Chen S, Essioux L, Williams JA, 2017. Current status of companion and complementary diagnostics: strategic considerations for development and launch. Clin. Transl. Sci 10, 84–92. 10.1111/cts.12455. [DOI] [PMC free article] [PubMed] [Google Scholar]
- Scheffer IE, Berkovic S, Capovilla G, Connolly MB, French J, Guilhoto L, Hirsch E, Jain S, Mathern GW, Moshé SL, Nordli DR, Perucca E, Tomson T, Wiebe S, Zhang Y-H, Zuberi SM, 2017. ILAE classification of the epilepsies: position paper of the ILAE Commission for Classification and Terminology. Epilepsia 58, 512–521. 10.1111/epi.13709. [DOI] [PMC free article] [PubMed] [Google Scholar]
- Simonato M, Brooks-Kayal AR, Engel J, Galanopoulou AS, Jensen FE, Moshé SL, O’Brien TJ, Pitkanen A, Wilcox KS, French JA, 2014. The challenge and promise of anti-epileptic therapy development in animal models. Lancet Neurol 13 10.1016/S1474-4422(14)70076-6. [DOI] [PMC free article] [PubMed] [Google Scholar]
- Srivastava PK, Roncon P, Lukasiuk K, Gorter JA, Aronica E, Pitkänen A, Petretto E, Johnson MR, Simonato M, 2017. Meta-analysis of microRNAs dysregulated in the hippocampal dentate gyrus of animal models of epilepsy. eNeuro 4 10.1523/ENEURO.0152-17.2017. [DOI] [PMC free article] [PubMed] [Google Scholar]
- Sun J, Cheng W, Liu L, Tao S, Xia Z, Qi L, Huang M, 2016a. Identification of serum miRNAs differentially expressed in human epilepsy at seizure onset and post-seizure. Mol. Med. Rep 14, 5318–5324. 10.3892/mmr.2016.5906. [DOI] [PubMed] [Google Scholar]
- Sun Y, Wang X, Wang Z, Zhang Y, Che N, Luo X, Tan Z, Sun X, Li X, Yang K, Wang G, Luan L, Liu Y, Zheng X, Wei M, Cheng H, Yin J, 2016b. Expression of microRNA-129-2-3p and microRNA-935 in plasma and brain tissue of human refractory epilepsy. Epilepsy Res 127, 276–283. 10.1016/j.eplepsyres.2016.09.016. [DOI] [PubMed] [Google Scholar]
- Surges R, Kretschmann A, Abnaof K, van Rikxoort M, Ridder K, Fröhlich H, Danis B, Kaminski RM, Foerch P, Elger CE, Weinsberg F, Pfeifer A, 2016. Changes in serum miRNAs following generalized convulsive seizures in human mesial temporal lobe epilepsy. Biochem. Biophys. Res. Commun 481, 13–18. 10.1016/j.bbrc.2016.11.029. [DOI] [PubMed] [Google Scholar]
- Tomkins O, Shelef I, Kaizerman I, Eliushin A, Afawi Z, Misk A, Gidon M, Cohen A, Zumsteg D, Friedman A, 2008. Blood-brain barrier disruption in post-traumatic epilepsy. J. Neurol. Neurosurg. Psychiatry 79, 774–777. 10.1136/jnnp.2007.126425. [DOI] [PubMed] [Google Scholar]
- van Vliet EA, Puhakka N, Mills JD, Srivastava PK, Johnson MR, Roncon P, Das Gupta S, Karttunen J, Simonato M, Lukasiuk K, Gorter JA, Aronica E, Pitkänen A, 2017. Standardization procedure for plasma biomarker analysis in rat models of epileptogenesis: focus on circulating microRNAs. Epilepsia 58 10.1111/epi.13915. [DOI] [PubMed] [Google Scholar]
- Walker LE, Frigerio F, Ravizza T, Ricci E, Tse K, Jenkins RE, Sills GJ, Jorgensen A, Porcu L, Thippeswamy T, Alapirtti T, Peltola J, Brodie MJ, Park BK, Marson AG, Antoine DJ, Vezzani A, Pirmohamed M, 2017. Molecular isoforms of high-mobility group box 1 are mechanistic biomarkers for epilepsy. J. Clin. Invest 127, 2118–2132. 10.1172/JCI92001. [DOI] [PMC free article] [PubMed] [Google Scholar] [Retracted]
- Walter SD, 2005. The partial area under the summary ROC curve. Stat. Med 24, 2025–2040. 10.1002/sim.2103. [DOI] [PubMed] [Google Scholar]
- Wang X, Sun Y, Tan Z, Che N, Ji A, Luo X, Sun X, Li X, Yang K, Wang G, Luan L, Liu Y, Wei M, Yin J, 2015. Serum microRNA-4521 is a potential biomarker for focal cortical dysplasia with refractory epilepsy. Neurochem. Res 10.1007/s11064-015-1773-0. [DOI] [PubMed] [Google Scholar]
- Wang J, Tan L, Tan L, Tian Y, Ma J, Tan C-C, Wang H-F, Liu Y, Tan M-S, Jiang T, Yu J-T, 2015a. Circulating microRNAs are promising novel biomarkers for drug-resistant epilepsy. Sci. Rep 5, 10201 10.1038/srep10201. [DOI] [PMC free article] [PubMed] [Google Scholar]
- Wang J, Yu J-T, Tan L, Tian Y, Ma J, Tan C-C, Wang H-F, Liu Y, Tan M-S, Jiang T, Tan L, 2015b. Genome-wide circulating microRNA expression profiling indicates biomarkers for epilepsy. Sci. Rep 5, 9522 10.1038/srep09522. [DOI] [PMC free article] [PubMed] [Google Scholar]
- Wang R, Zeng GQ, Liu X, Tong RZ, Zhou D, Hong Z, 2016a. Evaluation of serum matrix metalloproteinase-3 as a biomarker for diagnosis of epilepsy. J. Neurol. Sci 367, 291–297. 10.1016/j.jns.2016.06.031. [DOI] [PubMed] [Google Scholar]
- Wang R, Zeng GQ, Tong RZ, Zhou D, Hong Z, 2016b. Serum matrix metallopro-teinase-2: a potential biomarker for diagnosis of epilepsy. Epilepsy Res 122, 114–119. 10.1016/j.eplepsyres.2016.02.009. [DOI] [PubMed] [Google Scholar]
- Wang X, Luo Y, Liu S, Tan L, Wang S, Man R, 2017. MicroRNA-134 plasma levels before and after treatment with valproic acid for epilepsy patients. Oncotarget 8, 72748–72754. 10.18632/oncotarget.20292. [DOI] [PMC free article] [PubMed] [Google Scholar]
- Wickham H, 2009. ggplot2: Elegant Graphics for Data Analysis. Springer-Verlag, New York. [Google Scholar]
- Wild CP, 2012. The exposome: from concept to utility. Int. J. Epidemiol 41, 24–32. 10.1093/ije/dyr236. [DOI] [PubMed] [Google Scholar]
- Won D, Kim W, Chaovalitwongse WA, Tsai JJ, 2017. Altered visual contrast gain control is sensitive for idiopathic generalized epilepsies. Clin. Neurophysiol 128, 340–348. 10.1016/j.clinph.2016.12.008. [DOI] [PMC free article] [PubMed] [Google Scholar]
- Xiang M, Zeng Y, Yang R, Xu H, Chen Z, Zhong J, Xie H, Xu Y, Zeng X, 2014. U6 is not a suitable endogenous control for the quantification of circulating microRNAs. Biochem. Biophys. Res. Commun 454, 210–214. 10.1016/j.bbrc.2014.10.064. [DOI] [PubMed] [Google Scholar]
- Yamada A, Cox MA, Gaffney KA, Moreland A, Boland CR, Goel A, 2014. Technical factors involved in the measurement of circulating microRNA biomarkers for the detection of colorectal neoplasia. PLoS One 9, e112481 10.1371/journal.pone.0112481. [DOI] [PMC free article] [PubMed] [Google Scholar]
- Yan S, Zhang H, Xie W, Meng F, Zhang K, Jiang Y, Zhang X, Zhang J, 2017. Altered microRNA profiles in plasma exosomes from mesial temporal lobe epilepsy with hippocampal sclerosis. Oncotarget 8, 4136–4146. 10.18632/oncotarget.13744. [DOI] [PMC free article] [PubMed] [Google Scholar]
- Yang H, Lu K, Lyu X, Hu F, 2017. Two-way partial AUC and its properties. Stat. Methods Med. Res 962280217718866 10.1177/0962280217718866. [DOI] [PubMed] [Google Scholar]