

Abstract
Background & Aims
Lgr5 overexpression has been detected in colorectal cancers (CRCs), including some cases of colitis-associated CRCs. In colitis-associated CRCs, chronic inflammation is a contributing factor in carcinogenesis. We recently reported that intestinal Na+/H+ exchanger isoform 8 (NHE8) plays an important role in intestinal mucosal protection and that loss of NHE8 expression results in an ulcerative colitis–like condition. Therefore, we hypothesized that NHE8 may be involved in the development of intestinal tumors.
Methods
We assessed NHE8 expression in human CRCs by immunohistochemistry and studied tumor burden in NHE8 knockout (KO) mice using an azoxymethane/dextran sodium sulfate colon cancer model. We also evaluated cell proliferation in HT29NHE8KO cells and assessed tumor growth in NOD scid gamma (NSG) mice xenografted with HT29NHE8KO cells. To verify if a relationship exists between Lgr5 and NHE8 expression, we analyzed Lgr5 expression in NHE8KO mice by polymerase chain reaction and in situ hybridization. Lgr5 expression and cell proliferation in the absence of NHE8 were confirmed in colonic organoid cultures. The expression of β-catenin and c-Myc also were analyzed to evaluate Wnt/β-catenin activation.
Results
NHE8 was undetectable in human CRC tissues. Although only 9% of NHE8 wild-type mice showed tumorigenesis in the azoxymethane/dextran sodium sulfate colon cancer model, almost 10 times more NHE8KO mice (89%) developed tumors. In the absence of NHE8, a higher colony formation unit was discovered in HT29NHE8KO cells. In NSG mice, larger tumors developed at the site where HT29NHE8KO cells were injected compared with HT29NHE8 wild type cells. Furthermore, NHE8 deficiency resulted in increased Lgr5 expression in the colon, in HT29-derived tumors, and in colonoids. The absence of NHE8 also increased Wnt/β-catenin activation.
Conclusions
NHE8 might be an intrinsic factor that regulates Wnt/β-catenin in the intestine.
Keywords: NHE8, Colorectal Tumor, Lgr5
Abbreviations used in this paper: AOM, azoxymethane; CRC, colorectal cancer; CRISPR/Cas9, clustered regularly interspaced short palindromic repeats and CRISPR-associated protein 9; DMEM, Dulbecco's modified Eagle medium; DSS, dextran sodium sulfate; EdU, 5-ethynyl-2’-deoxyuridine; EGFP, enhanced green fluorescent protein; FACS, fluorescence-activated cell sorter; KO, knockout; mRNA, messenger RNA; NHE, Na+/H+ exchanger; NSG, NOD scid gamma; PCR, polymerase chain reaction; UC, ulcerative colitis; WT, wild type
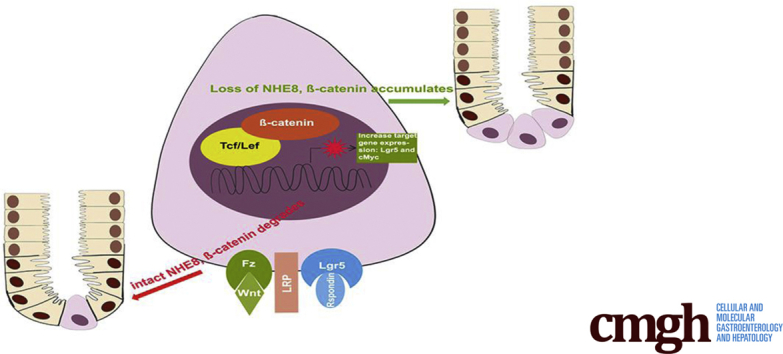
Graphical abstract
See editorial on page 241.
Summary.
We discovered that Na+/H+ exchanger isoform 8 (NHE8) expression is strongly inhibited in human colorectal cancer and that loss of NHE8 function resulted in increased tumor burden in mice. Furthermore, we found that NHE8 is expressed in intestinal stem cells. Thus, NHE8 likely is involved in Wnt/ß-catenin pathway regulation.
The Slc9 family of Na+/H+ exchangers (NHEs) plays critical roles in many pathologic and physiological processes. Each member has unique tissue distribution, cellular localization, inhibitor sensitivity, and physiological regulation. NHEs are involved in electroneutral NaCl transport, acid-base regulation, intracellular pH homeostasis, cell volume regulation, and cell adhesion/migration/proliferation.1, 2, 3, 4, 5, 6 Four NHEs (NHE isoform 1 [NHE1], NHE2, NHE3, and NHE8) were identified in the mammalian alimentary tract. NHE1, a ubiquitous basolateral membrane protein, regulates intracellular pH and cell volume in the intestinal epithelial cells. NHE2, NHE3, and NHE8, all apical membrane proteins, are expressed specifically in the enterocytes. NHE2 and NHE3 have little functional overlap: NHE2 is vital for parietal cell viability,7 while NHE3 is important in intestinal and renal Na+ absorption.8 Although NHE3 does not compensate for the loss of NHE2, or vice versa, NHE8 can partially compensate for the loss of 1 or both of NHE2 and NHE3.9, 10 The function of NHE8 also extends beyond Na+ absorption. In the intestine, NHE8 expression is critical for epithelial mucosal homeostasis via its effects on antibacterial peptide and mucin production, as well as epithelial bicarbonate secretion.11, 12, 13 In the kidney, NHE8 is involved in renal acidification at a young age and plays a compensatory role in renal acidification and blood pressure regulation in the absence of NHE3 function.14 In the eye, NHE8 is necessary for ocular surface protection, photoreceptor cell survival, and retinal pigmented epithelium function.15, 16, 17 In the testis, NHE8 is involved in testosterone production in Leydig cells.18
Loss of mucosal integrity has significant consequences and is considered an etiologic factor in the pathogenesis of inflammatory bowel disease.19 Chronic inflammation in the intestinal tract also has been linked to the development of colorectal cancer (CRC), the third most common cancer worldwide and the number one cause of nonsmoking cancer-related deaths in the world.20 In our recent studies, we showed that NHE8 expression is reduced in colitis animal models and in ulcerative colitis (UC) patients.12, 21, 22 We also showed that loss of NHE8 expression in mice is associated with spontaneous colitis with features of human UC and with changes in gut microbial ecology, increased epithelial cell proliferation, and high susceptibility to DSS-induced colitis.12, 13 Thus, NHE8 appears to have a critical role in the preservation of mucosal homeostasis, and loss of NHE8 expression significantly contributes to the inflammatory response and possible colonic tumorigenesis. In the current study, we studied the impact of NHE8 deficiency on tumor growth and Lgr5 expression in the colon and expanded our understanding of the mechanism by which loss of NHE8 function contributes to the pathogenesis of gastrointestinal inflammation and colon cancer.
Results
NHE8 Expression Is Absent in Human Colorectal Tumors
Because NHE8 expression is down-regulated in colitis animal models and in human UC,12, 21, 22 we wondered if NHE8 expression is altered in colon cancers. To address this question, we used immunohistochemical staining to detect NHE8 protein in human colonic cancer tissue sections from spontaneous colon cancers. As indicated in Figure 1, NHE8 expression is intact in healthy colorectal tissues, but its expression is barely detected in colorectal cancer tissues. The fluorescent intensity of NHE8 in tissue sections is reduced dramatically from 47.54 ± 35.18 units in normal colon sections to 4.82 ± 2.77 units in CRC section (means ± SD).
Figure 1.

NHE8 expression in the normal colonic tissue and colorectal adenocarcinoma. Human colonic tissue sections obtained from the Pathology Laboratory at the University of Arizona were reacted with NHE8 antibody following the procedure described in the Materials and Methods section. Upper panels: H&E staining for normal colonic mucosa (left) and colorectal adenocarcinoma (right). Lower panels: NHE8 immunohistochemistry staining for normal colonic mucosa (left) and colorectal adenocarcinoma (right). Strong NHE8 expression in colonic epithelial lining and cancer cells lose NHE8 expression. NHE8 is labeled with red, and nuclei are labeled with blue. The number (means ± SD) below the NHE8 immunohistochemistry pictures shows the fluorescent intensity of NHE8 staining.
NHE8KO Mice Are Susceptible to AOM/DSS-Induced Tumor Formation
We have reported that NHE8KO mice developed a UC-like phenotype characterized by colonic inflammation, microbial dysbiosis, and reduced mucin production.11, 12, 13 Given that chronic colitis leads to colon cancer, we studied the susceptibility of NHE8KO mice to colon cancer using an AOM/DSS colon cancer model. The AOM/DSS model significantly shortens the latency time for induction of CRC with high reproducibility.23 Mice were treated following the procedure indicated in Figure 2A. As shown in Figure 2B and C, AOM/DSS-treated NHE8KO mice significantly attenuated their body weight gain and shortened their colon compared with NHE8WT mice. Macroscopic and histologic evaluation showed a significantly higher incidence of tumor formation in AOM/DSS-treated NHE8KO mice (tumor penetrance was 89% in NHE8KO mice vs 9% in NHE8WT mice). NHE8WT mice developed fewer tumors (0–1 tumor/mouse), while NHE8KO mice developed more tumors in response to AOM/DSS (>8 tumors/mouse). In tumor-bearing NHE8WT mice, only mild colonic inflammation was noted, and tumor invasion was limited to the lamina propria. In contrast, NHE8KO mice had pervasive mucosal inflammation and the tumors were significantly more aggressive (Figure 2D).
Figure 2.

AOM/DSS-induced colonic tumors in NHE8WT and NHE8KO mice. NHE8KO and NHE8WT male mice (age, 7–8 wk) were administered intraperitoneal AOM at a dose of 7.4 mg/kg body weight. Five days after AOM administration, mice were given 2% DSS in drinking water for 5 days, followed by regular water for 14 days. The DSS/water treatment was repeated 3 times. Mice were fed with regular water for 28 days after the last DSS treatment and then killed for further analysis. WT, NHE8WT mice; KO, NHE8KO mice. (A) AOM/DSS treatment schedule. (B) Measurement of body weight, colon length, and tumors in AOM/DSS-treated mice. (C) Morphologic observation of colon surface in AOM/DSS-treated NHE8WT and NHE8KO mice. Colon tissues were collected from AOM/DSS-treated mice, and then cut open to expose the lumen inside the colon to observe tumors. The image is a representative picture from AOM/DSS-treated NHE8WT and NHE8KO mice. The circles in the picture indicate the tumors. (D) Histologic evaluation of tumors in AOM/DSS-treated NHE8WT and NHE8KO mice. Tissues from the distal colon were fixed and sectioned. H&E staining was used to show tissue morphology. Top panels: H&E stain images from 4 NHE8WT mice and 4 NHE8KO mice. Bottom panels: Representative images showing inflammation, infiltration, adenomas, and adenocarcinomas in tumor-bearing mice.
NHE8 Deficiency Promotes Colony Formation in HT29 Cells
To understand if loss of NHE8 stimulates cell growth, we introduced NHE8 deficiency in HT29 cells, a human colonic epithelial cell line, using CRISPR/Cas9 technology. As indicated in Figure 3A, NHE8 protein expression was nearly gone (only 7% remained) in NHE8KO CRISPR/Cas9 DNA-transfected cells. In these cells, significantly higher colony formation units were seen in HT29NHE8KO cells compared with HT29NHE8WT cells (762 ± 228 colony formation units in HT29NHE8KO cells vs 146 ± 49 colony formation units in HT29NHE8WT cells, n = 3; P = .005) (Figure 3B).
Figure 3.

Colony formation assay in the absence of NHE8 in HT29 human colonic cells. (A) Western blot detection of NHE8 expression in HT29NHE8WT and HT29NHE8KO cells. HT29 cells were transfected with NHE8KO CRISP/Cas9 DNA. Total cell lysates were prepared 72 hours after transfection. NHE8 antibody was used to detect NHE8 protein expression in these cells. The number shows the relative expression levels of NHE8 in cells. HT29, cells without NHE8KO CRISP/Cas9 DNA transfection; HT29-KO, cells transfected with NHE8KO CRISP/Cas9 DNA. (B) Colony formation unit assay. HT29NHE8WT and HT29NHE8KO cells were seeded in a 24-well culture plate at a density of 1000 cells/well and cultured for 10 days. Cells were stained with crystal violet according to the procedure described in the Materials and Methods section. The wells then were examined and the colonies were counted. Top panel: Representative image from stained culture wells. Bottom panel: Summary data of colony counts. Results are means ± SD from 3 wells of cells. T-Test is used to examine the statistical significance. *P < .01 for HT29NHE8WT cells (HT29) vs HT29NHE8KO cells (HT29-KO). (C) Tumor derived from HT29NHE8WT and HT29NHE8KO cells. HT29NHE8WT and HT29NHE8KO cells (1000,000 cells in 100 μL/injection site) were injected into the left and right flanks of NSG mice, respectively. Four weeks after injection, mice were killed and tumors were examined. Top panels: Representative pictures of tumors taken from xenografted NSG mice. Bottom panel: Summary data of tumor weight and tumor size. Results are means ± SD from 9 mice. T-Test is used to examine the statistical significance. *P < .01 for HT29NHE8WT cells (HT29) vs HT29NHE8KO cells (HT29-KO).
Loss of NHE8 in HT29 Cells Results in More Aggressive Tumor Growth in NSG Mice
To test if NHE8-deficient HT29 cells also grow faster in in vivo conditions, we injected HT29NHE8KO and HT29NHE8WT cells in the flanks of NSG mice. In agreement with the in vitro observation, the tumor grown from HT29NHE8KO cells was bigger than the tumors grown from HT29NHE8WT cells. The tumor mass derived from HT29NHE8KO cells was heavier than that from HT29NHE8WT cells (0.71 ± 0.41 g in HT29NHE8KO tumors vs 0.23 ± 0.16 g in HT29NHE8WT tumors, n = 9; P = .0025). The size of the tumor from HT29NHE8KO cells also was significantly larger than that from HT29NHE8WT cells (0.90 ± 0.51 cm3 in HT29NHE8KO tumors vs 0.22 ± 0.16 cm3 in HT29NHE8WT tumors, n = 9; P = .0007) (Figure 3C). The expression of inflammatory cytokines (interleukin 1β and tumor necrosis factor-α) was not altered in these tumors (data not shown).
NHE8 Is Expressed in Colonic Crypts
Our previous study showed that NHE8 is expressed in the epithelial cells in the intestine, but whether it is expressed in the crypts remains unclear. To address this question, we performed immunohistochemistry to detect NHE8 protein in the colonic crypts. We also isolated stem cells from Lgr5-EGFP mice to measure NHE8 gene expression. As shown in Figure 4A, NHE8 protein was detected in almost all cells in the crypts in the colon. In FACS-isolated EGFP-labeled stem cells, NHE8 was expressed in the stem cells with expression levels similar to those in non–stem cells in the crypts (Figure 4B).
Figure 4.

NHE8 expression in the crypts and the colonic stem cell. (A) Immunohistochemical staining of NHE8 in the colonic crypt base in NHE8WT mice. Tissues from the distal colon were fixed and sectioned. The NHE8 antibody was used to detect NHE8 expression and localization. In the crypts, NHE8 was detected in almost all cells at the crypt base. NHE8 was labeled with red, and nuclei were labeled with blue. (B) PCR detection of NHE8 expression in stem cells (Lgr5+) and non–stem cells (Lgr5-). Colonic crypts were isolated from 4 Lgr5-EGFP male mice, and single-cell suspension was prepared for FACS. Total RNAs were purified from colon crypts, stem cells, and non–stem cells. Real-time PCR was performed to determine the expression of NHE8 in these samples. The bar chart shows the PCR result from isolated crypts and FACS sorted cells.
Lgr5 Expression Is Altered in NHE8KO Mice
We have noticed that loss of NHE8 resulted in hyperproliferation.13 Therefore, we wanted to determine if Lgr5 expression was altered in NHE8KO mice. Initial microarray analysis indicated a 1.8-fold increase in the expression of the Lgr5 gene in NHE8KO mice compared with NHE8WT mice (n = 3; P = .013). Real-time polymerase chain reaction (PCR) confirmed this observation. As shown in Figure 5A, Lgr5 messenger RNA (mRNA) expression in the colonic tissue was increased significantly in NHE8KO mice (2.26 ± 0.39 in NHE8KO mice vs 0.98 ± 0.07 in NHE8WT mice, n = 4 mice; P = .001), and its expression was increased further in AOM/DSS-treated NHE8KO mice (17.70 ± 15.23 in NHE8KO mice vs 1.01 ± 0.67 in NHE8WT mice, n = 6 mice; P = .011). A similar observation also was seen in HT29NHE8KO cells. Lgr5 expression was increased from 1.22 ± 0.69 in HT29NHE8WT cells to 4.76 ± 1.71 in HT29NHE8KO cells (n = 4; P = .008).
Figure 5.

Lgr5 expression alteration in the absence of NHE8 function. (A) Total RNAs were purified from colonic tissues and used for real-time PCR to detect Lgr5 expression. Results are shown as means ± SD. T-Test used to examine the statistical significance. Left panel: Lgr5 expression in normal NHE8WT and NHE8KO colons from 8 mice (4 mice/group); *P < .015 for NHE8WT mice (WT) vs NHE8KO mice (KO). Middle panel: Lgr5 expression in AOM/DSS NHE8WT and NHE8KO colons from 12 mice (6 mice/group); *P < .01 for AOM/DSS-treated NHE8WT mice (WT) vs AOM/DSS-treated NHE8KO mice (KO). Right panel: Lgr5 expression in 8 tumors derived from HT29NHE8WT and HT29NHE8KO cells (4 tumors/group); *P < .01 for HT29NHE8WT cells (HT29) vs HT29NHE8KO cells (HT29-KO). (B) Lgr5 in situ hybridization using mouse colon tissue sections prepared from NHE8WT (WT) and NHE8KO (KO) mice. Left panels: Representative image from in situ hybridization experiments. Right panels: Summary data of Lgr5-positive cell counts (means ± SD) from 42 crypts observed in 2 mice. T-Test was used to examine the statistical significance. *P < .0001 for NHE8WT mice (WT) vs NHE8KO mice (KO). (C) Lgr5 in situ hybridization using mouse colon tissue sections prepared from AOM/DSS-treated NHE8WT (AOM/DSS WT) and NHE8KO (AOM/DSS KO) mice. According to the manufacturer’s instructions, the size and density of the reddots reflect the expression levels of Lgr5 in tissue sections. Strong Lgr5 signals were seen in tissue sections from AOM/DSS-treated NHE8KO mice (indicated by more and larger red dots).
The Number of Lgr5-Expressing Cells Is Increased in the Absence of NHE8
Because Lgr5 mRNA expression was increased in the absence of NHE8, we wondered if this increase was owing to an increased Lgr5 mRNA level and/or increased Lgr5-expressing cells. To address this question, we performed in situ hybridization using a mouse-specific Lgr5 probe. As shown in Figure 5B, the Lgr5 probe detected more and stronger signals in the crypts in NHE8KO mice, and the number of Lgr5-expressing cells also was significantly higher in NHE8KO mice than in that of NHE8WT mice (7.9 ± 1.9 cells/crypt in NHE8KO mice vs 2.9 ± 1.5 cells/crypt in NHE8WT mice, n = 42 crypts from 2 mice; P < .000001). A similar observation also was seen in AOM/DSS-induced tumors. Lgr5 signals were observed mainly in the crypts in AOM/DSS-treated NHE8WT mice, but were detected mostly in the tumor region in NHE8KO mice (Figure 5C).
The Expression of Lgr5 and the Number of Proliferating Cells Are Increased in Cultured NHE8KO Colonoids
We previously showed that actively proliferating cells were present in the entire crypt region in NHE8KO mice, whereas they were present only in the bottom of the crypts in NHE8WT mice.13 To test whether this was a primary effect or a secondary effect from dysbiosis and/or inflammation, we isolated intestinal crypts and performed a 3-dimensional organoid culture in Matrigel (ThermFisher Scientific, Waltham, MA) according to published methods.24, 25, 26 We successfully isolated colonic crypts and grew them into colonic organoids. Total RNAs were extracted from these colonoids and real-time PCR was performed to determine the expression of Lgr5. As shown in Figure 6A, the expression of Lgr5 was increased significantly in NHE8KO colonoids (3.54 ± 0.78 in NHE8KO colonoids vs 1.02 ± 0.18 in NHE8WT colonoids, n = 6; P = .00003). In cultured colonoids, EdU labeling showed more EdU-positive cells in NHE8KO colonoids than in NHE8WT colonoids (Figure 6B), which was consistent with in vivo observations.
Figure 6.

Lgr5 expression and cell proliferation in colonoids. The entire colons from 3–4 mice (age, 7–8 wk) were collected and used for crypt isolation according to the procedure described in the Materials and Methods section. The final crypt pellets were mixed with Matrigel and seeded in 24-well culture plates. The colonoids were cultured in a conditioned medium containing Wnt3a–R-spondin–noggin. Culture medium was replaced every 3–4 days, and colonoids were passaged every 5–7 days. (A) Colonoids were cultured for 5 days and then collected for total RNA purification. Real-time PCR was performed to detect the expression of Lgr5. Results are means ± SD from 6 separate experiments. T-Test was used to examine statistical significance. *P < .01 for NHE8WT colonoids (WT) vs NHE8KO colonoids (KO). (B) Colonic organoids were cultured for 5 days, and then labeled with EdU according to the manufacturer’s instructions. The labeled cells were observed using a confocal microscope. Left panels: Representative images of live colonoids growing in Matrigel from NHE8WT (WT) and NHE8KO (KO) mice. Right panels: Organoids after EdU label. Red, EdU-labeled cells; blue, nuclei staining.
Enhanced Wnt/β-Catenin Pathway Is Detected in NHE8-Deficient Tumors
To determine if the increased expression of Lgr5 was owing to the overactive Wnt/β-catenin pathway, we isolated RNA from mouse colonic tissues subjected to AOM/DSS treatment. We also isolated RNA from xenografted tumors derived from HT29NHE8WT and HT29NHE8KO cells. Real-time PCR detected a significant increase in CTNNB1 and c-Myc gene expression in AOM/DSS-treated NHE8KO colon tissues, and also in HT29NHE8KO cell xenografted tumors. As shown in Figure 7A, the expression of CTNNB1 was increased from 1.00 ± 0.08 in AOM/DSS-treated NHE8WT mice to 1.23 ± 0.08 in AOM/DSS-treated NHE8KO mice (n = 4; P = .004). The expression of c-Myc was increased from 1.05 ± 0.35 in AOM/DSS-treated NHE8WT mice to 2.15 ± 0.25 in AOM/DSS-treated NHE8KO mice (n = 4; P = .001). A similar pattern also was observed in xenografted tumors. As indicated in Figure 7B, the expression of CTNNB1 was increased from 1.06 ± 0.36 in HT29NHE8WT tumors to 1.61 ± 0.54 in HT29NHE8KO tumors (n = 7; P = .021). The expression of c-Myc was increased from 1.00 ± 0.09 in HT29NHE8WT tumors to 1.68 ± 0.44 in HT29NHE8KO tumors (n = 4; P = .012). Furthermore, β-catenin antibody was used to detect β-catenin expression on tissues from AOM/DSS mice. As shown in Figure 7C, tumors from both NHE8KO and NHE8WT mice had evidence of cytosolic/nuclear translocation of β-catenin, but more and stronger β-catenin translocation was seen in NHE8KO tumors. Western blot also detected a dramatic increase of β-catenin protein abundancy in AOM/DSS-treated NHE8KO mice compared with that in AOM/DSS-treated NHE8WT mice (0.10 ± 0.7 in NHE8WT vs 0.80 ± 0.45 in NHE8KO, n = 3; P = .026).
Figure 7.

CTNNB1 and c-Myc expression detection. Total RNAs were purified from AOM/DSS colonic tissues and xenografted tumors. Real-time PCR was used to detect CTNNB1 and c-Myc expression. For ß-catenin immunohistochemical staining, tissue sections from AOM/DSS mice were used to react with ß-catenin antibody. (A) CTNNB1 and c-Myc expression in AOM/DSS-treated NHE8WT (WT) and NHE8KO (KO) mice. Results are means ± SD from 8 mice (4 mice/group). T-Test was used to examine the statistical significance. *P < .0004 for NHE8WT mice (WT) vs NHE8KO mice (KO). (B) CTNNB1 and c-Myc expression in xenografted tumors derived from HT29NHE8WT and HT29NHE8KO cells. Results are means ± SD from 4–7 tumors. T-Test was used to examine the statistical significance. *P < .02 for HT29NHE8WT cells (HT29) vs HT29NHE8KO cells (HT29-KO). (C) β-catenin detection in AOM/DSS-induced tumors. Tissues from distal colons were fixed and sectioned. An antibody specific against ß-catenin was used to detect ß-catenin expression and localization according to the procedure described in the Materials and Methods section. Left panels: Representative image from NHE8WT mice (top) and NHE8KO mice (bottom). In normal tissue, ß-catenin is located near the plasma membrane. In tumor tissue, ß-catenin is translocated inside the cells and/or in the nuclei. Right: Result of Western blot detection on β-catenin protein expression in AOM/DSS-treated mice. Results are means ± SD from 6 mice (3 mice/group). T-Test was used to examine the statistical significance. *P < .05 for AOM/DSS-treated NHE8WT mice (WT) vs AOM/DSS-treated NHE8KO mice (KO).
Discussion
Although NHE8 is one of the apically expressed NHE isoforms in the intestine, the role of NHE8 is more than a mere Na+/H+ exchanger. Our previous studies have shown that, in mice, loss of NHE8 expression in the intestine resulted in reduced mucus production, altered gut bacterial composition, and enhanced expression of inflammatory cytokines.11, 12, 13 We also showed that the expression of NHE8 was reduced dramatically in both human UC and colitis animal models.12, 21, 22 Because intestinal chronic inflammation has been linked to colorectal cancer development, we wondered whether NHE8 could be protective against colorectal cancer development. First, we analyzed NHE8 expression in human colorectal tumor tissues. The expression of NHE8 was barely detectable in human colorectal cancer tissues, whereas abundant NHE8 protein was detected in normal human colorectal tissues. This observation was supported by other observations. In one study using 11 human CRC samples, 4 samples had no NHE8 protein detected, 3 samples had a low NHE8 protein level, and 3 samples had a medium NHE8 protein level (www.proteinatlas.org). In another study, NHE8 gene mutations were discovered in human CRCs.27 Thus, the reduced NHE8 protein expression in human CRCs likely was owing to altered NHE8 gene expression. By using an AOM/DSS colon cancer mouse model, we then tested the hypothesis that loss of NHE8 contributes to tumor development in the colon. As expected, the tumor incident was 9 times higher in AOM/DSS-treated NHE8KO mice compared with AOM/DSS-treated NHE8WT mice. A higher number and larger-sized tumors also were detected in AOM/DSS-treated NHE8KO mice. These observations suggested that NHE8 indeed plays a protective role in tumor development in the intestine. It also is interesting to note that the tumor incident in NHE8WT mice was lower than reported by others using the same mouse strain. This difference likely was owing to the difference in DSS concentration (2% vs 4%), in DSS treatment duration (5 vs 7 days), and in genders (males vs females).28, 29, 30
We previously reported that loss of NHE8 resulted in increased intestinal proliferation in mice.13 To further study the role of NHE8 in cell proliferation, we established a HT29NHE8KO cell line and compared colony formation potential between HT29NHE8WT cells and HT29NHE8KO cells. Our results showed a 5.2-fold higher number of colony formation units in HT29NHE8KO cells compared with HT29NHE8WT cells. In xenografted NSG mice, larger tumors (4.1-fold increase in tumor size and 3.1-fold increase in tumor mass) were observed in injection sites with HT29NHE8KO cells compared with those with HT29NHE8WT cells. These observations suggest that NHE8 indeed plays an important role in regulating cell proliferation/differentiation.
One possible mechanism behind the larger tumor size and higher incidence of tumors in the absence of NHE8 expression may be through NHE8 modulating Lgr5 expression or activity. Lgr5, a leucine-rich, repeat-containing, G-protein–coupled receptor, is a member of the Wnt signaling pathway. It acts as a receptor for R-spondins, a family of Wnt pathway agonists. Under normal physiological conditions, the expression of Lgr5 is restricted to certain tissue types, such as the crypt base of the intestine, the nascent nephrons in the kidney, the isthmus of the stomach, the cochlea of the ear, and the hair follicle.31, 32, 33, 34 Lgr5 is a well-known stem cell marker in these tissues and it is involved in tissue morphogenesis and cell adhesion. Overexpression of Lgr5 has been shown in intestinal adenomas and in colorectal cancer tissues, and cells with overexpression of Lgr5 act as cancer stem cells to promote tumor growth in colorectal cancer tissues.35, 36, 37, 38, 39, 40, 41
To understand if the fast cell growth in the absence of NHE8 expression is owing to altered Lgr5 expression, we first sought to confirm that NHE8 is expressed in the colonic crypts and in colonic stem cells, and then compare colonic Lgr5 expression between NHE8KO and NHE8WT mice. Immunohistochemical staining detected NHE8 protein in the crypt base, and PCR confirmed that NHE8 mRNA is expressed in Lgr5 stem cells and that the expression level of NHE8 is similar between Lgr5 stem cells and non–stem cells in the crypts. In NHE8KO mice, the expression of Lgr5 was increased by 2.3-fold in the colon, which is consistent with the microarray data analysis. After AOM/DSS treatment, the expression of Lgr5 was increased further by more than 18-fold in AOM/DSS-treated NHE8KO mice compared with AOM/DSS-treated NHE8WT mice. It is worth noting that the increased Lgr5 expression was not owing to the intestinal inflammation; the same pattern also was observed in HT29NHE8KO tumors, which showed a 3.9-fold increase in Lgr5 expression when compared with HT29NHE8WT tumors. Moreover, increased Lgr5 gene expression also was detected in NHE8KO colonoids compared with NHE8WT colonoids. This increased Lgr5 expression also was associated with more proliferating cells in NHE8KO colonoids. These observations suggest that NHE8 function is required to regulate Lgr5 expression in the intestine.
We answered the question of whether the increased Lgr5 expression in the absence of NHE8 expression was the result of increased Lgr5 cells and/or increased Lgr5 expression in stem cells using in situ hybridization experiments. An increased number of Lgr5-positive cells were found in the colonic crypts in NHE8KO mice. Furthermore, a large number of Lgr5-positive cells also were detected in tumors in AOM/DSS-treated NHE8KO mice, indicating a possible role of NHE8 on Lgr5 expression. Therefore, intestinal epithelial hyperproliferation in NHE8KO mice may represent an intrinsic consequence of the previously undescribed NHE8/Lgr5/Wnt axis in the colonic crypts.
Lgr5 is one of the target genes of Wnt signaling, thus we questioned if the Wnt/β-catenin pathway is involved in altered Lgr5 expression when NHE8 expression is abolished. ß-catenin plays a role in cell adhesion and intracellular signaling. Translocation of ß-catenin from the cell membrane to the cytoplasm or nucleus is an early event in colorectal carcinogenesis in human being, ApcMin mice, and AOM-induced colon tumors in rodents.28, 42, 43 β-catenin activation is one of the downstream pathways of Wnt signaling activation. The Wnt signaling pathways are a group of signal transduction cascades made of multiple proteins that pass signals into a cell through cell surface receptors. Activation of the Wnt pathway controls a variety of processes in embryonic development and adult homeostasis.44 We compared the expression of β-catenin and c-Myc in colonic tissues from AOM/DSS-treated mice and in xenografted tumors derived from HT29 cells. Real-time PCR data confirmed that the expression levels of β-catenin and c-Myc indeed were increased both in colonic tissues from AOM/DSS-treated NHE8KO mice and in tumors derived from HT29NHE8KO cells. At the level of β-catenin expression, inductions of 1.23-fold and 1.61-fold were detected in the colon in AOM/DSS-treated NHE8KO mice and in tumors derived from HT29NHE8KO cells, respectively. At the level of c-Myc expression, inductions of 2.15-fold and 1.68-fold were detected in the colon in AOM/DSS NHE8KO mice and in tumors derived from HT29NHE8KO cells, respectively. We further detected β-catenin cellular localization in AOM/DSS-treated mouse colon tissues using a β-catenin–specific antibody. Our results showed stronger cytosolic/nuclear translocation of β-catenin in tumors in AOM/DSS-treated NHE8KO mice than that in wild-type mice. Western blot confirmed the increased β-catenin expression in AOM/DSS-treated NHE8KO mice. These observations suggest that loss of NHE8 expression significantly impairs the Wnt/β-catenin pathway, and the resulting up-regulated β-catenin/Lgr5/c-Myc expression likely contributes to a higher incidence of tumor development in the colon in NHE8KO mice.
NHE8 is a multifunction protein that is reflected by its localization. Unlike NHE3, which is located only at the apical membrane of the intestinal epithelia at the tip of the villi and contributes to epithelial sodium absorption,8, 45 NHE8 protein localization ranges from the apical membrane to the intracellular compartments, depending on the cell type. NHE8 protein can be found at the apical membrane in the intestinal epithelia, and it participates in intestinal sodium absorption at a young age when NHE2 and NHE3 expression is very low in the intestine.5, 10 NHE8 also is expressed in the plasma membrane and the intracellular compartments in goblet cells, and it modulates mucin 2 production in the intestine.11 In the testis, NHE8 is seen in the intracellular compartments in Leydig cells and it regulates testosterone production by modulating Luteinizing hormone receptor function.18 In the current study, we found that NHE8 is expressed in intestinal stem cells and loss of NHE8 expression results in increased Lgr5 expression and cell proliferation in the colonic crypt base as well as in the colon tumor tissues, suggesting a new role of NHE8 in modulating intestinal stem cell function, possibly through its action on regulating the pH environment in the colonic crypt base, or modulating Lgr5-potentiated Wnt signaling pathways in stem cells. These observations warrant a more comprehensive study to uncover the role of NHE8 in intestinal stem cells.
In summary, we showed that NHE8 is expressed in colonic stem cells and loss of NHE8 expression resulted in increased Lgr5 expression in the colonic tissue owing to the enhanced Wnt/β-catenin activation. The increased Lgr5-expressing cells likely contribute to hyperproliferation and high tumor incidence in colitis-associated tumor development in the absence of NHE8 in the colon. This work highlights an important role of NHE8 in regulating Wnt/β-catenin pathway in the colon.
Materials and Methods
Animal Models
NHE8KO was established in our laboratory and was maintained on a Swiss Webster background (Taconic, Rensselaer, NY). Immunodeficient NOD scid gamma (NSG) mice and Lgr5–enhanced green fluorescent protein (EGFP) mice were purchased from JAX (The Jackson Laboratory, Bar Harbor, ME). All animal-related works were approved by the Institutional Animal Care and Use Committee at the University of Arizona.
Cells
HT29, a human colonic epithelial cell line, was obtained from American Type Culture Collection (Manassas, VA), and cultured in Dulbecco's modified Eagle medium (DMEM) containing 10% fetal bovine serum and 1% penicillin-streptomycin. Cells were maintained at 37°C in a 95% air–5% CO2 atmosphere and passaged every 72 hours. All cell culture items were purchased from HyClone (GE Healthcare Life Sciences, Logan, UT).
Colitis-Associated Colon Cancer Model
For the azoxymethane (AOM)/dextran sodium sulfate (DSS) model, we followed a published protocol23 with modifications. Briefly, NHE8 knockout (KO) and NHE8 wild type (WT) male mice (age, 7–8 wk) were injected intraperitoneally with AOM (7.4 mg/kg body weight). Five days after AOM administration, mice were given 2% DSS water for 5 days followed by regular water for 14 days. The DSS treatment was repeated 3 times. After the last DSS treatment, mice were fed with regular water for 28 days before they were killed for further analysis. Mice were weighed/observed every day during DSS treatment. AOM (catalog no. A5486) was purchased from Sigma (St. Louis, MO). DSS (catalog no. NC0048002) was purchased from ThermoFisher Scientific (Waltham, MA).
Creation of NHE8 Knockout Cells
To abolish endogenous NHE8 expression, the clustered regularly interspaced short palindromic repeats and CRISPR-associated protein 9 (CRISPR/Cas9) technology was used to knock out NHE8 expression in HT29 cells. A pool of 3 different guide RNA (gRNA) plasmids, which contain sense sequences recognizing the human SLC9A8 gene (catalog no. sc-417946; Santa Cruz Biotechnology, Inc, Santa Cruz, CA), was transfected into HT29 cells according to the manufacturer’s protocol. Total cell lysates were prepared from transient transfected cells and used for Western blot analysis to evaluate the transfection efficiency. Antibody selection (2.5 μg/mL puromycin) was used to select resistant cells that carry the NHE8 mutation. Single colony selection then was performed on 96-well plates using the series dilution method.
Colony Formation Assay
A colony formation assay was performed according to the protocol of Franken et al.46 Briefly, HT29NHE8WT and HT29NHE8KO were seeded in 12-well tissue culture plates at a density of 1000 cells per well and were cultured for 10 days. Colonies were fixed with 3.7% formaldehyde solution for 5 minutes at room temperature, and then stained with 0.5% crystal violet solution for 30 minutes at room temperature. After removal of the staining solution, wells were rinsed carefully with tap water, air-dried, and observed under regular light.
Xenografting Mouse Model
NSG mice (age, 7 wk) were used for this experiment. The xenografting procedure was performed according to the method of Xue and Shah.47 HT29NHE8WT cells and HT29NHE8KO cells were dispersed with 0.25% trypsin-EDTA solution (ThermoFisher Scientific), and then suspended in phosphate-buffered saline. Cells (1 × 10⁶ in 100 μL/injection site) were injected subcutaneously into the flanks of NSG mice, with HT29NHE8WT cells injected into the left flank and HT29NHE8KO cells injected into the right flank. Four weeks after injection, mice were killed and tumors were harvested for further analysis.
Colon Crypt Isolation and Colonoid Culture
Colonic organoid culture was performed according to published methods.24, 26 The entire colons from 7- to 8-week-old male mice were collected and flushed with ice-cold phosphate-buffered saline. Tissues then were minced and digested in 12.5 mL collagenase/dispase solution (Sigma). The tissue digestion was passed through an 18G needle 10 times and vigorously shaken after adding 10 mL complete DMEM. The mixture then was set on ice for 1 minute before collecting the top solution (∼10 mL). The same procedure was repeated 5 times. The combined supernatant was pelleted, and the cells were suspended in 10 mL 30% Percoll (GE Healthcare, Chicago, IL)/Hank's balanced salt solution and centrifuged. The pellets were suspended in 10 mL DMEM–2% D-sorbitol and centrifuged again. The final pellets were suspended in 10 mL complete DMEM and passed through a 70-μm cell strainer. The filtrates were centrifuged again, and the pellets were resuspended in advanced DMEM/F12 medium (Invitrogen, Carlsbad, CA), mixed with Matrigel (ThermoFisher Scientific), and then seeded on 24-well culture plates. The colonoids were cultured in a conditioned medium containing Wnt3a–R-spondin–noggin that was produced by CRL-3276 cells (American Type Culture Collection). The medium was changed every 2–3 days, and passage was performed every 5–7 days. For isolating Lgr5-EGFP cells, colon tissues were collected from Lgr5-EGFP mice, and the final crypt pellets were incubated in 3 mL dispase solution (0.3 U/mL in Hank's balanced salt solution) at 37°C for 15 minutes. The resulting single-cell solution was passed through a 40-μm cell strainer, and then spun for 5 minutes at 2000g. Cell pellets then were resuspended in a 2 mL fluorescence-activated cell sorter (FACS) buffer and sorted with a FACSAriaIII instrument and analyzed by FACSDiva 8.0.1 software (BD BioSciences, San Jose, CA). The FACS GFP sorting was performed by the flow cytometry facility at the University of Arizona Cancer Center (Tucson, AZ).
RNA Purification and Polymerase Chain Reaction Analysis
RNA was purified from tissue samples and cultured cells using TRIzol reagent (Invitrogen). TaqMan technology was used to determine the expression of target genes using Fast Start Essential DNA Probe Master (Roche Diagnostics, Indianapolis, IN) and gene-specific probes from Invitrogen (Carlsbad, CA). Resulting data were analyzed using the comparative cycle threshold method. TATA-binding protein (TBP) data were used as an endogenous reference to normalize gene expression levels.
Protein Preparation and Western Blot Analysis
Total protein was prepared in a RIPA buffer. For Western blot detection, NHE8 antibody was used in a 1:2000 dilution to detect NHE8 protein,5 β-catenin antiserum (catalog no. ab32572; Abcam, Cambridge, MA) was used in a 1:4000 dilution to detect β-catenin protein, and β-actin antiserum (A5316; Sigma) was used in a 1:5000 dilution to detect β-actin protein. Western detection was performed using the BM Chemiluminescence Western Blot Kit (catalog no. 11 520 709 001; Roche Diagnostics, Indianapolis, IN).
Immunohistochemistry Stain
Colon tissue sections (8-μm thick) were used for immunohistochemical staining. Labeling and detection of NHE8 were performed as previously described.5 For β-catenin staining, tissues were incubated with β-catenin antibody in a 1:400 dilution and then detected using a 3,3′-diaminobenzidine DAB kit (catalog no. SK-4105; Vector Laboratories, Inc, Burlingame, CA). Sections were visualized using the EVOS FL Auto Imaging System (Invitrogen).
In Situ Hybridization
Lgr5 in situ probes were purchased from Advanced Cell Diagnostics, Inc (catalog no. 312171; Newark, CA). Lgr5 in situ hybridization was performed on 8-μm thick colon tissue sections using the RNAscope 2.5 HD detection kit (red) (catalog no. 322360; Advanced Cell Diagnostics). The sections were visualized using the EVOS FL Auto Imaging System.
5-ethynyl-2’-deoxyuridine Label for Cell Proliferation Assay
Colonoids were seeded in an 8-chamber culture plate and were cultured for 5 days. The EdU label was performed using the Click-iT EdU Imaging Kit with Alexa Fluor 594 (catalog no. C10086; Invitrogen) following the manufacturer’s instructions. The labeling result was observed using a FLUOVIEW FV10i confocal microscope (Olympus, Center Valley, PA).
Statistical Analysis
The Student t test was used to compare the values of the experimental data. P values < .05 were considered significant.
Acknowledgments
The authors sincerely thank Trudy Meckler for her editorial help with manuscript preparation.
Footnotes
Author contributions Hua Xu designed the study and experiments, performed the experiments, analyzed data, and drafted the manuscript; Jing Li performed the experiments; Hao Chen analyzed tumor-related data; and Fayez K. Ghishan designed the study and experiments, and supervised the study and the manuscript.
Conflicts of interest The authors disclose no conflicts.
Funding Supported by National Institutes of Health grant R01DK3023890 (PI: FKG/CoPI: HX).
References
- 1.Ghishan F.K., Kiela P.R. Small intestinal ion transport. Curr Opin Gastroenterol. 2011;28:130–134. doi: 10.1097/MOG.0b013e32834e7bc3. [DOI] [PMC free article] [PubMed] [Google Scholar]
- 2.Orlowski J., Grinstein S. Diversity of the mammalian sodium/proton exchanger SLC9 gene family. Pflugers Arch. 2004;447:549–565. doi: 10.1007/s00424-003-1110-3. [DOI] [PubMed] [Google Scholar]
- 3.Zachos N.C., Tse M., Donowitz M. Molecular physiology of intestinal Na+/H+ exchange. Annu Rev Physiol. 2005;67:411–443. doi: 10.1146/annurev.physiol.67.031103.153004. [DOI] [PubMed] [Google Scholar]
- 4.Xu H., Chen H., Dong J., Lynch R., Ghishan F.K. Gastrointestinal distribution and kinetic characterization of the sodium-hydrogen exchanger isoform 8 (NHE8) Cell Physiol Biochem. 2008;21:109–116. doi: 10.1159/000113752. [DOI] [PubMed] [Google Scholar]
- 5.Xu H., Chen R., Ghishan F.K. Subcloning, localization, and expression of the rat intestinal sodium-hydrogen exchanger isoform 8. Am J Physiol Gastrointest Liver Physiol. 2005;289:G36–G41. doi: 10.1152/ajpgi.00552.2004. [DOI] [PubMed] [Google Scholar]
- 6.Fliegel L. The Na+/H+ exchanger isoform 1. Int J Biochem Cell Biol. 2005;37:33–37. doi: 10.1016/j.biocel.2004.02.006. [DOI] [PubMed] [Google Scholar]
- 7.Schultheis P.J., Clarke L.L., Meneton P., Harline M., Boivin G.P., Stemmermann G., Duffy J.J., Doetschman T., Miller M.L., Shull G.E. Targeted disruption of the murine Na+/H+ exchanger isoform 2 gene causes reduced viability of gastric parietal cells and loss of net acid secretion. J Clin Invest. 1998;101:1243–1253. doi: 10.1172/JCI1249. [DOI] [PMC free article] [PubMed] [Google Scholar]
- 8.Schultheis P.J., Clarke L.L., Meneton P., Miller M.L., Soleimani M., Gawenis L.R., Riddle T.M., Duffy J.J., Doetschman T., Wang T., Giebisch G., Aronson P.S., Lorenz J.N., Shull G.E. Renal and intestinal absorptive defects in mice lacking the NHE3 Na+/H+ exchanger. Nat Genet. 1998;19:282–285. doi: 10.1038/969. [DOI] [PubMed] [Google Scholar]
- 9.Ledoussal C., Woo A.L., Miller M.L., Shull G.E. Loss of the NHE2 Na(+)/H(+) exchanger has no apparent effect on diarrheal state of NHE3-deficient mice. Am J Physiol Gastrointest Liver Physiol. 2001;281:G1385–G1396. doi: 10.1152/ajpgi.2001.281.6.G1385. [DOI] [PubMed] [Google Scholar]
- 10.Xu H., Li J., Chen R., Zhang B., Wang C., King N., Chen H., Ghishan F.K. NHE2X3 DKO mice exhibit gender-specific NHE8 compensation. Am J Physiol Gastrointest Liver Physiol. 2011;300:G647–G653. doi: 10.1152/ajpgi.00546.2010. [DOI] [PMC free article] [PubMed] [Google Scholar]
- 11.Xu H., Zhang B., Li J., Wang C., Chen H., Ghishan F.K. Impaired mucin synthesis and bicarbonate secretion in the colon of NHE8 knockout mice. Am J Physiol Gastrointest Liver Physiol. 2012;303:G335–G343. doi: 10.1152/ajpgi.00146.2012. [DOI] [PMC free article] [PubMed] [Google Scholar]
- 12.Liu C., Xu H., Zhang B., Johansson M.E., Li J., Hansson G.C., Ghishan F.K. NHE8 plays an important role in mucosal protection via its effect on bacterial adhesion. Am J Physiol Cell Physiol. 2013;305:C121–C128. doi: 10.1152/ajpcell.00101.2013. [DOI] [PMC free article] [PubMed] [Google Scholar]
- 13.Wang A., Li J., Zhao Y., Johansson M.E., Xu H., Ghishan F.K. Loss of NHE8 expression impairs intestinal mucosal integrity. Am J Physiol Gastrointest Liver Physiol. 2015;309:G855–G864. doi: 10.1152/ajpgi.00278.2015. [DOI] [PMC free article] [PubMed] [Google Scholar]
- 14.Pirojsakul K., Gattineni J., Dwarakanath V., Baum M. Renal NHE expression and activity in neonatal NHE3- and NHE8-null mice. Am J Physiol Renal Physiol. 2015;308:F31–F38. doi: 10.1152/ajprenal.00492.2014. [DOI] [PMC free article] [PubMed] [Google Scholar]
- 15.Xu H., Zhao Y., Li J., Wang M., Lian F., Gao M., Ghishan F.K. Loss of NHE8 expression impairs ocular surface function in mice. Am J Physiol Cell Physiol. 2015;308:C79–C87. doi: 10.1152/ajpcell.00296.2014. [DOI] [PMC free article] [PubMed] [Google Scholar]
- 16.Xia C.H., Liu H., Cheung D., Tang F., Chang B., Li M., Gong X. NHE8 is essential for RPE cell polarity and photoreceptor survival. Sci Rep. 2015;5:9358. doi: 10.1038/srep09358. [DOI] [PMC free article] [PubMed] [Google Scholar]
- 17.Jadeja S., Barnard A.R., McKie L., Cross S.H., White J.K., Sanger Mouse Genetics Project. Robertson M., Budd P.S., MacLaren R.E., Jackson I.J. Mouse slc9a8 mutants exhibit retinal defects due to retinal pigmented epithelium dysfunction. Invest Ophthalmol Vis Sci. 2015;56:3015–3026. doi: 10.1167/iovs.14-15735. [DOI] [PMC free article] [PubMed] [Google Scholar]
- 18.Xu H., Chen H., Li J., Zhao Y., Ghishan F.K. Disruption of NHE8 expression impairs Leydig cell function in the testes. Am J Physiol Cell Physiol. 2015;308:C330–C338. doi: 10.1152/ajpcell.00289.2014. [DOI] [PMC free article] [PubMed] [Google Scholar]
- 19.Pastorelli L., De Salvo C., Mercado J.R., Vecchi M., Pizarro T.T. Central role of the gut epithelial barrier in the pathogenesis of chronic intestinal inflammation: lessons learned from animal models and human genetics. Front Immunol. 2013;4:280. doi: 10.3389/fimmu.2013.00280. [DOI] [PMC free article] [PubMed] [Google Scholar]
- 20.Ferlay J., Shin H.R., Bray F., Forman D., Mathers C., Parkin D.M. Estimates of worldwide burden of cancer in 2008: GLOBOCAN 2008. Int J Cancer. 2010;127:2893–2917. doi: 10.1002/ijc.25516. [DOI] [PubMed] [Google Scholar]
- 21.Xu H., Chen H., Dong J., Li J., Chen R., Uno J.K., Ghishan F.K. Tumor necrosis factor-{alpha} downregulates intestinal NHE8 expression by reducing basal promoter activity. Am J Physiol Cell Physiol. 2009;296:C489–C497. doi: 10.1152/ajpcell.00482.2008. [DOI] [PMC free article] [PubMed] [Google Scholar]
- 22.Li X., Cai L., Xu H., Geng C., Lu J., Tao L., Sun D., Ghishan F.K., Wang C. Somatostatin regulates NHE8 protein expression via the ERK1/2 MAPK pathway in DSS-induced colitis mice. Am J Physiol Gastrointest Liver Physiol. 2016;311:G954–G963. doi: 10.1152/ajpgi.00239.2016. [DOI] [PMC free article] [PubMed] [Google Scholar]
- 23.De Robertis M., Massi E., Poeta M.L., Carotti S., Morini S., Cecchetelli L., Signori E., Fazio V.M. The AOM/DSS murine model for the study of colon carcinogenesis: from pathways to diagnosis and therapy studies. J Carcinog. 2011;10:9. doi: 10.4103/1477-3163.78279. [DOI] [PMC free article] [PubMed] [Google Scholar]
- 24.Sato T., Stange D.E., Ferrante M., Vries R.G., Van Es J.H., Van den Brink S., Van Houdt W.J., Pronk A., Van Gorp J., Siersema P.D., Clevers H. Long-term expansion of epithelial organoids from human colon, adenoma, adenocarcinoma, and Barrett's epithelium. Gastroenterology. 2011;141:1762–1772. doi: 10.1053/j.gastro.2011.07.050. [DOI] [PubMed] [Google Scholar]
- 25.Sato T., Vries R.G., Snippert H.J., van de Wetering M., Barker N., Stange D.E., van Es J.H., Abo A., Kujala P., Peters P.J., Clevers H. Single Lgr5 stem cells build crypt-villus structures in vitro without a mesenchymal niche. Nature. 2009;459:262–265. doi: 10.1038/nature07935. [DOI] [PubMed] [Google Scholar]
- 26.Miyoshi H., Stappenbeck T.S. In vitro expansion and genetic modification of gastrointestinal stem cells in spheroid culture. Nat Protoc. 2013;8:2471–2482. doi: 10.1038/nprot.2013.153. [DOI] [PMC free article] [PubMed] [Google Scholar]
- 27.Kondelin J., Gylfe A.E., Lundgren S., Tanskanen T., Hamberg J., Aavikko M., Palin K., Ristolainen H., Katainen R., Kaasinen E., Taipale M., Taipale J., Renkonen-Sinisalo L., Jarvinen H., Bohm J., Mecklin J.P., Vahteristo P., Tuupanen S., Aaltonen L.A., Pitkanen E. Comprehensive evaluation of protein coding mononucleotide microsatellites in microsatellite-unstable colorectal cancer. Cancer Res. 2017;77:4078–4088. doi: 10.1158/0008-5472.CAN-17-0682. [DOI] [PubMed] [Google Scholar]
- 28.Cooper H.S., Murthy S., Kido K., Yoshitake H., Flanigan A. Dysplasia and cancer in the dextran sulfate sodium mouse colitis model. Relevance to colitis-associated neoplasia in the human: a study of histopathology, B-catenin and p53 expression and the role of inflammation. Carcinogenesis. 2000;21:757–768. doi: 10.1093/carcin/21.4.757. [DOI] [PubMed] [Google Scholar]
- 29.Clapper M.L., Gary M.A., Coudry R.A., Litwin S., Chang W.C., Devarajan K., Lubet R.A., Cooper H.S. 5-aminosalicylic acid inhibits colitis-associated colorectal dysplasias in the mouse model of azoxymethane/dextran sulfate sodium-induced colitis. Inflamm Bowel Dis. 2008;14:1341–1347. doi: 10.1002/ibd.20489. [DOI] [PubMed] [Google Scholar]
- 30.Coudry R.A., Gary M., Lubet R.A., Chang W.L., Clapper M.L. Correlation of inhibition of colitis-associated dysplasia by celecoxib with degree of inflammation in the mouse model of DSS-induced colitis. Proc Am Assoc Cancer Res. 2004;64(Suppl):548. [Google Scholar]
- 31.Barker N., Clevers H. Leucine-rich repeat-containing G-protein-coupled receptors as markers of adult stem cells. Gastroenterology. 2010;138:1681–1696. doi: 10.1053/j.gastro.2010.03.002. [DOI] [PubMed] [Google Scholar]
- 32.Barker N., Rookmaaker M.B., Kujala P., Ng A., Leushacke M., Snippert H., van de Wetering M., Tan S., Van Es J.H., Huch M., Poulsom R., Verhaar M.C., Peters P.J., Clevers H. Lgr5(+ve) stem/progenitor cells contribute to nephron formation during kidney development. Cell Rep. 2012;2:540–552. doi: 10.1016/j.celrep.2012.08.018. [DOI] [PubMed] [Google Scholar]
- 33.Ruffner H., Sprunger J., Charlat O., Leighton-Davies J., Grosshans B., Salathe A., Zietzling S., Beck V., Therier M., Isken A., Xie Y., Zhang Y., Hao H., Shi X., Liu D., Song Q., Clay I., Hintzen G., Tchorz J., Bouchez L.C., Michaud G., Finan P., Myer V.E., Bouwmeester T., Porter J., Hild M., Bassilana F., Parker C.N., Cong F. R-spondin potentiates Wnt/beta-catenin signaling through orphan receptors LGR4 and LGR5. PLoS One. 2012;7:e40976. doi: 10.1371/journal.pone.0040976. [DOI] [PMC free article] [PubMed] [Google Scholar]
- 34.Haegebarth A., Clevers H. Wnt signaling, lgr5, and stem cells in the intestine and skin. Am J Pathol. 2009;174:715–721. doi: 10.2353/ajpath.2009.080758. [DOI] [PMC free article] [PubMed] [Google Scholar]
- 35.Alizadeh-Navaei R., Rafiei A., Abedian-Kenari S., Asgarian-Omran H., Valadan R., Hedayatizadeh-Omran A. Comparison of leucine-rich repeat-containing G protein-coupled receptor 5 expression in different cancer and normal cell lines. Biomed Rep. 2016;5:130–132. doi: 10.3892/br.2016.684. [DOI] [PMC free article] [PubMed] [Google Scholar]
- 36.Barker N., van Es J.H., Kuipers J., Kujala P., van den Born M., Cozijnsen M., Haegebarth A., Korving J., Begthel H., Peters P.J., Clevers H. Identification of stem cells in small intestine and colon by marker gene Lgr5. Nature. 2007;449:1003–1007. doi: 10.1038/nature06196. [DOI] [PubMed] [Google Scholar]
- 37.Barker N., Ridgway R.A., van Es J.H., van de Wetering M., Begthel H., van den Born M., Danenberg E., Clarke A.R., Sansom O.J., Clevers H. Crypt stem cells as the cells-of-origin of intestinal cancer. Nature. 2009;457:608–611. doi: 10.1038/nature07602. [DOI] [PubMed] [Google Scholar]
- 38.Hirsch D., Barker N., McNeil N., Hu Y., Camps J., McKinnon K., Clevers H., Ried T., Gaiser T. LGR5 positivity defines stem-like cells in colorectal cancer. Carcinogenesis. 2014;35:849–858. doi: 10.1093/carcin/bgt377. [DOI] [PMC free article] [PubMed] [Google Scholar]
- 39.Kemper K., Prasetyanti P.R., De Lau W., Rodermond H., Clevers H., Medema J.P. Monoclonal antibodies against Lgr5 identify human colorectal cancer stem cells. Stem Cell. 2012;30:2378–2386. doi: 10.1002/stem.1233. [DOI] [PubMed] [Google Scholar]
- 40.Krausova M., Korinek V. Wnt signaling in adult intestinal stem cells and cancer. Cell Signal. 2014;26:570–579. doi: 10.1016/j.cellsig.2013.11.032. [DOI] [PubMed] [Google Scholar]
- 41.Takeda K., Kinoshita I., Shimizu Y., Matsuno Y., Shichinohe T., Dosaka-Akita H. Expression of LGR5, an intestinal stem cell marker, during each stage of colorectal tumorigenesis. Anticancer Res. 2011;31:263–270. [PubMed] [Google Scholar]
- 42.Inomata M., Ochiai A., Akimoto S., Kitano S., Hirohashi S. Alteration of beta-catenin expression in colonic epithelial cells of familial adenomatous polyposis patients. Cancer Res. 1996;56:2213–2217. [PubMed] [Google Scholar]
- 43.Takahashi M., Fukuda K., Sugimura T., Wakabayashi K. Beta-catenin is frequently mutated and demonstrates altered cellular location in azoxymethane-induced rat colon tumors. Cancer Res. 1998;58:42–46. [PubMed] [Google Scholar]
- 44.Logan C.Y., Nusse R. The Wnt signaling pathway in development and disease. Annu Rev Cell Dev Biol. 2004;20:781–810. doi: 10.1146/annurev.cellbio.20.010403.113126. [DOI] [PubMed] [Google Scholar]
- 45.Collins J.F., Xu H., Kiela P.R., Zeng J., Ghishan F.K. Functional and molecular characterization of NHE3 expression during ontogeny in rat jejunal epithelium. Am J Physiol. 1997;273:C1937–C1946. doi: 10.1152/ajpcell.1997.273.6.C1937. [DOI] [PubMed] [Google Scholar]
- 46.Franken N.A., Rodermond H.M., Stap J., Haveman J., van Bree C. Clonogenic assay of cells in vitro. Nat Protoc. 2006;1:2315–2319. doi: 10.1038/nprot.2006.339. [DOI] [PubMed] [Google Scholar]
- 47.Xue X., Shah Y.M. In vitro organoid culture of primary mouse colon tumors. J Vis Exp. 2013;75:e50210. doi: 10.3791/50210. [DOI] [PMC free article] [PubMed] [Google Scholar]