

Abstract
Purpose:
This systematic review evaluates the relationship between resistance training and metabolic function in youth.
Methods:
PubMed, Embase, Cochrane Library, Web of Science, CINAHL, and ClinicalTrials.gov were searched for articles that: (1) studied children; (2) included resistance training; (3) were randomized interventions; and (4) reported markers of metabolic function. The selected studies were analyzed using the Cochrane Risk-of-Bias Tool.
Results:
Thirteen articles met inclusion criteria. Mean age ranged from 12.2–16.9 years, but most were limited to high school (N=11) and overweight/obese (N=12). Sample sizes (N= 22–304), session duration (40–60min), and intervention length (8–52 wks) varied. Exercise frequency was typically 2–3 d/wk. Resistance training was metabolically beneficial compared to control or resistance plus aerobic training in 5 studies overall and 3 out of the 4 studies with the fewest threats to bias (P≤ 0.05); each was accompanied by beneficial changes in body composition, but only one study adjusted for change in body composition.
Conclusions:
Limited evidence suggests that resistance training may positively affect metabolic parameters in youth. Well-controlled resistance training interventions of varying doses are needed to definitively determine whether resistance training can mitigate metabolic dysfunction in youth and whether training benefits on metabolic parameters are independent of body composition changes.
Keywords: metabolism, body composition, exercise, physical activity, resistance training, strength training
Introduction
Childhood obesity rates in the United States and elsewhere remain at all-time highs. Despite difficulty in reaching consensus on the definition and cut points for insulin resistance (IR) and metabolic dysfunction in children, overweight and obesity have been clearly associated with metabolic dysfunction in children across the globe (38). Excess adiposity in childhood clearly tracks with adiposity in adulthood (29, 32) and may track with the development of metabolic syndrome and other significant cardiometabolic outcomes in adulthood even when metabolic dysfunction is absent during childhood (28, 36).
Metabolic dysfunction has been proposed as a link between obesity and chronic conditions such as cardiovascular disease and several cancers (4, 27). Early onset and persistence of metabolic dysfunction threatens to increase the prevalence of chronic diseases and accompanying morbidity and mortality earlier in life. Many studies and public health programs have targeted weight management as a means to reduce obesity and thereby mitigate its effects on chronic disease. Unfortunately, these efforts have not had long-term success, as evidenced by weight regain across trials (5) and no real change in the prevalence of obesity (26).
In the absence of sustained weight loss it is prudent to identify a means of mitigating the consequences of overweight/obesity, independent of weight loss. Aerobic and circuit training interventions have been more commonly tested for this purpose and have demonstrated mixed results in terms of improving metabolic function in overweight and obese youth (20, 39). More so than aerobic exercise, resistance training increases muscle mass, and thereby may provide a more effective mechanism for improved glucose disposal (14, 17, 25) and potentially other cardiometabolic outcomes, independent of weight loss (14, 17, 25). In cross-sectional studies, relative muscle mass has been inversely associated with several cardiometabolic markers [blood pressure (BP), C-reactive protein (CRP), total cholesterol (TC), high-density lipoprotein cholesterol (HDL), low-density lipoprotein cholesterol (LDL), triglycerides (TG), and insulin] among youth aged 8–20yrs (NHANES 1999–2004) (19). Resistance training may be more appealing to those who experience difficulty participating in aerobic training, particularly the obese (30, 31).
The purpose of this systematic review was to determine if resistance training improves metabolic function among youth, including metabolic syndrome, insulin resistance, or any component of their definitions (i.e. levels of insulin, glucose, HbA1C, lipids, blood pressure, waist circumference). Although a meta-analysis on physical activity and insulin resistance was published in 2014 (12), the last systematic reviews inclusive of metabolic syndrome, its components, and/or insulin resistance examined studies that were published prior to 2010, and therefore did not include the majority of the articles identified herein (7, 15), in particular the largest randomized controlled trial to date (N=304)(35). These prior reviews had limited data on the effects of resistance training alone from randomized controlled trials, as they included various study designs, and were dominated by aerobic and mixed mode training, making it difficult to tease out the effects of resistance training. In this systematic review, we examined the effects of resistance training specifically, as well as compared resistance training to aerobic training across studies in which both groups were included. Therefore, this systematic review updates previous reviews with new robust trials, isolates the contribution of resistance training, and includes studies that assessed metabolic syndrome and its individual components, in addition to insulin resistance.
Methods
This systematic review has been registered with the International Prospective Register of Systematic Reviews, PROSPERO (registration number: CRD42015024433; http://www.crd.york.ac.uk/PROSPERO).
Article selection
A literature review was planned and performed using methods specified in the “PRISMA statement for reporting systematic reviews and meta-analyses” (23). Both controlled vocabulary terms (e.g., MeSH) and key words were utilized to search the following databases for studies that included data on the effect of resistance training interventions on metabolic function in children and adolescents ≤18 years of age: Ovid/MEDLINE (1946–2015); Elsevier/Embase (1947–2015);Wiley/Cochrane Library (1898 −2015); Thomson-Reuters/Web of Science (1898–2015); EBSCO/CINAHL (1937–2015); and ClinicalTrials.gov (1997–2015). Literature searches were completed on January 5, 2016. The complete Ovid/MEDLINE search strategy, analogous to the other database searches, is available in the Electronic Supplementary Material. Reference lists of, and citations to, the articles ultimately selected from the database searches were also screened.
Inclusion criteria were (1) study focused on children, adolescents, and young adults ≤18 years of age; (2) interventions included, but were not necessarily limited to resistance training of any kind (e.g. calisthenics, bands, machine weights, circuit training, and free weights); (3) study designs were randomized trials with at least two groups, either control and intervention groups or ≥2 interventions; (4) parameters measured were metabolic syndrome score, individual components of metabolic syndrome, or any measure of insulin resistance. Criteria for exclusion were (1) studied adults only; (2) subjects were individuals with Type 1 diabetes mellitus (DM) only; (3) interventions were diet modification, aerobic, or a combination of aerobic and resistance exercise only; (4) no markers of metabolic function such as glucose (GLU), TG, HDL, waist circumference (WC), BP, insulin levels, HbA1C levels were measured. No publication date or language limits were applied. Identified reviews and meta-analyses were not included in this synthesis, but their reference lists were included in the citation tracking component of study identification.
Two independent reviewers initially screened titles and abstracts of retrieved references for relevance (JWB, MHR for MEDLINE; RB, MHR for other databases). In case of disagreements, a third reviewer (RB for MEDLINE, JWB for other databases) determined if it advanced to the next stage. The full texts of the articles selected were then more thoroughly analyzed by two independent reviewers to see if they met full inclusion criteria, with a third reviewer determining final selections if disagreements occurred. Letters, case studies, review articles, case-control studies, resistance training (RT) interventions without a comparison group, and cohort studies were excluded. Publications stemming from the same study were linked to avoid including data from the same study more than once.
Two authors independently read the final selection of articles and completed an assessment bias using the Cochrane criteria (1). Disagreements regarding bias assessment were resolved by discussion and consensus (JWB, MHR, RB). Similarly, data were extracted independently by two reviewers and disagreements resolved by discussion with the third reviewer. Standard extraction forms developed and pilot-tested for this specific systematic review were used. For each study the following information was extracted: study design, intervention (frequency, intensity, duration, type), number of participants, mean age, sex, and difference in means for outcomes related to metabolic syndrome, including individual components such as fasting glucose, HDL cholesterol, triglycerides, blood pressure, waist circumference, and insulin resistance related markers. If body composition and BMI data were available within the articles meeting inclusion criteria for the primary outcomes, they were also extracted. Comparisons between intervention and control or between multiple intervention groups were extracted, as available, with a focus on determining the effect of RT compared to other individual or combination interventions.
Results
We found 3655 studies through database searches. Citation tracking of the included articles and selected reviews revealed an additional 52 articles. Of the 2620 articles that remained after duplicates were removed, 2477 were excluded because of irrelevance to the topic (Figure 1). Strict inclusion criteria, as outlined above, were applied to the full text of 143 articles. Of these, 13 met the full set of criteria. All of the studies meeting our selection criteria for metabolic outcomes also reported anthropometric or body composition outcomes.
Figure 1:
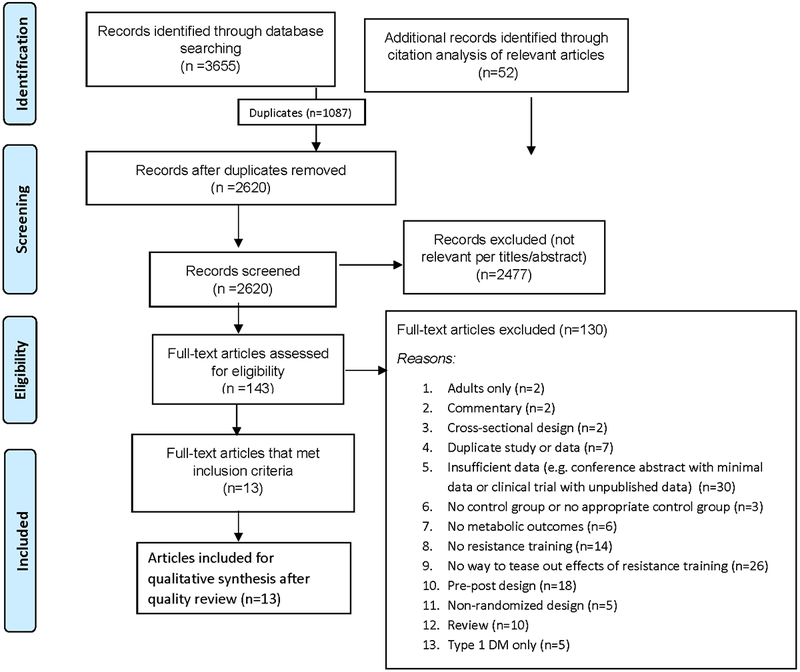
Flowchart of the process of literature search and extraction of studies meeting the inclusion criteria
Sources of Bias
Six specific sources of bias were examined and rated for each study (random sequence generation, allocation concealment, blinding of participants and personnel, blinding of outcome assessment, selective reporting), with an additional category entitled “other sources” of bias according to the Cochrane guidelines (Table 1) (1). Physical activity interventions require that instructional staff and participants are aware of group assignment, introducing increased risk of performance bias due to lack of blinding of both participants and personnel across all of the studies reviewed. Eight of the 13 randomized controlled trials were rated as having limited risk of bias due to positive ratings for at least three of the five remaining potential sources of bias. Within these studies there were no “high risk of bias” ratings, but rather lack of detail in the manuscript text for some categories making potential risks of bias unclear. Across studies, the categories most often lacking detailed information were random sequence generation, allocation concealment, and blinding of outcome assessment, potentially indicating selection bias and detection bias, respectively. The vast majority of studies presented intent-to-treat analyses, provided specific reasons for dropout that were unlikely to influence outcomes, had equal dropout rates across groups, or did not experience dropout and were, therefore, rated as having low risk of bias due to attrition. Reporting bias was not an issue across the studies reviewed. Several studies were conducted in a clinical setting where physicians addressed individual issues throughout the study (2, 8, 11). This practice was essential for clinical care, but it was difficult to determine if it introduced other potential forms of bias that were not addressed without seeing data such as the distribution of additional clinical advice or therapies across groups.
Table 1.
Bias assessment of resistance training studies with metabolic outcomes among children and adolescents using the Cochrane Collaboration criteria.
| Source | Random sequence generation |
Allocation concealment |
Blinding of participants & personnel |
Blinding of outcome assessment | Incomplete outcome data | Selective Reporting | Other bias |
|---|---|---|---|---|---|---|---|
| Ackel-D’Elia, 2014a(2) | ? | ? | − | ? | ? | + | ? |
| Benson, 2008(6) | + | + | − | + | + | + | + |
| Damaso, 2014a(8) | ? | ? | − | + | + | + | ? |
| Davis, 2009(9) | ? | ? | − | ? | + | + | + |
| Davis, 2009(10) | ? | ? | − | ? | + | + | + |
| de Piano, 2012a(11) | ? | ? | − | ? | + | + | ? |
| Hasson, 2012b(16) | ? | ? | − | ? | + | + | + |
| Kelly, 2015(18) | ? | + | − | ? | + | + | + |
| Lee S, 2012(21) | + | + | − | ? | + | + | + |
| Lee S, 2013(22) | + | + | − | ? | + | + | + |
| Shaibi, 2006(33) | ? | ? | − | + | + | + | + |
| Sigal 2014(3, 35) | + | + | − | + | + | + | + |
| Suh, 2011(37) | + | ? | − | ? | + | + | + |
(+) = low risk of bias; (–) = high risk of bias; (?) = unclear risk of bias
The Inter-disciplinary Obesity Program of the Universidade Federal de Sao Paulo-UNIFESP project (GEO) has been conducted annually since 2004;
Latino population overlaps with Davis, Obesity, 2009 article; African American population does not overlap. Each individual study fully design is described in Table 2.
Trial Designs
Of the 13 randomized trials identified (Table 2) 10 included comparisons between resistance training and control, with or without a background dietary component in each arm. The other three randomized studies included combined resistance training plus aerobic training versus aerobic training, and other comparisons. Across trial types, the interventions ranged from 8–52 weeks, and included training sessions typically lasting 40–60 minutes, 2–4 days per week. There appeared to be no attempt to standardize energy expenditure across comparative intervention groups, but rather to equalize duration of training per session in most studies. If the intervention group was resistance training plus aerobic training the time tended to be split equally between the two types of training. Ages across studies ranged from 10.9 – 19 yrs (mean 12.2–16.9 yrs). Although most studies were limited to high school aged adolescents (2, 8–11, 16, 18, 33, 35), some studies were conducted in middle school aged children, (6, 37) or included broader age ranges of youth (21, 22). The majority of studies included both males and females, but five studies were limited to a single sex (N=2 female only (10, 22); N=3 male only (18, 21, 33)). The effect of sex on metabolic outcomes was not directly examined in these studies.
Table 2.
Population and intervention characteristics for resistance training studies with metabolic outcomes among children and adolescents.
| Source | Population | Intervention Description | Freq. (d/wk) |
Duration (min/d) |
Intensity (units vary) |
Volume (sets x reps) |
Study Length (Wks) |
% Attendance (Compliance)c |
|---|---|---|---|---|---|---|---|---|
| Ackel-D’ Elia 2014a(2) |
Enrolled N=132 Completers N=72 22 M; 50 F Age: 16.5y mean;15–19y Brazil, Obese |
LPA vs AT vs AT+RT LPA: recreational team sports (soccer, handball, basketball etc.) AT: treadmill or cycle-ergometer RT: Free weights and machines (bench press, leg press, sit-ups, lat pull down, hamstring curls, lower back, military press, calf raise, arm curls, triceps push down) |
3 | LPA: 60min AT: 60min AT+RT: 30min AT; 30min RT |
LPA:NA AT: ventilatory threshold I (±4bpm) AT+RT: 15–20RM; 10–12RM; and 6–8RM |
LPA:NA AT:NA RT:progressed with volume and intensity inversely modified; 3 sets; 1st 2 weeks: 15–20reps, 3 × 6–20 reps thereafter |
24 | UNK Analysis limited to completers. Criteria for completion not described. |
| Benson 2008(6) | Enrolled N=78 Completers N=70 46 M; 32 F Age: 12.2y mean; 10–15 y New Zealand: European(86%), Maori(6%),Pacific (2.6%), Other (5.1%) Rural; Normal weight to obese |
CON vs. RT RT: Progressive resistance training using free weights and ankle weights (bicep screw curl, triceps extension, one arm dumbbell row, one arm dumbbell front raise, bench press, standing leg abduction, standing leg curl, calf raise, squat, abdominal crunches and reverse crunches) |
2 | UNK | RPE of 15–18; approx.. 80% peak strength | 2 × 8 |
8 | 77% Analysis limited to completers. (loading intensity target attained; mean RPE: 15.6) |
| Damaso 2014a(8) | Enrolled N=139 Completers N=116 57 M; 82 F Age: 16.9y mean; 15–19y Brazil; Obese |
AT vs AT+RT AT: treadmill running RT: alternated RT first one day, then AT first the next day. Bench and leg press, sit-ups, lat pull-down, hamstring curls, lower-back, military press, calf raise, arm curls, tricep push downs. UNK equipment. |
3 | AT: 60min RT+AT: 30min AT; 30min RT |
AT: 50–70% ventilatory threshold I RT: % 1 RM UNK. |
AT: NA RT:progressed with volume and intensity inversely modified; 3 sets; 1st 2 weeks: 15–20reps, 3 × 6–20 reps thereafter |
52 | ≥75% Analysis limited to completers. |
| Davis 2009(9) | Enrolled N=68 Completers N=54 28 M; 26 F Age: 15.5y mean; 14–18y USA (Los Angeles, CA); Overweight/ Obese; Latino |
CON vs D vs RT+D D: motivational interviewing, nutrition education classes emphasizing low sugar, high fiber. RT: free weights and machine weights (leg press, bench press, dead lift, lat pull-down, biceps curl, triceps push-down, leg curl, leg extension, calf raises, and shoulder press) |
D: 1 RT: 2 |
D: 90min RT: 60min |
D: NA RT: 62–71% 1RM wks 1–4 74–88% 1RM wks 5–10 92–97% 1RM wks 11–16 |
D: NA RT: Wk 1–4: 1 × 10–15 Wk 5–10: 2 × 3–15 Wk 11–16: 3 × 8–12 |
16 | ≥75% D sessions; ≥88% exercise sessions Analysis limited to completers. |
| Davis 2009(10) | Enrolled N=50 Completers N=41 0 M; 41 F Age: 15.2y mean; 14–18y USA (Los Angeles, CA) Overweight/ Obese Latina |
CON vs D vs RT+D vs RT+AT+D D: culturally tailored motivational interviewing, nutrition education classes emphasizing low sugar, high fiber. RT: free weights and machine weights (leg press, bench press, dead lift, lat pull-down, biceps curl, triceps push-down, leg curl, leg extension, calf raises, and shoulder press) RT+AT: one upper and one lower body exercise paired, performed for 1 min without stopping followed by 2 min of cardio exercise on treadmill, elliptical, or aerobics |
D:1 RT: 2 RT+AT: 2 |
D: 90min RT: 60min RT+AT: 30min RT, 30min AT |
D:NA AT:NA RT: 62–71% 1RM wks 1–4 74–88% 1RM wks 5–10 92–97% 1RM wks 11–16 Personalized progressive resistance as strength improved |
D:NA AT:NA RT: Wk 1–4: 1 × 10–15 Wk 5–10: 2 × 3–15 Wk 11–16: 3 × 8–12 |
16 | UNK Analysis limited to completers. |
| de Piano 2012a(11) | N=58 No attrition reported. 27 M; 31 F Age: 16.5y mean; 15–19y Brazil; Obese Blocked by NAFLD |
AT vs AT+RT blocked by NAFLD status AT: treadmill running RT: alternated RT first one day, then AT first the next day. UNK exercises and equipment, but stated that exercises targeted each of the main muscle groups. All groups had 1xwk dietetic lessons |
3 | AT: 60min AT+RT: 30min AT; 30min RT |
AT: ventilatory threshold I (50–70% of VO2 max) AT+RT: volume and intensity adjusted inversely for RT exercises. % of 1 RM UNK |
AT:NA RT: Introductory period then volume and intensity adjusted inversely, decreasing number of reps to 6–20 for 3 sets |
52 | UNK |
| Hasson 2012(16) | Enrolled N = 126 Completers N=100 39 M; 61 F Age: 15.4y mean; 14–18y USA (Los Angeles, CA); Obese Latino (n=52)b and African American (n=48) |
CON vs D vs RT+D D: motivational interviewing, nutrition education classes emphasizing low sugar, high fiber RT: free weights and machine weights (leg press, bench press, dead lift, lat pull-down, biceps curl, triceps push-down, leg curl, leg extension, calf raises, and shoulder press) |
D: 1 RT: 2 |
D: 90min RT: 60min |
D:NA RT: Wk 1–4: 62–71% baseline 1RM; Wk 5–10: 74–88% baseline 1RM; Wk 11–16: 92–97% baseline 1 RM |
D:NA RT:Wk 1–4: 1 × 10–15 Wk 5–10: 2 × 3–15 Wk 11–16: 3 × 8–12 |
16 | UNK Analysis limited to completers. |
| Kelly 2015(18) | Enrolled =32 Completers N=26 26 M; 0 F Age: 15.4y mean; 14–18y USA, (Los Angeles, CA) Obese Latino |
CON vs RT RT: Compound and isolated upper and lower body exercises. UNK equipment type. |
2 | 60min | wk 1–4 “light to moderate” wk 5–10 “moderate” wk 11–16 “moderate to high” |
wk 1–4: 1 × 10–15 wk 5–10: 2–3 × 13–15 wk 11–16: 3–4 × 8–12 |
16 | 89% Analysis limited to completers. |
| Lee 2012(21) | Enrolled (N=45) Analyzed ITT (N=45)/ Per protocol analysis (N=42) 45 M; 0 F 15.2y AT; 14.6y RT; 14.8y CON mean; 12–18y all USA (Pittsburgh, PA); Obese African American (n=23) and Caucasian (n=22) |
CON vs AT vs RT Weight maintenance diet all groups. AT: treadmill, elliptical, stationary bikes RT: whole body exercises with free weights and machines (leg press, leg extension, leg curl, chest press, lat pulldown, seated row, bicep curl, tricep extension) |
3 | AT: Progressed from 40min to 60min RT: 60min |
AT: 50%of VO2 peak; increasing to 60–75%; RT: 60% of 1RM |
AT:NA RT: Wk 1–4: 1–2 × 8–12 Wk 4–13: 2×8–12- to fatigue |
12 | ≥99% (Session duration AT 57.7 min; RT 59.4min) HR 153.8 bpm & EE 713.9 kcal/session for AT; RT HR & EE not presented) |
| Lee 2013(22) | Enrolled and Analyzed ITT N=44 Per protocol analysis N=36 0 M; 44 F 14.6y AT; 14.8y RT; 15.0y CON mean; 12–18y all USA (Pittsburgh, PA); Obese; African American (n=30) and Caucasian (n=14) |
CON vs AT vs RT Weight maintenance diet all groups. AT: treadmill, eliptical RT: machine weights leg press, leg extension, leg curl, chest press, lat pulldown, seated row, bicep curl, tricep extension |
3 | AT: Progressed from 40min to 60min RT: 60min |
AT: 50%of VO2 peak; increasing to 60–75%; RT: 60% of 1RM |
AT: NA RT: Wk 1–4: 1–2 × 8–12 Wk 4–13: 2×8–12 to fatigue |
12 | ≥95% (Session duration AT 56.0 min; RT 57.0min) HR 153.0 bpm & EE 536.6 kcal/session for AT; RT HR & EE not presented) |
| Shaibi 2006(33) | Enrolled N=28 Completers N=22 22 M; 0 F 15.1y RT; 15.6y CON mean; 14–16y All USA (Los Angeles, CA);Overweight/ Obese Latino |
CON vs RT RT: Progressive RT on free weights and machine weights. One day of compound lower-body exercises and isolated upper-body exercises and another day of compound upper-body exercises and isolated lower-body exercises (leg press, bench press, dead lift, lat pull-down, biceps curl, triceps push-down, leg curl, leg extension, and shoulder press) |
2 | ≤60min | Loads adjusted weekly to maintain adequate resistance within repetition ranges | Wk 1–4: 1 × 10–15 Wk 5–10: 2 × 3–15 Wk 11–16: 3 × 8–12 |
16 | 96%; (Achieved 62–71% 1RM wks 1–4 74–88% 1RM wks 5–10 92–97% 1RM wks 11–16 relative to baseline) |
| Sigal 2014 (3, 35) | Enrolled and Analyzed ITT N=304 Per-protocol analysis N=144 (24.7% withdrawl) 91 M; 213 F 15.6y mean; 14–18y Canada (Ontario) Obese or overweight with additional diabetes or cardiovascular risk factor |
CON vs AT vs RT vs RT+AT All groups received diet counseling at 0, 3, and 6 months AT: treadmill, elliptical, bicycle ergometer RT: machines and free weights (bench press, incline bench press, chest fly, incline chest fly, front lateral pull down, seated row, lateral raise, shoulder shrugs, shoulder press, front raise, dumbbell pullover, tricep press, assisted tricep dips, preacher curl, bicep curl, squat, leg press, leg extension, lying knee extensions, leg curl, lunge, straight leg raise, abdominal crunches, sit-ups) |
4 | AT-progressed to 45min RT progressed to 45min RT+AT progressed to 90min |
AT: 65 to 85% max HR RT: 8RM test used to set loads. |
AT: NA RT: Progressive 2×15 to 3 × 8 at max |
26 | Median: 62% AT; 56%RT; 64% RT+AT NS btw groups. Per protocol analysis: completers with ≥70% adherence |
| Suh 2011 (37) | Enrolled/completers N=30 15 M; 15 F 13.1y mean; UNK range (middle school) Korea; Overweight/Obese |
D vs AT+D vs RT+D D: diet education 2d/wk and daily diet records and weekly review of records by nutritionist AT: jumping rope, walking or running on a treadmill and stationary cycling, gymnastics RT: squats, leg extension, lying leg curls, military press, leg press, lateral pulldowns, bench press, crunch, leg raise, and dead lift |
D: 2 AT:3 RT:3 |
AT: 40min RT: 60min |
AT:60% VO2max month 1; 65% VO2max month 2; 70%VO2max month 3 RT: 60% 1RM |
AT: NA RT: 2–3 × 10–12 |
12 | 100% |
The Inter-discipinary Obesity Program of the Universidade Federal de Sao Paulo-UNIFESP project (GEO) has been conducted annually since 2004.
Latino population overlaps with Davis, Obesity, 2009 article; African American population does not overlap.
Compliance with intervention intensity, in addition to attendance, presented if available.
Age is reported as mean ± SD, when available, or the age range of participants included in the study. ITT, intent to treat; LPA, leisure physical activity; AT, aerobic training group; CON, control group; D, diet group; EE, energy expenditure; HR, heart rate; bpm, beats per minute; RPE, rate of perceived exertion; RT, resistance training group; F, female; M, male; NS, not significant; RPE: rate of perceived exertion; NAFLD, non-alcoholic fatty liver disease; UNK, unknown/not reported in the source document.
The metabolic outcomes reported varied between studies. Not all studies reported each of the components included in the NCEP ATP III score for metabolic syndrome (WC, TG, GLU, BP, HDL) or the score itself (Table 3). The measures of glucose tolerance and insulin sensitivity/resistance varied in terms of participant burden and precision, including: fasting glucose and insulin, oral glucose tolerance test (OGTT), frequently sampled intravenous glucose tolerance test (FSIVGTT) and the hyperinsulinemic euglycemic clamp. Total body composition, if evaluated, was also measured in a variety of ways: dual energy X-ray absorptiometry (DXA), magnetic resonance imaging (MRI), bioelectrical impedance (BIA), air displacement plethysmography (i.e. BODPOD™), skin folds, and hydrostatic weighing. Each variable reported is labeled according to the technique used and the units of measure (Table 3).
Table 3.
Changes in metabolic function and body composition with resistance training interventions.
| Source | Comparisons | Markers of Metabolic Function (Model Adjustments) |
Anthropometry and Body Composition (Model Adjustments) |
|---|---|---|---|
| Ackel-D’ Elia 2014(2) |
AT vs LPA | BP, WC, TG, HDL: NR GLU: − 0.05 vs − 0.09uU/ml; I: − 1.53 vs − 1.43uU/ml; HOMA-IR: − 0.32 vs − 0.33 |
WT: −5.1 vs −0.5kg*; BMI: −1.9 vs −0.2* TBF: − 1.2 vs − 1.0%; − 5.14 vs − 0.5 kgd* LBM: −2.6 vs +0.5kgd* |
| RT+AT vs LPA |
BP, WC, TG, HDL: NR GLU: − 0.01 vs − 0.09uU/ml; I: − 3.63 vs − 1.43uU/ml; HOMA-IR: − 0.78 vs − 0.33 |
WT: −8.1 vs −0.6kg*; BMI: −3.3 vs −0.2* TBF: −6.8 vs −1.0%*; −9.8 vs −1kgd* LBM: +1.7 vs +0.5kgd |
|
| RT+AT vs AT |
BP, WC, TG, HDL: NR GLU: − 0.01 vs − 0.05uU/ml; I: − 3.63 vs − 1.53uU/ml; HOMA-IR: − 0.78 vs − 0.32 |
WT: −8.1 vs −5.1kg*; BMI: −3.3 vs −1.9* TBF: −6.8 vs −1.2%*; −9.8 vs −3kgd* LBM: +1.7 vs −2.6kgd* |
|
|
(No adjustments/covariates listed, comparisons by ANOVA) |
(ANOVA; No adjustments listed) |
||
| Benson 2008(6) | RT vs CON | BP: NR WC: −0.8 vs +0.5cm* logTG: +0.16 vs +0.05 HDL: +0.1 vs −0.1mmol/l GLU:+2.8 vs +2.5mmol/l; logHOMA-IR: +0.1vs +0.24 (Age, gender, and maturation evaluated as covariates; no effects) |
WT: NR; BMI: −0.01 vs +0.4* TBF: −0.3 vs +1.2%*; NR kgc LBM: +1.4 vs +1.0 (FFM)c (Age, gender, and maturation evaluated as covariates; no effects) |
| Damaso 2014(8) | RT+AT vs AT | BP, WC:NR TG:−19.0 vs −27.2mg/dl HDL:+2.4 vs +1.0mg/dl GLU: −0.1 vs −0.0uU/ml; I:−5.5 vs −4.1 uU/ml; HOMA-IR: −1.2 vs −0.9 (No adjustments/covariates listed, comparisons by ANOVA) |
WT:−12.3 vs −8.8kg; BMI: −4.7 vs −3.2 TBF: −9.4 vs −5.3%*; −14.2 vs −8.1kgd* LBM: +1.3 vs +0.1kg (No adjustments/covariates listed, comparisons by ANOVA) |
| Davis 2009(9) | RT+D vs CON | BP, WC, TG, HDL: NR GLU: −2.4 vs −5.0 mg/dl; GLU IAUC: −6.3 vs +23.2nmol/min/l*; I: −3.9 vs −1.0 uU/ml; HOMA-IR: −1.0 vs −0.3 IS: 0.0 vs +0.1 ×10⁻⁴ min−1x uU−1x mL−1 |
WT: −0.3 vs +0.6kg; BMI: 0.0 vs +0.2 TBF: %NR; −1.3 vs −0.1kga LBM: +1.1 vs +1.1kga |
| RT+D vs D | BP, WC, TG, HDL: NR GLU: −2.4 vs −0.8mg/dl; OGTT GLU IAUC: −6.3 vs −19.3nmol/min/l*; I: −3.9 vs −1.8 uU/ml; HOMA-IR: −1.0 vs −0.6 IS: 0.0 vs +0.2 ×10⁻⁴ min−1x uU−1x mL−1 |
WT: −0.3 vs +0.1kg; BMI: 0.0 vs −0.1 TBF: %NR; −1.3 vs −0.1kga LBM: +1.1 vs 0.0kga |
|
|
(ANCOVA; covariates included: age, sex, DXA fat and lean tissue mass.) |
(ANCOVA; covariates included: age and sex for all; dual-energy X-ray absorptiometry (DXA) fat was adjusted for lean, and lean for fat.) |
||
| Davis 2009(10) | RT+D vs CON | BP, WC, TG, HDL: NR GLU:−3.6 vs −3.9mg/dl; OGTT GLU IAUC: −269.1 vs −241.8 nmol/min/l; IS: −0.4 vs −0.03 ×10⁻⁴ min−1x uU−1x mL−1 |
WT: +2.4 vs −0.3; BMI: +1.1 vs −0.05* TBF: %NR; +0.6 vs +0.4kga LBM: +1.4 vs +0.2kga |
| RT+AT+D vs CON |
BP, WC, TG, HDL: NR GLU: −4.3 vs −3.9mg/dl; OGTT GLU IAUC: −277.1 vs −241.8nmol/min/l; IS: +0.1 vs −0.03 ×10⁻⁴ min−1x uU−1x mL−1 |
WT: −0.8 vs −0.3kg; BMI: −0.5 vs −0.5 TBF: %NR; −1.4 vs +0.4kga LBM: +0.8 vs +0.2a |
|
| RT+D vs RT+AT+D | BP, WC, TG, HDL: NR GLU: −3.6 vs – 4.3mg/dl; OGTT GLU IAUC: −269.1 vs −277.1 nmol/min/l; IS: −0.4 vs +0.1 ×10⁻⁴ min−1x uU−1x mL−1 |
WT: +2.4 vs. −0.8kg*; BMI: +1.1 vs −0.5* TBF: %NR; +0.6 vs −1.4kga* LBM: +1.4 vs +0.8kga |
|
| RT+AT+D vs D | BP, WC, TG, HDL: NR GLU −4.3 vs +2.5mg/dl*; OGTT GLU IAUC: −277.1 vs −290.5nmol/min/l; IS: +0.1 vs +0.3 ×10⁻⁴ min−1x uU−1x mL−1 |
WT: +0.3 vs −0.8kg; BMI: +0.3 vs −0.5 TBF: %NR ;−0.1 vs −1.4 kga LBM: +0.1 vs +0.8kga |
|
|
[ANCOVA covariates included Tanner, baseline-dependent variable, and baseline DXA fat and lean mass (only included if significant in the model).] |
[ANCOVA covariates: Tanner, baseline-dependent variable (DEXA fat adjusted for lean, and lean for fat), change in total sugar intake (weight model only), and change in bench press (BMI model only)] |
||
| de Piano 2012(11) | AT+RT vs AT w/o NAFLD |
BP, WC: NR TG:−6.3 vs −31.1mg/dl HDL:+0.9 vs +0.1mg/dl GLU: −3.8 vs −2.1mg/dl; I: −6.0 vs −0.12mU/l*; HOMA-IR: −1.4 vs −0.07* |
WT:−12.0 vs −9.4kg, BMI: −4.7 vs −3.4 TBF: 11.1 vs −7.2%*; −14.1 vs −6.7kgd* LBM: +2.9 vs −2.8kgd* |
| AT+RT vs AT w/NAFLD |
BP, WC: NR TG:−8.3 vs −14.8 mg/dl HDL:−0.2 vs +2.9mg/dl GLU: −5.14 vs +1.15mg/dl*; HOMA-IR: −2.07 vs −1.63 |
WT: −14.5 vs −10.9kg; BMI: −5.4 vs −3.7 TBF: −8.9 vs −6.4%; −15.4 vs −10.2kgd LBM:+1.3 vs −0.6kgd |
|
| [(No adjustments/covariates listed, comparisons by one-way analysis of variance or the Mann–Whitney test(nonparametric variables); | (No adjustments/covariates listed) | ||
| Hasson 2012(16) | RT +D vs CON | African American: BP, WC, TG, HDL: NR GLU: −2.7 vs −2.7mg/dl; I: −2.3 vs 2.2 μU/ml; IS: 0.0 vs −0.4 ×10⁻⁴ min−1x uU−1x mL−1 Latino:BP, WC, TG, HDL: NR GLU: −2.5 vs −5.3mg/dl; I: −4.0 vs −1.0μU/ml; IS: −0.2 vs −0.4 ×10⁻⁴ min−1x uU−1x mL−1 Combined percent change: IS:−6.9% vs −32.3%; DI:−13.7% vs −14.2% |
WT; BMI; TBF, LBMa: NS—data not shown |
| RT +D vs D | African American: BP, WC, TG, HDL: NR GLU: −2.7 vs −2.8mg/dl; I: −2.3 vs −1.3μU/ml; IS: 0.0 vs +0.1 ×10⁻⁴ min−1x uU−1x mL−1 Latino: BP, WC, TG, HDL: NR GLU: −2.5 vs −0.9 mg/dl; I: −4.0 vs −2.6μU/ml; IS: −0.2 vs +0.3 ×10⁻⁴ min−1x uU−1x mL−1 Combined percent change: IS:−6.9% vs +16.5%*; DI:−13.7% vs +15.5%* |
WT; BMI; TBF, LBMa: NS—data not shown |
|
| D vs CON | African American: BP, WC, TG, HDL: NR GLU: −2.8 vs −2.7mg/dl; I:−1.3 vs +2.2μU/ml; IS: +0.1 vs −0.4×10⁻⁴ min−1x uU−1x mL−1* Latino:BP, WC, TG, HDL: NR GLU: −0.9 vs −5.3mg/dl; I: −2.6 vs −1.0μU/ml; IS: +0.3 vs −0.4×10⁻⁴ min−1x uU−1x mL−1* Combined percent change: IS: +16.5% vs −32.3%*; DI: +15.5% vs −14.2%* |
WT; BMI; TBF, LBMa: NS—data not shown |
|
|
(ANCOVA controlling for pretest values and Tanner stage, sex, total fat mass, and total lean mass. Bonferroni post hoc analysis) |
(No adjustments noted) | ||
| Kelly 2015(18) | RT vs CON | SBP:−3.8 vs −5.1mmHg/DBP: +1.0 vs +0.8 mmHg WC: +5.2 vs −4.4cm TG; HDL: NR GLU: +4.4 vs +2.3 mg/dl; IS: +0.56 vs +0.4 × 10⁻⁴/min/uU/mL (No covariates listed for these outcomes) |
WT:+5.9 vs −7.1kg; BMI: +1.3 vs −3.6 TBF: +1.7 vs +0.7%; +2.9 vs −3.8kga LBM: +1.7 vs −2.1kga (For fat mass, lean mass was included as a covariate, and vice versa.) |
| Lee 2012(21) | RT vs CON | BP: NR WC: −3.2 vs +1.1cm* TG, HDL: NR GLU: +0.1 vs −0.3 mg/dl IS:+0.8 vs −0.1 mg/kg/min per mU/mL* |
WT: −0.6 vs +2.6kg*; BMI: −0.6 vs +0.3* TBF: −2.5 vs +0.2%*;−2.5 vs +1.2kga* LBM: +1.4 vs +0.5kga* |
| AT vs CON | BP: NR WC: −2.0 vs +1.1cm* TG, HDL: NR GLU:−0.4 vs −0.3mg/dl; IS:+0.4 vs −0.1 mg/kg/min per mU/mL |
WT: −0.04 vs +2.6kg*; BMI:−0.3 vs +0.3 TBF: −2.6 vs +0.2%*; −3.0 vs +1.2kga* LBM: +1.0 vs +0.5a |
|
|
(No adjustments/covariates listed; ANOVA; least squared means difference post hoc tests were used to determine differences between the control and intervention groups) |
(No adjustments/covariates listed; ANOVA; least squared means difference post hoc tests were used to determine differences between the control and intervention groups) |
||
| Lee 2013(22) | RT vs CON | BP: NR WC:−1.82 vs −0.25cm TG, HDL: NR GLU: +0.61 vs +1.35mg/dl; IS: +0.03 vs −0.46mg/kg/min per mU/mL |
WT: −0.31 vs +0.13kg; BMI: −0.28 vs −0.03 TBF: −1.6 vs 0.1%*; −2.23 vs +0.70kgb LBM: +0.61 vs +0.21kgb |
| AT vs CON | BP: NR WC:−2.48 vs −0.25cm TG, HDL: NR GLU:−2.11 vs +1.35mg/dl; IS: +0.92 vs −0.46mg/kg/min/uU/ml* |
WT: −1.31 vs +0.13kg; BMI: −0.46 vs −0.03 TBF: −1.7 vs 0.1%*; −2.38 vs +0.70kgb LBM: +0.13 vs +0.21b |
|
|
(ANCOVA; adjustment for baseline values for each outcome variable). |
(ANCOVA; adjustment for baseline values for each outcome variable). | ||
| Shaibi 2006(33) | RT vs CON | BP, WC, TG, HDL: NR GLU: +2.5 vs +1.1mg/dl; IS by FSIVGTT:+0.9 vs +0.1* (Change scores for IS adjusted for change in TBF and LBM mass) |
WT:+1.9 vs +2.1kg; BMI: +0.4 vs +0.4 TBF:−2.5 vs −0.6%; −1.3 vs −0.2kga LBM: +3.7 vs +2.0kga* (No adjustments) |
| Sigal 2014(35) | RT vs CON | SBP: −4 vs −4mmHg / DBP: −2 vs −1mmHg WC: −2.2 vs. −0.2cm* TG: −1.7 vs +6.6mg/dl HDL: +0.9 vs +0.6mg/dl GLU: +0.0 vs −1.9mg/dl; I: −0.8 vs −0.2 μIU/mL |
WT: +0.3 vs +1.3kg ; BMI:−0.5 vs +0.0 TBF: −1.6 vs −0.3%*; −1.3 vs +0.4kgb LBM: +1.4 vs +1.1kgb |
| AT vs CON |
SBP: −5 vs −4mmHg / DBP: −3 vs −1mmHg WC: −3.0 vs. −0.2cm* TG: +2.5 vs +6.6mg/dl HDL: −0.2 vs +0.6mg/dl GLU: +0.3 vs −1.9mg/dl; I: +1.9 vs −0.2μIU/mL |
WT: −0.1 vs +1.3kg ; BMI: −0.6 vs 0.0 TBF: −1.1 vs −0.3%; −1.2 vs +0.4kgb LBM: +0.7 vs +1.1kgb |
|
| RT+AT vs AT |
SBP: −1 vs −5mmHg*/ DBP: −2 vs −3mmHg WC: −4.1 vs −3.0cm TG: −2.2 vs +2.5mg/dl HDL:+1.3 vs +0.2mg/dl GLU: −1.0 vs +0.3mg/dl; I: +0.9 vs +1.9μIU/mL |
WT: −0.8 vs −0.1kg ; BMI:−0.9 vs −0.6 TBF: −1.4 vs −1.1%; −1.7 vs −1.2kgb LBM: +0.8 vs +0.7kgb |
|
| RT+AT vs RT | SBP: −1 vs −4mmHg/ DBP:−2 vs −2mmHg WC: −4.1 vs −2.2cm TG: −2.2 vs −1.7mg/dl HDL: +1.3 vs +0.9 mg/dl GLU: −1.0 vs +0.0mg/dl; I: +0.9 vs −0.8μIU/mL |
WT: −0.8 vs +0.3; BMI: −0.9 vs −0.5 TBF: −1.4 vs −1.6 %; −1.7 vs −1.3kgb LBM: +0.8 vs +1.4kgb |
|
|
(Linear mixed-effects modeling for repeated measures and effects for time, group, and time x group, with age and sex as covariates and an unstructured covariance matrix.) |
(Linear mixed-effects modeling for repeated measures and effects for time, group, and time x group with age and sex as covariates and an unstructured covariance matrix.) |
||
| Suh 2011(37) | RT+D vs AT+D |
BP: NR WC: −0.05 vs −0.76cm TG, HDL: NR GLU AUC: −970.97 vs −2330.73μIU/mL; ISI: +0.01 vs +0.04 |
WT: +1.63 vs −0.61kg; BMI: +0.49 vs −0.45* TBF:+0.92 vs −0.28%; NR kgc LBM: +0.50 vs −0.20kgc |
| RT+D vs D |
BP: NR WC: −0.05 vs +1.62cm TG, HDL: NR GLU AUC: −970.97 vs −2481.83μIU/mL; ISI: +0.01 vs +0.01 |
WT: +1.63 vs +1.82kg; BMI: +0.49 vs +0.45 TBF: :+0.92 vs +0.88%; NR kgc LBM: +0.50 vs +0.65kgc |
|
| AT+D vs D | BP: NR WC: −0.76cm vs +1.62cm TG, HDL: NR GLU AUC: −2330.73 vs −2481.83μIU/mL; ISI: +0.04 vs +0.01 |
WT: −0.61 vs +1.82kg; BMI: −0.45 vs +0.45 TBF: −0.28 vs +0.88%; NR kgc LBM: −0.20 vs +0.65kgc |
|
|
(ANCOVA; adjusted for baseline age, sex, and BMI. Tukey post-hoc analysis.) |
(ANCOVA; adjusted for baseline age, sex, and BMI. Tukey post-hoc analysis.) |
p≤0.05;
DXA,
MRI,
BIA,
BODPOD™,
skin folds;
hydrostatic weighing;
unclear if BODPOD™ or DXA, both were used and are capable of estimating lean and fat tissue, but BODPOD was indicated for weight and DXA for BMD, without specifying which was used for total body fat and lean.
All measures were fasting unless otherwise indicated. AT, aerobic training; RT, resistance training; D, diet; CON, control group, SBP, Systolic Blood Pressure; DBP, Diastolic Blood Pressure; WC, Waist Circumference; TG, Triglycerides; HDL, High-Density Lipoprotein Cholesterol; GLU, glucose; HbA1c, Hemoglobin A1c, HOMA-IR, Homeostatic Model Assessment Insulin Resistance; LDL, Low Density Lipoprotein Cholesterol; TC, total cholesterol; ISI, Insulin Sensitvity Index; IS, insulin sensitivity; DI, disposition index; OGTT, oral glucose tolerance test; AUC, area under the curve; FSIVGTT, frequently sampled i.v. glucose tolerance test; I, insulin; IS, insulin sensitivity by hyperinsulinemic euglycemic clamp; WT, weight; BMI, body mass index (kg/m2); TBF, total body fat; LBM, lean body mass; NS, non-significant; NR, not reported
Metabolic changes with resistance training in studies with the fewest threats to bias
We focused on comparisons between RT and control groups, and studies with designs that made it possible to isolate the effect of RT (i.e. RT+AT versus AT as a comparative intervention group). Detailed comparisons are given in Table 3. Of the four studies with the fewest threats to bias (6, 21, 22, 35), two demonstrated significant decreases in the metabolic syndrome component of waist circumference, but no other metabolic syndrome components (6, 35). Of the other two studies with the fewest threats to bias, results were mixed. One study by Lee et al. (2012), among males only, demonstrated significant improvement in insulin sensitivity with RT versus control (21), while another study by Lee et al. (2013), among females only, demonstrated no improvements in metabolic parameters with resistance training (22).
None of these studies adjusted metabolic models for body composition as a potential modifier, though all of them demonstrated beneficial effects of resistance training on body composition. However, a secondary analysis in the male only study from Lee et al. found that changes in insulin sensitivity were inversely correlated with changes in visceral adipose tissue (kg) when the groups were combined (r = −0.47; P = 0.003) (21).
Three of the four studies with minimal threats to bias demonstrated beneficial changes in other metabolic parameters with RT compared to control (6, 22, 35), although the changes did not reach statistical significance. The increase in HDL was nearly significant in one study (p=0.08) (6) and the increase in hepatic insulin sensitivity was nearly significant in another (p=0.08) (22).
Metabolic changes with resistance training compared to aerobic training in studies with the fewest threats to bias
Three (21, 22, 35) of the four studies with minimal threats to bias included an aerobic training alone or resistance training plus aerobic training group. Insulin sensitivity was not associated with aerobic training in the Lee et al. study of adolescent males, though, as noted above, resistance training improved insulin sensitivity compared to control (21). Conversely, insulin sensitivity was improved with aerobic training in the Lee et al. study of adolescent females, though resistance training did not improve insulin sensitivity in this group compared to control, as noted above (22). Resistance training and aerobic training were not directly compared in either study (21, 22). Sigal et al. found that reduction in waist circumference was significantly greater for aerobic versus control conditions, similar to resistance training versus control, but resistance training alone versus aerobic training alone were not directly compared(35). However, when comparing resistance combined with aerobic training versus aerobic training alone, systolic blood pressure was reduced significantly more with aerobic training alone (35). There were no blood biomarker differences between any groups in the Sigal et al. study, which was the largest study (N=304)(35).
Other potential modifiers of metabolic changes with resistance training in studies with the fewest threats to bias
Across the four studies with minimal threats to bias, no systematic differences between session duration, frequency, compliance, or age, could be determined. The intervention lengths ranged from 8–24 weeks, with the trial without metabolic improvement being 13 weeks. The single null study was female only. In the other studies, there was a general lack of direct statistical comparisons between demographic groups, though age and sex were included as covariates in two studies (6, 35), as well as an additional covariate of maturation in one of them (6).
Metabolic changes with resistance training and potential modifiers in the remaining studies
Overall, ignoring the bias ratings, an additional study by Shaibi et al. among males only, demonstrated improvements in metabolic function with resistance training compared to control. This study also demonstrated concomitant improvements in body composition. It was the only analysis that adjusted for change in total body lean and fat masses. Importantly, the insulin sensitivity improvements demonstrated were measured by the gold standard method of FSIVGTT, although the sample size was small (N=22) and the intervention was relatively brief (16 weeks)(33).
Another study with both males and females, but divided by non-alcoholic fatty liver disease (NAFLD) status, also demonstrated significant metabolic improvements in both groups, although they were different. Those without NAFLD demonstrated improved fasting insulin and HOMA-IR with combined resistance and aerobic training compared to aerobic training alone, while those with NAFLD demonstrated improved fasting glucose in the combined training group compared to aerobic training alone (11).
These two additional studies bring the total to five studies that improved metabolic syndrome components and/or insulin sensitivity without respect to bias ratings.
Of the remaining studies that demonstrated no significant improvements in metabolic parameters, two of the studies demonstrated improvement in body composition (2, 8) and five did not (9, 10, 16, 18, 37). Of the latter, four did adjust metabolic models for BMI or body composition, but not change in BMI or body composition, likely due to lack of beneficial change in BMI or body composition with intervention in those studies (9, 10, 16, 37).
The five studies that benefitted neither metabolic function nor body composition were ≤16 weeks in duration (9, 10, 16, 18, 37), while the two that improved body composition, but not metabolic parameters were ≥24 weeks (2, 8); no systematic differences between session duration, frequency, compliance, age, or sex could be determined.
Discussion
Overall, resistance training had significant positive effects on metabolic parameters in fewer than half of the studies reviewed (5 of 13), though among the studies with the fewest threats to bias, 3 of 4 demonstrated improvements in a component of metabolic syndrome and/or insulin resistance. Despite the addition of more recent studies, our results are in alignment with a previous systematic review of both metabolic syndrome and/or insulin resistance in which mixed results made it difficult to definitively determine if physical activity positively influences metabolic parameters (15). However, a meta-analysis of physical activity effects on insulin resistance alone was more clear; a small to moderate effect was found for physical activity on improving insulin resistance in youth (Hedges’ d effect size = 0.31 [95% confidence interval: 0.06–0.56], P < .05)(12). Unfortunately, these reviews and others did not evaluate resistance training specifically; they combined various types of training and study designs (12, 15, 39). Although Benson et al. attempted to target resistance training in their systematic review, only one of the randomized controlled trials they were able to include was not a circuit-based program with aerobic components (7). What was noted by Benson et al. in 2008 regarding children and adolescents unfortunately remains equally true today: “More robustly designed single modality randomized controlled trials utilizing standardized reporting and precise outcome assessments are required to determine the extent of health outcomes attributable solely to resistance training and to enable the development of evidence-based obesity prevention and treatment strategies …” (7).
Due to the mixed results of beneficial versus null effects of resistance training on metabolic parameters, we looked for intervention differences (bias, sample size, study duration, age, sex, etc.) to help illuminate our unexpected findings. Certainly beneficial effects of resistance training on components of metabolic syndrome and/or insulin resistance seemed to be demonstrated more often in those studies with the fewest threats to bias (3 of 4). Of note, however, the significant beneficial change in metabolic syndrome parameters was limited to waist circumference in two of the studies with the fewest potential threats of bias. Since waist circumference is a marker of central adiposity, these data suggest that potential changes in metabolic syndrome score, if computed, may be driven by body composition changes with resistance training. Unfortunately these studies did not account for changes in body composition in their analytical models.
The results from the remaining studies with good designs but insufficient description of some of the potential threats to bias, also demonstrated mixed results. There were no beneficial changes in either metabolic or body composition parameters (i.e. coupled) with resistance training in several studies (5/9), two studies showed benefit to both metabolic parameters and body composition (i.e. coupled), and two studies showed no beneficial changes in metabolic parameters, but beneficial change in body composition (i.e. uncoupled). Across all studies, regardless of bias ratings, it was extremely rare for researchers to examine change in body composition as an effect modifier of metabolic change within these studies. The variation in outcomes across all studies made it difficult to determine if resistance training can beneficially shift metabolic parameters independent of changes in body composition.
Study demographics varied and planned comparisons between different age groups and sexes were nearly absent from the literature, although two of the three studies that demonstrated beneficial effects of resistance training on metabolic parameters beyond waist circumference were in males only (21, 33). The female only studies showed no metabolic benefits of resistance training (10, 22). Further, it is important to interpret the mixed results across studies in the context of maturation, regardless of age or sex. Children experience pubertal maturation at different ages, and it is difficult to account for pubertal changes in these studies, which frequently take age and sex into consideration in analytical models, but not maturation stage. The variable nature of glucose and insulin levels common during peak growth and maturation, including decreased insulin sensitivity (24), may make it difficult to detect lasting improvement in metabolic function with physical training among a group of youth spanning various stages of maturation regardless of the mode of training. There may be a greater lag between detecting improvements in body composition and subsequent improvements in metabolic parameters among youth during puberty compared to adults.
There was no clear systematic difference between studies that demonstrated beneficial effects of resistance training on metabolic function in terms of training frequency. The length of the intervention and sample sizes were considered, as well, in determining why some interventions were successful in shifting metabolic parameters and others were not. The studies that failed to show significant changes in metabolic parameters tended to last 16 weeks or less, which may be too short a training period to accommodate expected fluctuations in metabolic homeostasis during maturation, although some of the relatively brief studies did report beneficial metabolic outcomes. One may postulate that lack of effect of resistance training on metabolic parameters in some of the studies may be due to power limitations, yet beneficial effects of resistance training were seen across widely varying sample sizes.
Although studies in this and previous systematic reviews largely fail to show statistical significance in terms of the ability of resistance training to positively shift metabolic markers, it remains unclear if they might nonetheless be clinically significant. Contributing to this lack of clarity is the overall paucity of pediatric research related to the necessary shift in metabolic markers in childhood to reduce future chronic disease risks in adulthood Certainly, standardizing the definition of metabolic syndrome internationally, which has yet to occur, will support the conduct and interpretation of clinical trials, as well as diagnosis and management of metabolic dysfunction among youth (13).
Comparisons between studies was further complicated due to lack of systematic quantification of exercise volume, energy expenditure or setting intervention groups at similar energy expenditure targets, and compliance. In addition, there was wide variability in the measurement techniques. The metabolic measures varied from simple fasting glucose and insulin to increasingly precise techniques such as OGTT, FSIVGTT, and the hyperinsulinemic euglycemic clamp, in addition to individual components of metabolic syndrome, which were not always measured. Although the inclusion of each variable depended on the goals of the individual study, the lack of a unified or even similar systematic approach made it difficult to summarize the literature and precluded doing a meta-analysis.
In summary, some, but certainly not all, studies and study designs supported resistance training for inducing beneficial changes in metabolic syndrome, insulin resistance, and their individual components. The literature was not consistent, and the required dose and duration of resistance training to achieve significant, as well as clinically meaningful benefit remains unclear. The benefits of resistance training on body composition may contribute to lasting improvement in metabolic parameters if training is continued due to the importance of both body fat and skeletal muscle in glucose storage and disposal(34), but it has not been evaluated. Potential gains in core and limb control, kinesthetic awareness, and muscular endurance, as well as improved self-concept, may encourage youth who became proficient in resistance training to undertake aerobic training—which may otherwise be quite challenging prior to resistance training, especially among those who are overweight, obese, or previously sedentary (30, 31). Interventions that use resistance training to prepare overweight, obese, or previously sedentary youth for other types of training and combination training deserve further testing.
Supplementary Material
ACKNOWLEGEMENTS
Support for this review was provided by the Eunice K. Shriver National Institute for Child Health and Development/National Institute of Health Grant R01 HD-074565. The funding agency had no role in study design data collection and analysis, decision to publish, or preparation of the manuscript.
Abbreviations:
- AT
aerobic training group
- BIA
bioelectrical impedance
- CON
control group
- CRP
C-reactive protein
- DM
diabetes mellitus
- DBP
Diastolic Blood Pressure
- Diet
diet group
- DI
disposition index
- DXA
dual-energy X-ray absorptiometry
- F
female
- FSIVGTT
frequently sampled intravenous glucose tolerance test
- GLU
glucose
- HDL-C
high-density lipoprotein cholesterol
- I
insulin
- IS
insulin sensitivity
- ISI
Insulin Sensitivity Index
- IR
insulin resistance
- ITT
lean body mass
- LBM
intent to treat
- LPA
leisure physical activity
- LDL-C
low-density lipoprotein cholesterol
- M
male
- MetS
metabolic syndrome
- NHANES
National Health and Nutrition Examination Survey
- NAFLD
non-alcoholic fatty liver disease
- RPE
rate of perceived exertion
- RT
resistance training group
- SBP
Systolic Blood Pressure
- TBF
total body fat
- TC
total cholesterol
- TG
triglycerides
- UNK
unknown/not reported
- WC
waist circumference
- WT
weight
References
- 1.Cochrane Handbook for Systematic Reviews of Interventions Version 5.1.0 [updated March 2011]. The Cochrane Collaboration; 2011. Available from: www.cochrane-handbook.org. [Google Scholar]
- 2.Ackel-D’Elia C, Carnier J, Bueno CR Jr., et al. Effects of different physical exercises on leptin concentration in obese adolescents. Int J Sports Med. 2014;35(2):164–71. [DOI] [PubMed] [Google Scholar]
- 3.Alberga AS, Goldfield GS, Kenny GP, et al. Healthy Eating, Aerobic and Resistance Training in Youth (HEARTY): study rationale, design and methods. Contemp Clin Trials. 2012;33(4):839–47. [DOI] [PubMed] [Google Scholar]
- 4.Bastard JP, Maachi M, Lagathu C, et al. Recent advances in the relationship between obesity, inflammation, and insulin resistance. Eur Cytokine Netw. 2006;17(1):4–12. [PubMed] [Google Scholar]
- 5.Bea JW, Lohman TG. Long-term weight loss and chronic disease. Int J Body Compos Res. 2010;8(Supplement):S21–S8. [Google Scholar]
- 6.Benson AC, Torode ME, Fiatarone Singh MA. The effect of high-intensity progressive resistance training on adiposity in children: a randomized controlled trial. Int J Obes (Lond). 2008;32(6):1016–27. [DOI] [PubMed] [Google Scholar]
- 7.Benson AC, Torode ME, Fiatarone Singh MA. Effects of resistance training on metabolic fitness in children and adolescents: a systematic review. Obes Rev. 2008;9(1):43–66. [DOI] [PubMed] [Google Scholar]
- 8.Damaso AR, da Silveira Campos RM, Caranti DA, et al. Aerobic plus resistance training was more effective in improving the visceral adiposity, metabolic profile and inflammatory markers than aerobic training in obese adolescents. J Sports Sci. 2014;32(15):1435–45. [DOI] [PubMed] [Google Scholar]
- 9.Davis JN, Kelly LA, Lane CJ, et al. Randomized control trial to improve adiposity and insulin resistance in overweight Latino adolescents. Obesity (Silver Spring). 2009;17(8):1542–8. [DOI] [PMC free article] [PubMed] [Google Scholar]
- 10.Davis JN, Tung A, Chak SS, et al. Aerobic and strength training reduces adiposity in overweight Latina adolescents. Med Sci Sports Exerc. 2009;41(7):1494–503. [DOI] [PMC free article] [PubMed] [Google Scholar]
- 11.de Piano A, de Mello MT, Sanches Pde L, et al. Long-term effects of aerobic plus resistance training on the adipokines and neuropeptides in nonalcoholic fatty liver disease obese adolescents. Eur J Gastroenterol Hepatol. 2012;24(11):1313–24. [DOI] [PubMed] [Google Scholar]
- 12.Fedewa MV, Gist NH, Evans EM, Dishman RK. Exercise and insulin resistance in youth: a meta-analysis. Pediatrics. 2014;133(1):e163–74. [DOI] [PubMed] [Google Scholar]
- 13.Ford ES, Li C. Defining the metabolic syndrome in children and adolescents: will the real definition please stand up? J Pediatr. 2008;152(2):160–4. [DOI] [PubMed] [Google Scholar]
- 14.Goodpaster BH, Kelley DE. Obesity and Diabetes: Body Composition Determinants of Insulin Resistance In: Heymsfield S, Lohman T, Wang Z, Going S, editors. Human Body Composition. 2 ed. Champaign, IL: Human Kinetics; 2005. p. 365–75. [Google Scholar]
- 15.Guinhouya BC, Samouda H, Zitouni D, Vilhelm C, Hubert H. Evidence of the influence of physical activity on the metabolic syndrome and/or on insulin resistance in pediatric populations: a systematic review. Int J Pediatr Obes. 2011;6(5–6):361–88. [DOI] [PubMed] [Google Scholar]
- 16.Hasson RE, Adam TC, Davis JN, et al. Randomized controlled trial to improve adiposity, inflammation, and insulin resistance in obese African-American and Latino youth. Obesity (Silver Spring). 2012;20(4):811–8. [DOI] [PMC free article] [PubMed] [Google Scholar]
- 17.Kahn SE, Hull RL, Utzschneider KM. Mechanisms linking obesity to insulin resistance and type 2 diabetes. Nature. 2006;444(7121):840–6. [DOI] [PubMed] [Google Scholar]
- 18.Kelly LA, Loza A, Lin X, et al. The effect of a home-based strength training program on type 2 diabetes risk in obese Latino boys. J Pediatr Endocrinol Metab. 2015;28(3–4):315–22. [DOI] [PubMed] [Google Scholar]
- 19.Kim S, Valdez R. Metabolic risk factors in U.S. youth with low relative muscle mass. Obes Res Clin Pract. 2015;9(2):125–32. [DOI] [PMC free article] [PubMed] [Google Scholar]
- 20.Kim Y, Park H. Does Regular Exercise without Weight Loss Reduce Insulin Resistance in Children and Adolescents? Int J Endocrinol. 2013;2013:402592. [DOI] [PMC free article] [PubMed] [Google Scholar]
- 21.Lee S, Bacha F, Hannon T, Kuk JL, Boesch C, Arslanian S. Effects of aerobic versus resistance exercise without caloric restriction on abdominal fat, intrahepatic lipid, and insulin sensitivity in obese adolescent boys: a randomized, controlled trial. Diabetes. 2012;61(11):2787–95. [DOI] [PMC free article] [PubMed] [Google Scholar]
- 22.Lee S, Deldin AR, White D, et al. Aerobic exercise but not resistance exercise reduces intrahepatic lipid content and visceral fat and improves insulin sensitivity in obese adolescent girls: a randomized controlled trial. Am J Physiol Endocrinol Metab. 2013;305(10):E1222–9. [DOI] [PMC free article] [PubMed] [Google Scholar]
- 23.Liberati A, Altman DG, Tetzlaff J, et al. The PRISMA statement for reporting systematic reviews and meta-analyses of studies that evaluate health care interventions: explanation and elaboration. Ann Intern Med. 2009;151(4):W65–94. [DOI] [PubMed] [Google Scholar]
- 24.Moran A, Jacobs DR Jr., Steinberger J, et al. Insulin resistance during puberty: results from clamp studies in 357 children. Diabetes. 1999;48(10):2039–44. [DOI] [PubMed] [Google Scholar]
- 25.Odegaard JI, Chawla A. Pleiotropic actions of insulin resistance and inflammation in metabolic homeostasis. Science. 2013;339(6116):172–7. [DOI] [PMC free article] [PubMed] [Google Scholar]
- 26.Ogden CL, Carroll MD, Kit BK, Flegal KM. Prevalence of childhood and adult obesity in the United States, 2011–2012. JAMA. 2014;311(8):806–14. [DOI] [PMC free article] [PubMed] [Google Scholar]
- 27.Poloz Y, Stambolic V. Obesity and cancer, a case for insulin signaling. Cell Death Dis. 2015;6:e2037. [DOI] [PMC free article] [PubMed] [Google Scholar]
- 28.Reilly JJ, Kelly J. Long-term impact of overweight and obesity in childhood and adolescence on morbidity and premature mortality in adulthood: systematic review. Int J Obes (Lond). 2011;35(7):891–8. [DOI] [PubMed] [Google Scholar]
- 29.Reilly JJ, Methven E, McDowell ZC, et al. Health consequences of obesity. Arch Dis Child. 2003;88(9):748–52. [DOI] [PMC free article] [PubMed] [Google Scholar]
- 30.Schranz N, Tomkinson G, Olds T. What is the effect of resistance training on the strength, body composition and psychosocial status of overweight and obese children and adolescents? A Systematic review and meta-analysis. Sports Med. 2013;43(9):893–907. [DOI] [PubMed] [Google Scholar]
- 31.Schranz N, Tomkinson G, Parletta N, Petkov J, Olds T. Can resistance training change the strength, body composition and self-concept of overweight and obese adolescent males? A randomised controlled trial. Br J Sports Med. 2014;48(20):1482–8. [DOI] [PubMed] [Google Scholar]
- 32.Serdula MK, Ivery D, Coates RJ, Freedman DS, Williamson DF, Byers T. Do obese children become obese adults? A review of the literature. Prev Med. 1993;22(2):167–77. [DOI] [PubMed] [Google Scholar]
- 33.Shaibi GQ, Cruz ML, Ball GD, et al. Effects of resistance training on insulin sensitivity in overweight Latino adolescent males. Med Sci Sports Exerc. 2006;38(7):1208–15. [DOI] [PubMed] [Google Scholar]
- 34.Shepherd PR, Kahn BB. Glucose transporters and insulin action--implications for insulin resistance and diabetes mellitus. N Engl J Med. 1999;341(4):248–57. [DOI] [PubMed] [Google Scholar]
- 35.Sigal RJ, Alberga AS, Goldfield GS, et al. Effects of aerobic training, resistance training, or both on percentage body fat and cardiometabolic risk markers in obese adolescents: the healthy eating aerobic and resistance training in youth randomized clinical trial. JAMA, Pediatr 2014;168(11):1006–14. [DOI] [PubMed] [Google Scholar]
- 36.Srinivasan SR, Myers L, Berenson GS. Predictability of childhood adiposity and insulin for developing insulin resistance syndrome (syndrome X) in young adulthood: the Bogalusa Heart Study. Diabetes. 2002;51(1):204–9. [DOI] [PubMed] [Google Scholar]
- 37.Suh S, Jeong IK, Kim MY, et al. Effects of resistance training and aerobic exercise on insulin sensitivity in overweight korean adolescents: a controlled randomized trial. Diabetes Metab J. 2011;35(4):418–26. [DOI] [PMC free article] [PubMed] [Google Scholar]
- 38.van der Aa MP, Fazeli Farsani S, Knibbe CA, de Boer A, van der Vorst MM. Population-Based Studies on the Epidemiology of Insulin Resistance in Children. J Diabetes Res. 2015;2015:362375. [DOI] [PMC free article] [PubMed] [Google Scholar]
- 39.Vasconcellos F, Seabra A, Katzmarzyk PT, Kraemer-Aguiar LG, Bouskela E, Farinatti P. Physical activity in overweight and obese adolescents: systematic review of the effects on physical fitness components and cardiovascular risk factors. Sports Med. 2014;44(8):1139–52. [DOI] [PubMed] [Google Scholar]
Associated Data
This section collects any data citations, data availability statements, or supplementary materials included in this article.