Abstract
Purpose
Phacoemulsification has been shown to reduce intraocular pressure (IOP). The mechanism of action is thought to be via increased trabecular outflow facility. However, studies on the relationship between phacoemulsification and outflow facility have been inconsistent. This study intended to examine the change in electronic Schiotz tonographic outflow facility (TOF) and IOP measurements following phacoemulsification.
Methods
Patients who were due to undergo a standard clear corneal incision phacoemulsification with intraocular lens (IOL) implantation, at St Thomas’ Hospital, were invited to participate in this study. IOP was measured using Goldmann’s applanation tonometer, and TOF was measured by electronic Schiotz tonography at baseline and at 3, 6 and 12 months postoperatively.
Results
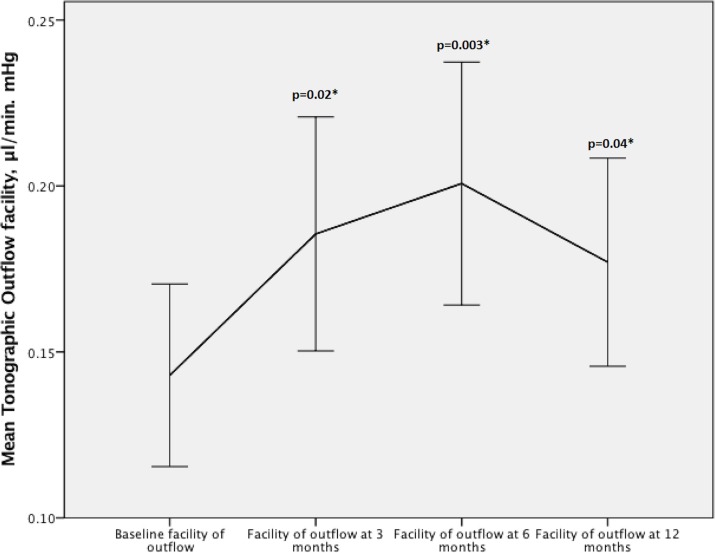
Forty-one patients were recruited. Tonography data for 27 patients were reliable and available at all time points. Eleven cases had primary open angle glaucoma and cataract, while 16 patients had cataract only. Mean IOP reduced at every time point postoperatively significantly compared with baseline. TOF improved significantly after cataract extraction at all time points (baseline of 0.14±0.06 vs 0.18±0.09 at 3 months, P=0.02 and 0.20±0.09 at 6 months, P=0.003, 0.17±0.07 µL/min mmHg at 12 months, P=0.04). Five contralateral eyes of patients with cataracts only who did not have any intraocular surgery during the follow-up period were used as comparison. Their IOP and TOF did not change significantly at any postoperative visits.
Conclusion
This is the first study using electronic Schiotz tonography with documented anterior chamber depth and gonioscopy after modern cataract surgery (CS) with phacoemulsification and IOL implantation. We demonstrated that phacoemulsification increases TOF and this fully accounts for the IOP reduction following CS.
ISTCRN registration number
Keywords: Phacoemulsification, cataract surgery, glaucoma, outflow facility, tonography
Introduction
Several studies explored the effects of phacoemulsification on intraocular pressure (IOP) changes at short (6 months), medium (36 months) and long term (60 months).1–5 The reported IOP reduction varies between 1.5 and 9.0 mm Hg.5–7 Different mechanisms of action have been proposed for the IOP-lowering effects following cataract surgery (CS), including the mechanical influence of the lens removal,6 increased uveoscleral outflow and increased trabecular outflow.8 However, there are no studies using electronic Schiotz tonography assessing the effect of modern small incision phacoemulsification with intraocular lens (IOL) implantation on trabecular outflow facility.
Lee and Trotter9 investigated the effect of extracapsular cataract extraction without IOL implantation on the facility of outflow. They used electronic Schiotz tonography in patients with cataract of whom seven cases had open or closed angle glaucoma and 11 cases of pseudoexfoliation. They showed that facility of outflow decreased within first 3 weeks postoperatively but then returned to preoperative values within 4 months after the operation. However, in this study, outflow facility changes were very variable. Additionally, they had included mixed cases of complicated surgeries such as vitreous loss and the follow-up was only 6 months.
Another study by Meyer and associates,10 demonstrated that pneumatonographic outflow facility after phacoemulsification improved on the first day after surgery; however, outflow facility at 1 year (0.46±0.38 µL/min mm Hg) was not statistically different compared with the baseline of 0.39±0.23 µL/min mm Hg.
To date, there have been no studies using electronic Schiotz tonography (which is a method of outflow facility measurement with less intersubject and interobserver variability compared with pneumatonography11–13) to determine the effect of modern small incision phacoemulsification CS on tonographic facility of outflow.
Methods
This research conformed to the tenets of the Declaration of Helsinki. Patients with visually significant cataract with or without primary open angle glaucoma (POAG), who were due to undergo phacoemulsification with IOL implantation, were enrolled in this prospective study. The recruitment took place between September 2009 and May 2011. POAG was defined as IOP >21 mmHg on at least one occasion and abnormal visual field testing with corresponding optic disc changes. Only one eye per patient was included in the final analysis. When both eyes were eligible, only the first eye to be operated on was included in the analysis. Patients were provided with study information at the initial contact, and signed informed consent was sought before measurements and the surgery. Patients with any history of intraocular or keratorefractive surgery, any secondary glaucoma including traumatic, neovascular, uveitic, pseudoexfoliative and pigment dispersion syndrome were excluded.
Contralateral eyes of the study patients, which did not undergo any intraocular surgery during the follow-up period, with available tonographic outflow facility (TOF) and IOP data at all time points postoperatively, were used for the comparison purposes.
Measurements
All patients underwent a comprehensive ophthalmic examination before the operation, including visual acuity measurement (LogMAR), slit lamp biomicroscopy, gonioscopy, IOP measurement using Goldmann’s applanation tonometer, anterior chamber depth (ACD) and axial length (AXL) measurement using IOL Master (Carl Zeiss Meditec, Dublin, California, USA), central corneal thickness (CCT; Pachmate DGH 55, DGH Technology, Exton, Pennsylvania, USA), static automated visual field (Humphrey automated white-on white, 24–2 SITA-standard; Carl Zeiss Meditec), and dilated ophthalmoscopic examination.
TOF (TOF=‘C’) was measured with an electronic Schiotz tonographer (model 720; Berkeley Bioengineering, San Leandro, California, USA) on the day of the surgery (between 09:00 and 11:00) prior to the operation and then repeated at 3, 6 and 12 months postoperatively. The facility of outflow was measured from the rate of the decay of IOP in the supine position during application of a recording Schiotz tonometer probe on the cornea, over a period of 4 min with a standard 5.5 g weight.12 Nine readings at 30 s intervals were manually entered the McLaren tonography computer program.11 The programme fits a second-degree polynomial by the method of least squares to nine data points and determines by extrapolation, the best-fit values at time 0 and 4 min. The values at 0 and 4 min are then used to calculate ‘C’ based on standard nomograms.12 14
Data collection and outcome measures
Data including age, gender, race, IOP, TOF, CCT, AXL, anterior chamber depth, gonioscopy, vertical cup: disc ratio and mean deviation in visual field testing were recorded.
Primary outcome measures were TOF (C) and IOP at 3, 6 and 12 months’ postcataract extraction.
Surgical procedure
CS was performed by an experienced surgeon (KSL) under local or general anaesthesia. A clear corneal incision (2.8 mm) was made and followed by a paracentesis and the injection of viscoelastic. Then capsulorrhexis and hydrodissection was performed. The lens was removed by phacoemulsification of the lens nucleus and aspiration of the cortical lens matter. After further injection of the viscoelastic, an acrylic injectable IOL (AcrySof SA60AT, Alcon, Texas, USA) of the appropriate power was inserted into the capsular bag. The viscoelastic was washed out and an intracameral antibiotic injection was given at the end. Patients received Maxitrol (Neomycin sulfate 3500 IU/mL, Polymyxin B sulfate 6000 IU/mL and 1 mg dexamethasone, Alcon Laboratories, UK) four times daily for 2 weeks and then twice daily for another 2 weeks postoperatively. All patients were off steroid treatment after this period.
Sample size calculation
The SD of outflow facility was derived from a previous study by one of the authors.11 This study had a 90% chance of finding an 8.4% difference in outflow facility and 5% difference in IOP among two groups, if these differences existed (n=25 subjects, α=0.05 and β=0.10). There was no difference between the two groups in terms of relative changes in facility; therefore, we used combined data into one group of 25.
Statistical analysis
Student’s t-test and one-way analysis of variance (ANOVA) for repeated measures were used to compare continuous variables among groups. The 95% CIs for the mean difference between pairs for each outcome measure were calculated. Linear regression analysis was used to determine the correlation between IOP, facility of outflow and differences from baseline. P<0.05 was considered to be significant (IBM SPSS V.23.0).
Results
Forty-one patients were enrolled in the study. Eight patients withdrew after signing the consent, due to their time constraints and inability to attend all required postoperative visits. Three subjects had poor tonography tracings on at least one time point (10% rejection rate in aqueous humour dynamic measurement is similar to previous studies).11 One case was excluded due to an intraoperative complication (posterior capsular rupture and vitreous loss) and two further cases were omitted due to persistent postoperative uveitis. In total, data from 27 patients with reliable tonographic outflow tracings at baseline and all subsequent study visits were included in the final analysis. Only one eye from each patient was used for the analysis.
Sixteen individuals had cataract only, while 11 cases had an existing diagnosis of POAG. The average age was comparable (in cataract cases mean age was 67±11.2 years, while in POAG group it was 73±7.2 years, P=0.09). Other baseline characteristics of each group is shown in table 1.
Table 1.
Baseline characteristics
| Cataract only (n=16) | POAG and cataract (n=11) | P value | 95% CI | Overall (n=27) | |
| Age (years)†, range | 67±11.2 (43–82) | 73±7.2 (59–83) | 0.09 | −14.8 to 1.1 | 69±10.2 (43–83) |
| Gender (F:M) | 9:7 | 3:8 | 0.4 | – | 12:15 |
| BCVA | 0.3±0.4 | 0.3±0.2 | 0.7 | −0.2 to 0.3 | 0.3±0.3 |
| Ethnicity (Asian:Black:White) | 0:4:12 | 2:6:3 | 0.5 | – | 2:10:15 |
| ACD (mm)†, range | 3.25±0.36 (2.9–3.8) | 3.22±0.48 (2.85–4.1) | 0.8 | −0.3 to 0.3 | 3.23±0.40 (2.85–4.1) |
| AXL (mm)†, range | 23.3±0.8 (22.8–24.5) | 23.9±0.94 (22.5–25.7) | 0.06 | −1.3 to 0.05 | 23.6±0.89 (22.5–25.7) |
| CCT (µm)†, range | 535±27 (497–596) | 543±27 (507–580) | 0.5 | −29.4 to 14.1 | 538±26 (497–596) |
| IOP (mm Hg), range | 15.7±2.8 (10–22) | 16.3±4.8 (10–26) | 0.7 | −3.50 to 2.4 | 15.9±3.66 (10–26) |
| TOF (µL/min/mm Hg), range | 0.15±0.06 (0.06–0.29) | 0.13±0.08 (0.04–0.29) | 0.4 | −0.03 to 0.08 | 0.14±0.06 (0.04–0.29) |
| HVF (mean deviation)‡, range | 2.5±0.6 (1.0–3.0) | −11.7±1.9 (−14.0 to2.0) | <0.001* | – | −3.1±8.84 (−14 to 3) |
| Cup disc ratio‡ | 0.3 (0.2–0.7) | 0.6 (0.6–0.9) | <0.001* | – | 0.5 (0.2–0.9) |
| Phaco power, %, range | 19.8±8.7 (10–31) | 15.9±5.0 (10–27.9) | 0.06 | −2.1 to 9.9 | 18.2±7.5 (10–31) |
| Phaco time, minutes, range | 2.25±4.12 (1.0–3.4) | 1.54±0.54 (0.5–2.3) | 0.16 | −1.8 to 3.3 | 1.9±3.13 (0.5–3.4) |
*Statistically significant.
†Student’s t-test (two sided).
‡Mann-Whitney test.
ACD, anterior chamber depth; AXL, axial length; BCVA, best corrected visual acuity; CCT, central corneal thickness; HVF, Humphrey visual field; IOP, intraocular pressure; POAG, primary open angle glaucoma.
Baseline IOP was similar in each group (15.7±2.7 mm Hg in non-glaucomatous cases vs 16.3±4.8 mm Hg in POAG with cataract group, P=0.7, 95% CI −3.6 to 2.4).
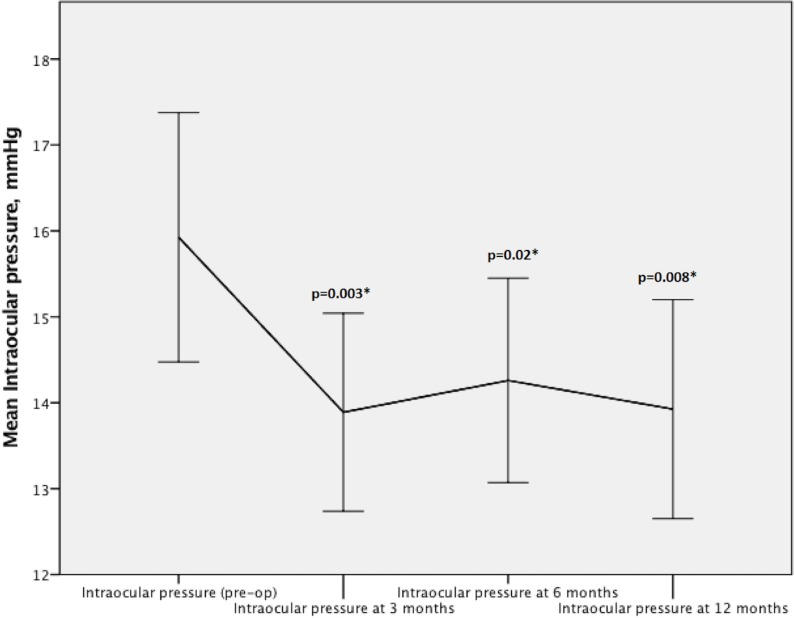
Overall, IOP reduced by 2.0±3.2 mm Hg at 3 months (12% decrease), while at 6-month and 12-month visits, it only reduced by 1.7±3.4 (10% decrease) and 2.0±3.6 mm Hg (10% decrease), respectively (table 2 and figure 1). We used one-way ANOVA for repeated measures to compare IOP between each visit. The IOP reduction at all post-operative visits was statistically significant (3 months P=0.003, 6 months P=0.04 and 12 months P=0.02).
Table 2.
This table illustrates IOP reduction at postoperative visits at 3, 6 and 12 months compared with baseline IOP
| IOP at baseline | IOP at 3 m (mm Hg), % of reduction | Comparison made to baseline | IOP at 6 m (mm Hg), % of reduction | Comparison made to baseline | IOP at 12 m (mm Hg), % of reduction | Comparison made to baseline | |
| Cataract group (n=16) | 15.7±2.8 | 13.4±2.7 (13) | P=0.009*, 95% CI 0.6 to 3.8 | 14.4±2.6 (7) | P=0.005*, 95% CI 0.17 to 2.6 | 13.7±2.9 (12) | P=0.006*, 95% CI 0.6 to 3.2 |
| POAG group (n=11) | 16.3±4.8 | 14.5±3.2 (6) | P=0.1, 95% CI −0.7 to 4.2 | 14.0±3.6 (9) | P=0.1, 95% CI −0.8 to 5.1 | 14.2±3.7 (8) | P=0.2, 95% CI −1.3 to 5.5 |
| Overall (n=27) | 15.9±3.66 | 13.9±2.9 (12) | P=0.003*, 95% CI 0.7 to 3.3 | 14.3±3.0 (10) | P=0.02*, 95% CI 0.3 to 2.9 | 13.9±3.2 (10) | P=0.008*, 95% CI 0.5 to 3.4 |
Additionally, percentage of IOP reduction is shown.
*Statistically significant.
IOP, intraocular pressure; POAG, primary open angle glaucoma.
Figure 1.
Overall intraocular pressure (IOP) changes on each time point postoperatively compared with baseline IOP. *Statistically significant.
TOF improved significantly at all postoperative time points after cataract extraction compared with the baseline (table 3 and figure 2). However, TOF enhancement did not differ between each visit using one-way ANOVA for repeated measures (at 3 months P=0.7, at 6 months P=0.4 and at 12 months P=0.2). There was no statistically significant correlation between phaco power and TOF at any time point (at 3 months P=0.5, at 6 months P=0.4 and at 12 months P=0.7).
Table 3.
This shows TOF enhancement postsurgery at each postoperative visit at 3, 6 and 12 months compared with baseline TOF
| TOF at baseline | TOF at 3 m (µL/min mm Hg), % of enhancement | Comparison made to baseline | TOF at 6 m (µL/min mm Hg), % of enhancement | Comparison made to baseline | TOF at 12 (µL/min mm Hg), % of enhancement | Comparison made to baseline | |
| Cataract group (n=16) | 0.15±0.06 | 0.20±0.09 (15) | P=0.05, 95% CI −0.11 to 0.1 | 0.22±0.10 (17) | P=0.02*, 95% CI −0.12 to −0.01 | 0.18±0.07 (10) | P=0.25, 95% CI −0.07 to 0.02 |
| POAG group (n=11) | 0.13±0.08 | 0.15±0.06 (14) | P=0.2, 95% CI −0.07 to 0.01 | 0.17±0.07 (16) | P=0.05*, 95% CI −0.08 to −0.1 | 0.17±0.08 (15) | P=0.07, 95% CI −0.09 to 0.006 |
| Overall (n=27) | 0.14±0.06 | 0.18±0.08 (16) | P=0.02*, 95% CI −0.07 to −0.007 | 0.20±0.09 (15) | P=0.003*, 95% CI −0.09 to −0.02 | 0.17±0.08 (10) | P=0.04*, 95% CI −0.06 to −0.001 |
Additionally, the percentage of TOF enhancement is shown.
*Statistically significant.
IOP, intraocular pressure; POAG, primary open angle glaucoma; TOF, tonographic outflow facility.
Figure 2.
Overall tonographic outflow facility changes at each postoperative visit compared with baseline intraocular pressure. *Statistically significant.
The average postoperative IOP in cataract and POAG cases are shown in table 2 and figure 3. Mean IOP in cataract cases at 12 months’ postsurgery was 13.7±3.0 mm Hg; this was comparable to POAG cases in which IOP decreased to 14.2±3.7 mm Hg (P=0.7, 95% CI −3.0 to 2.2). Overall, baseline IOP was a moderate predictor of postoperative IOP reduction at all time points (P=0.004, R=0.53).
Figure 3.
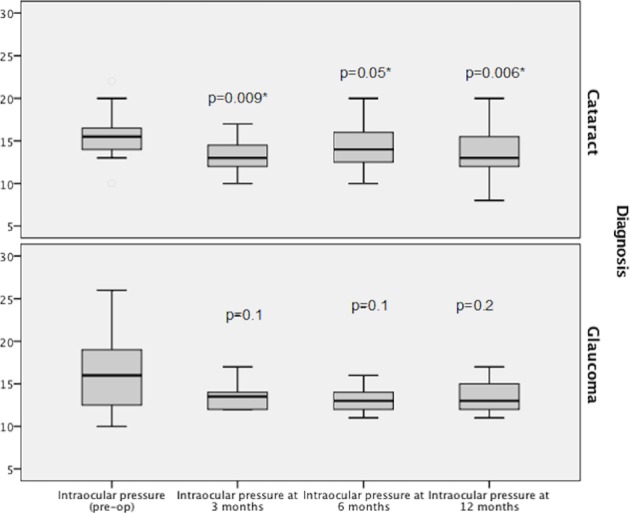
Intraocular pressure changes over 12 months’ period compared between each visit. *Statistically significant.
Additionally, there was no statistically significant correlation between TOF changes and IOP alterations at any time point (P=0.08, r2=0.1) (figure 4). Furthermore, there was no statistically significant correlation between AXL and ACD with IOP and TOF (P=0.9, r2=0.002).
Figure 4.
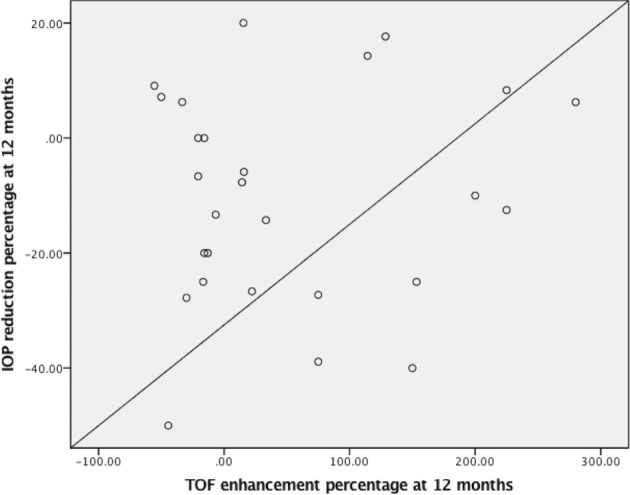
Correlation between tonographic outflow facility (TOF) changes and intraocular pressure (IOP) alterations at all time point. There is no linear correlation (P=0.08, r2=0.1).
The number of glaucoma medications and treatment regime remained unchanged in the POAG group at baseline and at all postoperative visits. All patients were on prostaglandin analogues. Additionally, five patients were taking beta blockers, four patients carbonic anhydrase inhibitor and one patient was on alpha-2 agonist medications. IOP and TOF measurements were not statistically different in any particular group of these patients (P=0.35).
The IOP reduction was statistically significant at all postoperative visits in cataract groups but not in the POAG group (table 2 and figure 3).
While TOF in cataract group only improved at 3 and 6 months postoperatively, in the glaucoma group only month 6 TOF enhancement was statistically significant.
The comparative data is presented in figure 5.
Figure 5.
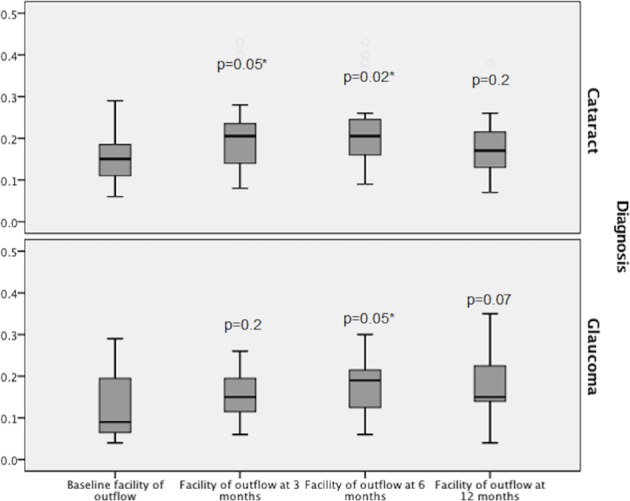
Demonstrates facility of outflow alteration during 12-month period in each group of patients separately. *Statistically significant.
Overall, baseline TOF was weakly correlated to TOF at 3 month postoperatively (P=0.05, r=0.40) (figure 6).
Figure 6.
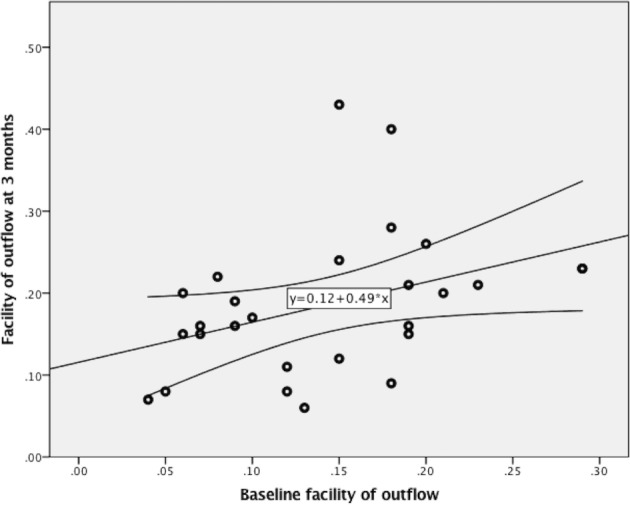
Correlation between baseline tonographic outflow facility (TOF) and 3 months after surgery TOF.
We identified five patients (with cataract) who did not undergo any intraocular surgery in their contralateral eyes during the follow-up period and used their data as comparison. The average age of this group was 64.4±7.4 years. They all had open angles on gonioscopy (Shaffer’s grading of 3 or 4 in all quadrants) with mean anterior chamber depth of 2.98±0.62 mm. The baseline IOP for this group was 18.0±2.09 mm Hg, which did not change significantly at 3, 6 and 12 months’ visits (15.2±1.90 mm Hg at 3 months, P=0.84, 16.4±2.07 mm Hg, P=0.21 and 16.8±2.71 mm Hg at 12 months, P=0.29) (figure 7). Similarly, the facility of outflow at 3, 6 and 12 months compared with baseline was not statistically different at any time point (0.18±0.08 vs 0.18±0.09 at 3 months, P=0.1, 0.18±0.09 at 6 months, P=0.55 and 0.18±0.07 µL/min mm Hg at 12 months, P=0.6) (figure 8).
Figure 7.
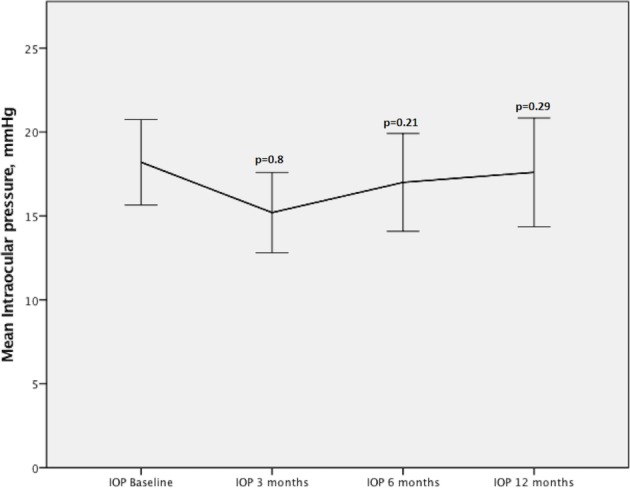
Intraocular pressure changes during postoperative visits in the control group. *Statistically significant.
Figure 8.
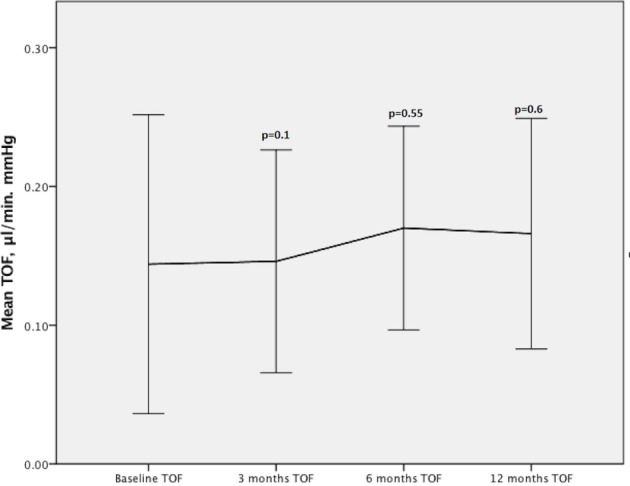
Tonographic outflow facility (TOF) changes during postoperative visits in the control group. *Statistically significant.
Discussion
This is the first study to assess the facility of tonographic outflow after modern small incision phacoemulsification with IOL implantation using electronic Schiotz tonography. We demonstrated that IOP was significantly reduced at 3, 6 and 12 months after CS. In this study, the overall mean IOP reduction varied between 10% and 12%. There were also corresponding positive enhancement of TOF at all time points.
Numerous studies have explored the effect of phacoemulsification CS on IOP; all demonstrated significant but variable fall in IOP (1.5–9.0 mm Hg) postoperatively.4 6 15–19 However, current evidence is very limited on the effect of phacoemulsification on the facility of outflow.
In the Ocular Hypertension Treatment Study (OHTS), the IOP reduction was 4.0 mm Hg, 3 years after CS,5 which was greater than observed IOP reduction in our study at 12 months (2.0±3.6 mm Hg). However, in the OHTS, baseline IOP was slightly higher (19.8±3.2 mm Hg) compared with our cohort (16.0±3.7 mm Hg). The IOP reduction after phacoemulsification has been shown to be proportional to the preoperative IOP, with significantly greater IOP reduction observed among those with higher preoperative IOP7; this may explain the greater IOP reduction in the OHTS group.
A recent randomised control trial of a Schlemm’s canal microstent (Hydrus II) with phacoemulsification in patients with open angle glaucoma, assessed 100 patients.7 Cases were randomised to have either CS alone or CS with microstent implant. In the CS group, washed-out IOP reduced from baseline of 26.6±4.2 to 17.4±3.7 mm Hg at 12 months. The mean IOP reduction was 9.0 mm Hg at 1 year. This study had much higher baseline IOP (26.6±4.2 mm Hg) and consequently, greater observed IOP reduction (9.0 mm Hg) at 1 year, compared with our study (2.0±3.6 mm Hg) and OHTS (4.0 mm Hg).20 One should take into consideration the effect of regression to the mean phenomenon when interpreting a physiological values such as IOP which is known to fluctuate.7
Contrary to our study, Meyer and associates10 reported no enhancement of the facility of outflow at 6 weeks’ post phacoemulsification CS (baseline outflow facility of 0.39±0.23 vs 0.37±0.16 µL/min mm Hg 6 weeks). This may partly be attributable to the inconsistency of pneumatonography technique used in their study, highlighted by their much higher than usual baseline outflow facility value compared with other historical data.21
Kee and Moon22 carried out pneumatonography before and 2 months after phacoemulsification with IOL implantation in 42 patients with cataract. In this study, the IOP reduction was 2.4±0.4 mm Hg at 2 month postoperatively. They demonstrated that outflow facility improved from 0.26±0.01 to 0.30±0.01 µL/min mm Hg 2 months after lens extraction. Although the duration of that study was short, their findings are in agreement with our results at 3 months (0.14±0.07 preoperatively vs 0.18±0.09 µL/min mm Hg at 3 months). It is worth pointing out that the latter study did not report the anterior chamber depth or gonioscopy of their cases prior to the CS. One would assume that considering the higher prevalence of angle closure in Korean population, narrow angle cases might have been included in their study inadvertently, making the effect of the lens removal on IOP reduction and the facility of outflow more exaggerated.
TOF encompasses changes in trabecular outflow facility, as well as any pressure-dependent changes to inflow (pseudofacility) or uveoscleral outflow.23 24 Nonetheless, in our study, we investigated the change in TOF before and after CS using the same measurement technique, which theoretically means that these potential confounding effects should be less of an issue.
Although the most widely held view regarding the mechanism of IOP-lowering effect postphacoemulsification is through increased trabecular outflow facility, there were some speculations as to whether phacoemulsification may affect uveoscleral outflow as well as other aqueous humour dynamic parameters.2 In order to explore this, we made some calculations using the Goldmann’s equation (see online Supplementary appendix). If we assume that other aspects of aqueous dynamic parameters, such as aqueous production (Ff), uveoscleral outflow (Fu) or episcleral venous pressure (Pe) are unlikely to be affected by phacoemulsification and the mechanism of IOP-lowering effect of phacoemulsification CS is solely via the increase in trabecular outflow facility, then according to Goldmann’s equation, a 10%–12% reduction in IOP (Pi) at all postoperative visits seen in our study should correspond to 11%–18% increase in TOF (C) and this correlated well with our measured increase of 10%–15% in TOF. As this largely accounts for the amount of IOP reduction, one can therefore conclude that the reason for the IOP drop postphacoemulsification is caused by an increase in trabecular outflow facility rather than any effects on other aqueous dynamic parameters such as uveoscleral outflow (see online Supplementary appendix).
bjophthalmol-2017-311548supp001.pdf (423.7KB, pdf)
In our study, there was no linear correlation between AXL, IOP and TOF. The available evidence generally corroborates our findings with regard to AXL and IOP.25–27 However, there are no previous studies looking at the relationship between TOF and AXL.
However, the question remains as to the underlying mechanism for the increase in trabecular outflow facility. Both mechanical changes and modifications at the cellular level have been put forward as the potential reason for the increase in outflow facility postphacoemulsification.4 28–31 Although this is outside the scope of this study, it is useful to describe these theories briefly.
Based on the mechanical theory, the anterior chamber biometric alterations after phacoemulsification as well as other changes,30 31 may have been responsible for the increase in trabecular outflow facility.4 Zhao et al exhibited a significant expansion of the Schlemm’s canal based on optical coherent scans in eyes that had undergone phacoemulsification. Mehdizadeh also contemplated that the changes in the contractility of the ciliary muscles may have been accounted for the increase in trabecular outflow facility and the subsequent drop in IOP.30
Per the cellular theory, proposed by Wang et al 28 and Tsuboi et al,29 ultrasound can induce chemical and cellular changes in vitro in cultured trabecular meshwork cells. However, another in vivo clinical studies failed to show a linear correlation between ultrasound energy and IOP reduction after CS.32
One limitation of our study is that POAG cases should have had a washout period from their glaucoma medications prior to study measurements. However, the number of medications which can affect trabecular outflow facility remained unchanged postoperatively. Furthermore, the results of the subgroup analysis were also similar to that of the combined data. However, because the number of subgroup cases were small, the subgroup analysis should be interpreted with caution.
To our knowledge, this is the first study to assess the TOF after small incision phacoemulsification cataract extraction and IOL implantation using electronic Schiotz tonographer, which is the least variable measurement technique compared with other techniques, with documented anterior chamber depth and gonioscopy. We demonstrated that the IOP drop is accounted for by the increase in TOF. However, the exact mechanism of the outflow facility enhancement remains unclear from this study. Further research is needed to elicit this important question.
Acknowledgments
The authors would like to thank Jay W McLaren (Mayo Clinic, Rochester, Minnesota, USA) for allowing us to use his computer program.
Footnotes
Contributors: PA: conception, design, drafting the article, collecting data, drafting the article, analysis and interpretation of data. LBA: collecting data, drafting the article, EG: collecting data, drafting the article, revising the article. DRO: revising the paper, analysis of data and revising the article. KSL: conception, design, revising the article and interpreting data. PA, DRO and KSL were involved in revising the article critically for important intellectual content. All authors read and approved the final revision.
Funding: KSL was supported by a funding at the National Institute for Health Research, Guy’s and St Thomas’ Hospitals Biomedical Research Centre, London, UK.
Competing interests: None declared.
Patient consent: Detail has been removed from this case description/these case descriptions to ensure anonymity. The editors and reviewers have seen the detailed information available and are satisfied that the information backs up the case the authors are making.
Ethics approval: Guy’s and St Thomas Ethics Committee.
Provenance and peer review: Not commissioned; externally peer reviewed.
References
- 1. Merkur A, Damji KF, Mintsioulis G, et al. Intraocular pressure decrease after phacoemulsification in patients with pseudoexfoliation syndrome. J Cataract Refract Surg 2001;27:528–32. 10.1016/S0886-3350(00)00753-7 [DOI] [PubMed] [Google Scholar]
- 2. Mathalone N, Hyams M, Neiman S, et al. Long-term intraocular pressure control after clear corneal phacoemulsification in glaucoma patients. J Cataract Refract Surg 2005;31:479–83. 10.1016/j.jcrs.2004.06.046 [DOI] [PubMed] [Google Scholar]
- 3. Peräsalo R. Phaco-emulsification of cataract in eyes with glaucoma. Acta Ophthalmol Scand 1997;75:299–300. 10.1111/j.1600-0420.1997.tb00778.x [DOI] [PubMed] [Google Scholar]
- 4. Shingleton BJ, Pasternack JJ, Hung JW, et al. Three and five year changes in intraocular pressures after clear corneal phacoemulsification in open angle glaucoma patients, glaucoma suspects, and normal patients. J Glaucoma 2006;15:494–8. 10.1097/01.ijg.0000212294.31411.92 [DOI] [PubMed] [Google Scholar]
- 5. Mansberger SL, Gordon MO, Jampel H, et al. Reduction in intraocular pressure after cataract extraction: the Ocular Hypertension Treatment Study. Ophthalmology 2012;119:1826–31. 10.1016/j.ophtha.2012.02.050 [DOI] [PMC free article] [PubMed] [Google Scholar]
- 6. Slabaugh MA, Bojikian KD, Moore DB, et al. The effect of phacoemulsification on intraocular pressure in medically controlled open-angle glaucoma patients. Am J Ophthalmol 2014;157:26–31. 10.1016/j.ajo.2013.08.023 [DOI] [PubMed] [Google Scholar]
- 7. Pfeiffer N, Garcia-Feijoo J, Martinez-de-la-Casa JM, et al. A randomized trial of a Schlemm’s canal microstent with phacoemulsification for reducing intraocular pressure in open-angle glaucoma. Ophthalmology 2015;122:1283–93. 10.1016/j.ophtha.2015.03.031 [DOI] [PubMed] [Google Scholar]
- 8. Dooley I, Charalampidou S, Malik A, et al. Changes in intraocular pressure and anterior segment morphometry after uneventful phacoemulsification cataract surgery. Eye 2010;24:519–27. 10.1038/eye.2009.339 [DOI] [PubMed] [Google Scholar]
- 9. Lee P-F, Trotter RR. Tonographic and gonioscopic studies before and after cataract extraction. AMA Arch Ophthalmol 1957;58:407–16. 10.1001/archopht.1957.00940010419015 [DOI] [PubMed] [Google Scholar]
- 10. Meyer MA, Savitt ML, Kopitas E. The effect of phacoemulsification on aqueous outflow facility. Ophthalmology 1997;104:1221–7. 10.1016/S0161-6420(97)30154-7 [DOI] [PubMed] [Google Scholar]
- 11. Lim KS, Nau CB, O’Byrne MM, et al. Mechanism of action of bimatoprost, latanoprost, and travoprost in healthy subjects. A crossover study. Ophthalmology 2008;115:790–5. 10.1016/j.ophtha.2007.07.002 [DOI] [PMC free article] [PubMed] [Google Scholar]
- 12. Grant WM. Clinical measurements of aqueous outflow. Arch Ophthal 1951;46:113–31. 10.1001/archopht.1951.01700020119001 [DOI] [PubMed] [Google Scholar]
- 13. Feghali JG, Azar DT, Kaufman PL. Comparative aqueous outflow facility measurements by pneumatonography and Schiotz tonography. Invest Ophthalmol Vis Sci 1986;27:1776–80. [PubMed] [Google Scholar]
- 14. Grant WM. Tonographic method for measuring the facility and rate of aqueous flow in human eyes. Arch Ophthal 1950;44:204–14. 10.1001/archopht.1950.00910020209003 [DOI] [PubMed] [Google Scholar]
- 15. Moghimi S, Johari M, Mahmoudi A, et al. Predictors of intraocular pressure change after phacoemulsification in patients with pseudoexfoliation syndrome. Br J Ophthalmol 2017;101:283–9. 10.1136/bjophthalmol-2016-308601 [DOI] [PubMed] [Google Scholar]
- 16. Arthur SN, Cantor LB, WuDunn D, et al. Efficacy, safety, and survival rates of IOP-lowering effect of phacoemulsification alone or combined with canaloplasty in glaucoma patients. J Glaucoma 2014;23:316–20. 10.1097/IJG.0b013e3182741ca9 [DOI] [PubMed] [Google Scholar]
- 17. Shrivastava A, Singh K. The effect of cataract extraction on intraocular pressure. Curr Opin Ophthalmol 2010;21:118–22. 10.1097/ICU.0b013e3283360ac3 [DOI] [PubMed] [Google Scholar]
- 18. Brooks AM, Gillies WE. The effect of cataract extraction with implant in glaucomatous eyes. Aust N Z J Ophthalmol 1992;20:235–8. [DOI] [PubMed] [Google Scholar]
- 19. Samuelson TW, Katz LJ, Wells JM, et al. Randomized evaluation of the trabecular micro-bypass stent with phacoemulsification in patients with glaucoma and cataract. Ophthalmology 2011;118:459–67. 10.1016/j.ophtha.2010.07.007 [DOI] [PubMed] [Google Scholar]
- 20. Eid TM. Primary lens extraction for glaucoma management: a review article. Saudi J Ophthalmol 2011;25:337–45. 10.1016/j.sjopt.2011.07.004 [DOI] [PMC free article] [PubMed] [Google Scholar]
- 21. Chen PP, Lin SC, Junk AK, et al. The effect of phacoemulsification on intraocular pressure in glaucoma patients: a report by the American Academy of Ophthalmology. Ophthalmology 2015;122:1294–307. 10.1016/j.ophtha.2015.03.021 [DOI] [PubMed] [Google Scholar]
- 22. Kee C, Moon SH. Effect of cataract extraction and posterior chamber lens implantation on outflow facility and its response to pilocarpine in Korean subjects. Br J Ophthalmol 2000;84:987–9. 10.1136/bjo.84.9.987 [DOI] [PMC free article] [PubMed] [Google Scholar]
- 23. Brubaker RF. Goldmann’s equation and clinical measures of aqueous dynamics. Exp Eye Res 2004;78:633–7. 10.1016/j.exer.2003.07.002 [DOI] [PubMed] [Google Scholar]
- 24. Kupfer C, Sanderson P. Determination of pseudofacility in the eye of man. Arch Ophthalmol 1968;80:194–6. 10.1001/archopht.1968.00980050196008 [DOI] [PubMed] [Google Scholar]
- 25. Lee AJ, Saw SM, Gazzard G, et al. Intraocular pressure associations with refractive error and axial length in children. Br J Ophthalmol 2004;88:5–7. 10.1136/bjo.88.1.5 [DOI] [PMC free article] [PubMed] [Google Scholar]
- 26. Guan H, Mick A, Porco T, et al. Preoperative factors associated with IOP reduction after cataract surgery. Optom Vis Sci 2013;90:179–84. 10.1097/OPX.0b013e31827ce224 [DOI] [PubMed] [Google Scholar]
- 27. DeVience E, Chaudhry S, Saeedi OJ. Effect of intraoperative factors on IOP reduction after phacoemulsification. Int Ophthalmol 2017;37:63–70. 10.1007/s10792-016-0230-7 [DOI] [PMC free article] [PubMed] [Google Scholar]
- 28. Wang N, Chintala SK, Fini ME, et al. Ultrasound activates the TM ELAM-1/IL-1/NF-kappaB response: a potential mechanism for intraocular pressure reduction after phacoemulsification. Invest Ophthalmol Vis Sci 2003;44:44. [DOI] [PMC free article] [PubMed] [Google Scholar]
- 29. Tsuboi N, Inoue T, Kawai M, et al. The effect of monocyte chemoattractant protein-1/CC chemokine ligand 2 on aqueous humor outflow facility. Invest Ophthalmol Vis Sci 2012;53:6702–7. 10.1167/iovs.12-10376 [DOI] [PubMed] [Google Scholar]
- 30. Mehdizadeh M. Intraocular pressure after cataract extraction and contractility of ciliary muscle. Am J Ophthalmol 2008;146:628 10.1016/j.ajo.2008.06.032 [DOI] [PubMed] [Google Scholar]
- 31. Zhao Z, Zhu X, He W, et al. Schlemm’s canal expansion after uncomplicated phacoemulsification surgery: an optical coherence tomography study. Invest Ophthalmol Vis Sci 2016;57:6507–12. 10.1167/iovs.16-20583 [DOI] [PubMed] [Google Scholar]
- 32. Lee RY, Chen RI, Kasuga T, et al. The effect of cumulative dissipated energy on changes in intraocular pressure after uncomplicated cataract surgery by phacoemulsification. J Glaucoma 2016;25:565–70. 10.1097/IJG.0000000000000311 [DOI] [PMC free article] [PubMed] [Google Scholar]
Associated Data
This section collects any data citations, data availability statements, or supplementary materials included in this article.
Supplementary Materials
bjophthalmol-2017-311548supp001.pdf (423.7KB, pdf)


