

Abstract
PON1 is a multifunctional enzyme involved in oxidative stress and detoxification of some organophosphate (OP) pesticides. It has been associated with nervous system diseases like Alzheimer’s disease, amyotrophic lateral sclerosis, Parkinson’s disease, and autism. We previously found that PON1 susceptible genotypes were associated with lower IQ scores in children. Epigenetic marks, such as DNA methylation, can regulate gene expression. Yet, data on whether DNA methylation may influence the relationship between PON1 levels and neurobehavior are limited. In this study, we used Illumina 450K and EPIC BeadChip arrays to assess PON1 DNA methylation in blood specimens collected from children (n=238) at birth (cord blood) and age 7 years and examined their relationship with cognitive outcomes. The Wechsler Intelligence Scale for Children was used to assess Full Scale IQ and four composite measures (Verbal Comprehension, Perceptual Reasoning, Working Memory, and Processing Speed Indexes) in 7- year-old children. We observed a consistent yet nonsignificant inverse relationship of methylation at several CpG sites close to the PON1 transcription start site with Full Scale IQ and other composite measures of cognition. We also found an inverse relationship between cord blood methylation at cg15887283 with working memory and a positive association of 7-year-old methylation at cg22798737 with processing speed, independent of OP exposure. However, none of the associations remained significant after accounting for multiple comparisons. This study provides some evidence of the role DNA methylation may play in the known relationship between PON1 and neurobehavior in children, however it appears to be only suggestive and warrants additional research.
Keywords: Epigenetics, cognition, IQ
1. Introduction
The paraoxonase 1 (PON1) gene encodes a multifunctional enzyme that is involved both in detoxification of certain organophosphate (OP) pesticides and oxidative stress pathways (Costa et al. 2013; Li et al. 2003). Studies have implicated oxidative stress as an important mechanism in the pathogenesis of neurodegenerative diseases and developmental programming of neurodevelopmental deficits (Gandhi and Abramov 2012; Wells et al. 2009). PON1 genetic polymorphisms and/or enzyme measurements have been associated with a number of diseases of the nervous system, including Alzheimer’s disease (Erlich et al. 2006; Leduc and Poirier 2008; Paragh et al. 2002), amyotrophic lateral sclerosis,(Saeed et al. 2006; Slowik et al. 2006) Parkinson’s disease (Zintzaras and Hadjigeorgiou 2004), and brain tumors (Kafadar et al. 2006). In children, PON1 enzyme activity levels were lower in children with autism (Pasca et al. 2010; Pasca et al. 2006). Additionally, in a prospective cohort of children (ages 6–9 yr) from New York City, urinary OP metabolite levels were associated with poorer scores in Perceptual Reasoning and Full Scale IQ (FSIQ) only among children whose mothers had the susceptible PON1192 QQ genotype (Engel et al. 2011). We previously found that maternal urinary OP metabolite levels were associated with poorer Bayley Mental Development Index Scores in 2year-olds (Eskenazi et al. 2010) and IQ at age 7 (Eskenazi et al. 2014) among MexicanAmerican children and their mothers from the Center for the Health Assessment of Mothers and Children of Salinas (CHAMACOS) birth cohort. Associations between maternal OP exposure and MDI were strongest in children with the PON1-108T allele. Furthermore, the relationship between OPs and FSIQ was strongest in children of mothers with the lowest tertile of arylesterase (AREase) activity, a measure of PON1 enzyme quantity. We also found a direct relationship of PON1 with neurodevelopment, demonstrating associations of the child PON1-108T allele (the allele linked to lower PON1 activity) with lower MDI scores at age 2 and maternal pregnancy AREase levels with lower WISC scores at age 7. The relationship between PON1 and adverse neurodevelopment likely involves both its ability to detoxify OP pesticides and its role in oxidative stress.
We have reported a broad variability (>100-fold range) of PON1 levels and substratespecific activities among CHAMACOS children and mothers (Furlong et al. 2006; Holland et al. 2006) that could affect differential susceptibility among individuals. Although genetic variants, particularly PON1 promoter polymorphism (PON1-108; rs705379), influence PON1 gene expression and protein levels, they explain less than 25% of the variability of PON1 protein levels (Huen et al. 2010). Epigenetic marks, like DNA methylation, can affect gene expression without changes in DNA sequence. We previously showed that DNA methylation in the PON1 gene can mediate the effect of the PON1-108 genotype on PON1 protein levels (Huen et al. 2015). One recent study reported inverse associations between PON1 DNA methylation in cord blood and cognition in young children aged 2 to 5 years exposed to prenatal mercury (Cardenas et al. 2017) but there is no research examining relationships of PON1 DNA methylation with cognition in older school-aged children when PON1 enzyme levels approach that of adults (Gonzalez et al. 2012; Huen et al. 2010). We hypothesize that increased PON1 DNA methylation levels may detrimentally influence children’s cognitive function. In this study, we examined associations of PON1 DNA methylation in blood assessed at birth and age 7 with children’s cognitive abilities as measured by Wechsler Intelligence Scale for Children (WISC) at age 7.
2. Materials and Methods
2.1. Study subjects
CHAMACOS is a longitudinal birth cohort study of mothers and their children living in the agricultural region of Salinas Valley, California. Pregnant women enrolled in the study (1999–2000) were at least 18 years of age, less than 20 weeks gestation, Spanish- or Englishspeaking, eligible for low-income health insurance, receiving prenatal care at one of the participating community clinics, and planning to deliver at the local public hospital. Six hundred and one pregnant women were enrolled and 526 remained in the study at delivery of live, singleton newborns (Eskenazi et al. 2003). In this study, we restricted analysis to children who had blood samples available for analysis at birth (cord blood) and/or age 7 years and who also completed neurobehavioral assessments at age 7 years. In total, 238 children were included in the analysis. Of these, 185 had methylation data at both time points and 53 children had methylation data available at birth only. Children included in the study did not differ from all children in the cohort by other demographic and exposure variables (e.g. poverty level, maternal marital status, or maternal prenatal farm work status, maternal OP urinary metabolite levels, or use of alcohol or tobacco).
Study protocols were approved by the University of California, Berkeley and the Centers for Disease Control and Prevention (CDC) Committees for the Protection of Human Subjects. Written informed consent was obtained from all mothers, and children provided verbal assent at age 7.
2.2. Blood collection and processing
Blood specimens from CHAMACOS children were collected from umbilical cords after delivery and by venipuncture when children were approximately 7 years old. Heparinized whole blood was collected in BD vacutainers® (Becton, Dickinson and Company, Franklin Lakes, NJ). Samples were then centrifuged, separated into aliquots of plasma, buffy coats and red blood cells, and then stored at −80°C at the School of Public Health Biorepository, University of California, Berkeley. Whole blood was also collected in BD vacutainers® (Becton, Dickinson and Company, Franklin Lakes, NJ) containing no anticoagulant. These samples were centrifuged, divided into serum and clot, and then stored at –80°C.
2.3. Bisulfite treatment and DNA methylation analyses
DNA isolation from clots was performed using a QIAamp Blood DNA Maxi kit (Qiagen, Inc., Santa Clarita, CA) as previously described (Holland et al. 2006). DNA was normalized to 55 ug/ml and bisulfite conversion was performed on 1ug aliquots of DNA using Zymo Bisulfite conversion Kits (Zymo Research, Orange, CA). Methylation levels at 18 PON1 CpG sites in cord blood were analyzed as part of a genome-wide methylation assessment using the Illumina Infinium 450K DNA methylation BeadChip as previously described (Huen et al. 2015). The EPIC BeadChip is the most recently released version of Illumina’s methylation array and replaces the previous 450K BeadChip. It covers >90% of the CpG sites assessed by 450K and extends coverage to an additional >400,000 sites. The EPIC BeadChip, was used to assess DNA methylation in samples collected from 7-year-old children because the 450K BeadChip was no longer available at the time of the experiment. EPIC includes 19 PON1 CpG sites, 15 of which were also included in the 450K BeadChip. All PON1 CpG sites assessed by either platform are shown graphically in Figure 1 and described in Supplemental Table 1. Pidsley et al. reported that methylation levels assessed by EPIC and 450K BeadChip arrays were very highly correlated with Spearman Rank Correlation coefficients of 0.99 and it was suggested that data from the two platforms could easily be integrated for analysis (Pidsley et al. 2016). We recently reported similar findings in CHAMACOS children (Solomon et al. In Press) finding a strong correlation of overall methylation between both platforms. However, correlations at individual CpG sites, including those located in the PON1 gene, tended to be weaker (Pearson’s r: 0.02–0.18) at the extreme levels of methylation (highly methylated or highly unmethylated) compared to moderately methylated CpG sites (Pearson’s r: 0.27–0.59). When we assessed differential methylation by sex using data from both assays, we confirmed good reproducibility, replicating the majority of significant hits with correlated effect sizes between platforms.
Figure 1. Schematic of the PON1 gene.
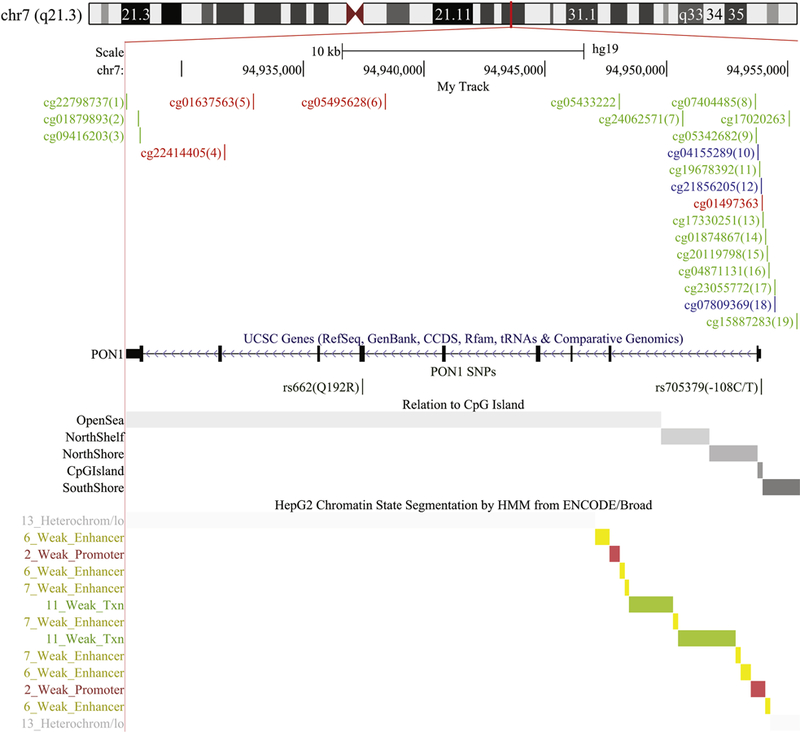
Locations of PON1 CpG sites are in indicated in green (sites assessed by 450K and EPIC), red (sites assessed by EPIC only), and blue (sites assessed by 450K only). Common SNPs PON1-108 and PON1192 are also shown. The grey shaded areas indicate the regions in relation to the CpG island: open sea, shelves, shores, and island. Epigenetic states in liver cells as predicted by ChromHMM are shown in the bottom panel.
DNA samples were whole genome amplified, enzymatically fragmented, purified, and applied to the Infinium BeadChips according to the Illumina methylation protocol (Bibikova et al. 2011; Pidsley et al. 2016; Sandoval et al. 2011). BeadChip processing was performed using robotics and the Illumina Hi-Scan system was used for analysis. Samples included in the analysis had detection p-values below 0.01 for 95% of CpG sites. Three PON1 CpG sites (2 in 450K and 3 in EPIC) with common SNPs (minor allele frequency >5%) within 50bp of the target identified in the MXL (Mexican ancestry in Los Angeles, California) HapMap population were excluded, resulting in a total of 16 450K and 16 EPIC PON1 CpG sites included in the subsequent analyses. Raw signal intensities were background corrected and then normalized for colorchannel bias using the All Sample Mean Normalization (ASMN) method as described previously by Yousefi et al (2013). We also applied beta mixture quantile (BMIQ) normalization to make interpretation between type I and type II probes comparable (Teschendorff et al. 2013). Methylation data were expressed as M-values, which are calculated as the log2 ratio of the intensities of methylated to unmethylated probes (Du et al. 2010). Quality assurance procedures included use of repeats and internal standards to minimize technical variability.
2.4. Cell Composition
Cell type proportions were calculated in the R-package minfi (Aryee et al. 2014). For cord blood samples, we estimated cell-type proportions using a recently published cord blood reference dataset that included nucleated red blood cells (Bakulski et al. 2016). For blood samples collected from seven-year-old-children, we used an adult reference data set (Houseman et al. 2012).
2.5. Determination of PON1-108 genotype
The promoter SNP, PON1-108, was genotyped using a fluorogenic allele-specific assay (Amplifluor, Chemicon, Temecula, CA). The assay used a two-part nested PCR strategy where the region surrounding the SNP was pre-amplified using non-allelic flanking primers and then the amplicon was diluted and used as the template for the Amplifluor assay. Quality assurance procedures for genotyping of this SNP included assessment of randomly distributed blank samples in each plate and duplicates of randomly selected samples (4% of samples) with independently isolated DNA from the same subjects. We observed a high degree (>99%) of concordance among repeated samples. All discrepancies were resolved with additional genotyping.
2.6. Determination of PON1 arylesterase activity in blood of newborns and 7-year old children
The AREase assay, which measures the rate of phenyl acetate hydrolysis in plasma, is considered a reliable measure of PON1 enzyme quantity. The assay uses spectrophotometric methods as described previously (Richter and Furlong 1999) and is highly correlated (r > 0.85) with other measures of PON1 quantity such as ELISA and Western blot based methods utilizing PON1 antibodies (Connelly et al. 2008; Kujiraoka et al. 2000). All assays were performed in triplicate. Quality assurance included use of internal controls (aliquots of the same sample run on all assay plates) and assessment of repeat samples (separate aliquots of the same sample run on different days) (2009b). The average inter assay coefficient of variation (CV) for internal controls run on all assay plates was 8.7%.
2.7. Assessment of neurobehavioral outcomes
Children’s cognition was assessed at age 7 as previously described (Eskenazi et al. 2010; Stein et al. 2016). Children’s cognitive abilities were determined using the Wechsler Intelligence Scale for Children – Fourth Edition (WISC-IV)(Wechsler 2003) and its Spanish equivalent (Wechsler 2005). All assessments were performed by the same bilingual psychometrician, who was trained and supervised by a pediatric neuropsychologist. They were administered in the dominant language of the child, which was determined by an oral vocabulary subtest (Woodcock and A. 1990). The WISC-IV provides a Full Scale IQ score that reflects overall performance on the subtests presented. It also generates four standardized composite measures: Verbal Comprehension Index (VCI), Perceptual Reasoning Index (PRI), Working Memory Index (WMI), and Processing Speed Index (PSI). All Wechsler composite scores (e.g., VCI, FSIQ) are standardized by age to a mean of 100 (SD: 15).
Maternal education at enrollment and verbal comprehension were assessed via maternal interview at enrollment and by assessment using the Peabody Picture Vocabulary Test - Revised (PPVT) (Dunn and Dunn 1981) or its Spanish adaptation (Dunn et al. 1986) at six months postpartum, respectively.
2.8. Organophosphate pesticide exposure measurements
Six non-specific dialkyl phosphate (DAP) metabolites were measured in maternal urine collected twice during pregnancy around 13 and 26 weeks gestation as previously described (Eskenazi et al. 2014). These DAP metabolites were comprised of three dimethyl (DM) phosphate metabolites (dimethylphosphate, dimethylthiophosphate, dimethyldithiophosphate) and three diethyl (DE) phosphate metabolites (diethylphosphate, diethylthiophosphate, and diethyldithiophosphate) (Bradman et al., 2005). Additional details on urine collection, limits of detection for each metabolite, and quality control measures are described elsewhere (Bradman et al. 2005). DAP metabolites were measured using gas chromatography-tandem mass spectrometry and quantified using isotope dilution calibration (Bravo et al., 2002). Concentrations below the limit of detection (LOD) were randomly imputed based on a log-normal probability distribution, estimated using maximum likelihood estimation, and molar concentrations were summed to yield total DM, total DE, and total DAP concentrations (nmoles/L). Detection frequencies for total DM, total DE, and total DAP concentrations were 80.2, 74.3, and 88.5% at 13 wks gestation and 99.6, 98.8, and 100.0% at 26 weeks gestation.
2.9. Statistical analysis
We performed linear regression models to determine the relationship of PON1 DNA methylation at birth and age 7 years with (1) AREase activity and (2) measures of cognition. Separate models were constructed for each CpG site at each age for AREase activity and each neurodevelopment outcome. Models of PON1 DNA methylation and AREase activity were adjusted for batch and cell composition. All models of PON1 DNA methylation and neurodevelopment were adjusted for maternal education, maternal verbal cognition scores, batch, and cell composition. We chose to control for covariates used in our previous studies of maternal OP exposure, PON1, and cognition (Eskenazi et al. 2014) and also added cell composition since it can be a source of bias in DNA methylation studies. Additionally, we used linear regression models to examine associations of mean pregnancy OP metabolites (log 10 transformed DE, DM, and total DAPs) with DNA methylation at each PON1 CpG site controlling for cell composition. For CpG sites with suggestive association with both OP metabolite concentrations and cognition outcomes, we used the PARAMED module (Emsley and Liu 2013)to do mediation analyses. We also performed secondary analyses which included running the same models with (1) stratification by sex, (2) adjustment for child PON1-108 genotype, (3) stratification by maternal AREase activity, and (4) stratification by maternal PON1-108 genotype. Controlling for PON1-108 genotype should yield estimates of the relationship of methylation and cognition independent of the relationship between genotype and cognition. Unadjusted p-values < 0.05 were considered significant. However, to account for multiple testing, we also used the Benjamini-Hochberg (BH) method for false discovery rate (FDR) with an FDR q < 0.05 threshold for significance (Benjamini and Hochberg 1995). Statistical analyses were performed in STATA (version 12.0; StataCorp, College Station, TX). Power and sample size calculations were estimated using PS: Power and Sample Size Calculation version 3.1.2, 2014 (Dupont and Plummer 1998).
3. Results
Characteristics of CHAMACOS mothers and their children are shown in Table 1. The average maternal age at enrollment was 25.7 years (SD = 5.0). The majority of mothers (79%) had less than a high school education and nearly all lived within 200% of the poverty level. Maternal verbal comprehension scores assessed by PPVT ranged from 42 to 120 with an average of 86 (SD=20.6). There were slightly more girls (n=125) than boys (n=113) included in this study. On average, children were assessed at 7.1 years of age (SD=0.22). The majority of children (67%) were tested in Spanish while all other children were tested in English at the 7 year visit. The average WISC Full-Scale IQ in 7-year old children was 104.1 (SD = 15.2). The geometric mean of the average total DAP, DM and DE concentrations in maternal urine during pregnancy was 124.6 nmol/L, 90.6 nmol/L and 20.3 nmol/L, respectively (Supplemental Table 2). As previously reported, average prenatal urinary DAP concentrations in the CHAMACOS population are higher than those observed in the general U.S. population (Bradman et al. 2005).
Table 1.
Characteristics of CHAMACOS Mothers and Children
| n(%) | Mean (SD) | |
|---|---|---|
|
Maternal Characteristics Maternal Education <6th grade |
111(45) | |
| 7th-12th grade | 82(34) | |
| Completed high school | 52(21) | |
| Poverty level during pregnancy <Poverty level |
147(60) | |
| Within 200% of poverty level | 90(37) | |
| >200% poverty level | 8(3) | |
| Maternal age at baseline 18–24 | 106(43) | |
| 25–29 | 88(36) | |
| 30–34 | 35(14) | |
| 35–45 | 16(7) | |
| Maternal intelligence (PPVT Score) | 85.9(20.7) | |
| Child Characteristics | ||
| Sex | ||
| Boy | 117(48) | |
| Girl | 128(52) | |
| Gestational Age (wks) | 38.9(1.4) | |
| Child Age at 7-year assessment (yr) | 7.1(0.2) | |
| Language of 7-year WISC testing | ||
| English | 167(68) | |
| Spanish | 78(32) |
3.1. PON1 DNA Methylation
DNA methylation in PON1 CpG sites among CHAMACOS newborns and 7-year old children is shown in Figure 2. We observed similar patterns of methylation at both ages as was previously described in CHAMACOS newborns (Huen et al. 2015). Specifically, CpG sites in the Open Sea and North Shelf regions (CpG Sites 1 to 7) had very high levels of methylation, with average β values at these sites ranging from 0.84–0.90 and 0.91 to 0.99 in cord and 7-year old blood, respectively. Furthermore, CpG sites that were closer in proximity to the transcription start site (TSS) (CpG Sites 8 to 15) had lower levels of methylation with β’s averaging from 0.51 to 0.77 and 0.53 to 0.66, in cord and age 7 blood, respectively.
Figure 2. Box plots showing the distribution of methylation betas in cord blood and in 7- year old children.
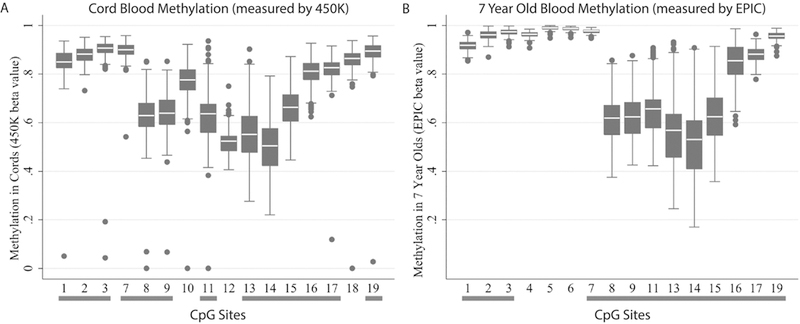
PON1 DNA methylation in (a) cord blood measured by 450K and (b) 7-year old children measured by EPIC. Methylation levels are shown as beta values for ease of interpretation. At both ages, CpG sites 1 to 8 and 16 to 19 are highly methylated, while methylation levels are lower in CpG sites 8 to 15. CpG sites common to both 450K and EPIC assays are indicated with a grey bar underneath. CpG sites 4, 5, and 6 were not shown in (a) because they were not assessed by 450K and sites 10 and 18 were not shown in (b) because they were not assessed by EPIC.
To confirm the relationship of PON1 DNA methylation with gene expression at the protein level, we examined associations of methylation at each CpG site with AREase activity. Mean AREase activity (Supplemental Table 3) was lowest in newborns (34.8 U/mL) and higher in 7-year old children and their mothers (123.1 and 126 U/mL, respectively), which has been described extensively in CHAMACOS children and mothers elsewhere (Holland et al. 2006; Huen et al. 2010). As in previous analyses (Huen et al. 2015), cord blood methylation at sites close to the TSS (CpG sites 8 to 15) were inversely associated with AREase activity after controlling for cell composition and batch. The relationship of 7-year old methylation with 7year old AREase activity were similar for CpG sites 8 to 15 however the associations were much stronger with larger beta coefficients and much smaller p-values (Table 2), a trend we also previously reported in 9-year old CHAMACOS children (Huen et al. 2015). In contrast, however, methylation of CpG site 19 in 7-year old children was positively associated with AREase activity (β(95%CI): 9.54(1.53,17.5)).
Table 2.
Relationship of 7-year old blood PON1 DNA methylation and 7–year old AREase activity (U/mL)
| CpG Site Number | β(95%CI) | p-value |
|---|---|---|
| 1 | 6.31(−5.68,18.30) | 0.30 |
| 2 | 3.01(−2.28,8.31) | 0.26 |
| 3 | 6.51(−0.06,13.10) | 0.05 |
| 4 | −0.40(−11.40,10.60) | 0.94 |
| 5 | 0.61(−3.46,4.68) | 0.77 |
| 6 | 7.64(1.72,13.60) | 0.01 |
| 7 | −0.41(−10.10,9.33) | 0.93 |
| 8 | −19.60(−26.50,−12.80) | 5.68E-08 |
| 9 | −20.00(−27.10,−12.90) | 9.25E-08 |
| 11 | −15.10(−20.50,−9.59) | 1.75E-07 |
| 13 | −11.10(−14.90,−7.22) | 5.67E-08 |
| 14 | −12.00(−16.00,−8.03) | 1.28E-08 |
| 15 | −14.10(−19.10,−8.97) | 1.71E-07 |
| 16 | −9.80(−13.50,−6.08) | 5.48E-07 |
| 17 | −3.85(−14.10,6.43) | 0.46 |
| 19 | 9.54(1.53,17.50) | 0.02 |
All models adjusted for cell composition and batch.
Methylation in 7-year old blood samples were assessed by EPIC BeadChip. CpG sites 10 and 18 are not shown because they were not assessed by EPIC.
2.2. Cord blood PON1 DNA methylation and neurodevelopment
The relationships of cord blood DNA methylation with cognition in 7-year-old children are shown in Table 3. DNA methylation at CpG site 19 was positively associated with verbal comprehension (β(95%CI): 7.6(0.10,15.0)) and similar trends were observed with working memory and FSIQ. Additionally, we observed a consistent overall trend among CpGs close to the TSS (sites 8 to 15). Their methylation levels were inversely associated with Full Scale IQ as well as the four composite measures (verbal comprehension, perceptual reasoning, working memory, and processing speed). However, none of these relationships reached statistical significance. Stratification by sex did not appreciably change results (Supplemental Tables 4 and 5).
Table 3.
Regression models of cord blood PON1 DNA methylation and WISC-IV IQ at age 7 years
| Verbal Comprehension n=231 | Perceptual Reasoning n=232 | Working Memory n= 213 | Processing Speed n=214 | Full Scale IQ n=211 | ||||||
|---|---|---|---|---|---|---|---|---|---|---|
| CpG Site Number | β(95%CI) | p-value | β(95%CI) | p-value | β(95%CI) | p-value | β(95%CI) | p-value | β(95%CI) | p-value |
| 1 | 5.18(−3.83,14.20) | 0.26 | 0.65(−7.30,8.61) | 0.87 | 5.00(−2.04,12.00) | 0.16 | −0.60(−7.40,6.20) | 0.86 | 3.56(−4.13,11.20) | 0.36 |
| 2 | 2.03(−6.51,10.58) | 0.64 | −0.81(−8.31,6.69) | 0.83 | −4.66(−11.20,1.88) | 0.16 | −1.57(−7.98,4.85) | 0.63 | −1.40(−8.67,5.86) | 0.70 |
| 3 | 2.24(−6.36,10.84) | 0.61 | 2.16(−5.39,9.71) | 0.57 | 3.98(−2.62,10.60) | 0.24 | −0.84(−7.20,5.53) | 0.80 | 2.53(−4.68,9.75) | 0.49 |
| 7 | 6.62(−3.07,16.30) | 0.18 | −0.17(−8.72,8.37) | 0.97 | −0.37(−8.05,7.31) | 0.92 | 0.61(−6.83,8.04) | 0.87 | 3.90(−4.51,12.30) | 0.36 |
| 8 | −3.52(−9.29,2.26) | 0.23 | −1.18(−6.29,3.93) | 0.65 | −0.09(−4.57,4.39) | 0.97 | −1.60(−5.86,2.66) | 0.46 | −2.32(−7.18,2.54) | 0.35 |
| 9 | −2.97(−8.41,2.48) | 0.28 | 0.05(−4.75,4.85) | 0.98 | −0.17(−4.42,4.09) | 0.94 | −1.15(−5.14,2.85) | 0.57 | −1.46(−6.07,3.14) | 0.53 |
| 10 | −3.96(−8.81,0.88) | 0.11 | −2.09(−6.41,2.23) | 0.34 | −2.31(−6.09,1.47) | 0.23 | −0.68(−4.35,2.99) | 0.72 | −3.17(−7.24,0.91) | 0.13 |
| 11 | −1.45(−4.99,2.08) | 0.42 | −1.07(−4.20,2.07) | 0.50 | −0.15(−2.93,2.64) | 0.92 | −0.85(−3.48,1.77) | 0.52 | −1.29(−4.29,1.71) | 0.40 |
| 12 | −4.51(−12.40,3.42) | 0.26 | −2.11(−9.10,4.88) | 0.55 | −0.36(−6.65,5.94) | 0.91 | −2.56(−8.51,3.39) | 0.40 | −4.08(−10.90,2.73) | 0.24 |
| 13 | −1.57(−4.81,1.68) | 0.34 | −0.80(−3.66,2.06) | 0.58 | −0.12(−2.66,2.42) | 0.93 | −0.69(−3.08,1.71) | 0.57 | −1.24(−3.98,1.51) | 0.38 |
| 14 | −1.79(−5.19,1.62) | 0.30 | −1.29(−4.29,1.71) | 0.40 | −0.52(−3.19,2.14) | 0.70 | −0.56(−3.14,2.01) | 0.67 | −1.59(−4.46,1.28) | 0.28 |
| 15 | −2.15(−6.96,2.66) | 0.38 | 0.030(−4.23,4.28) | 0.99 | 0.32(−3.41,4.06) | 0.86 | −1.38(−4.98,2.22) | 0.45 | −1.23(−5.27,2.82) | 0.55 |
| 16 | −3.47(−8.74,1.79) | 0.20 | −1.49(−6.14,3.16) | 0.53 | −0.01(−4.10,4.08) | 0.99 | 0.34(−3.62,4.29) | 0.87 | −1.57(−5.99,2.85) | 0.49 |
| 17 | −8.51(−18.60,1.60) | 0.10 | −0.90(−9.85,8.05) | 0.84 | −2.66(−10.90,5.53) | 0.52 | −0.57(−8.43,7.29) | 0.89 | −4.02(−12.90,4.87) | 0.37 |
| 18 | −4.05(−11.90,3.80) | 0.31 | −2.09(−8.99,4.82) | 0.55 | −1.10(−7.23,5.02) | 0.72 | −1.22(−7.20,4.76) | 0.69 | −2.27(−8.88,4.34) | 0.50 |
| 19 | 7.57(0.09,15.00) | 4.70 E-02 | 2.97(−3.63,9.58) | 0.38 | 5.58(−0.31,11.50) | 0.06 | 2.22(−3.45,7.88) | 0.44 | 6.32(−0.07,12.70) | 0.05 |
All models adjusted for maternal education, maternal scores for verbal cognition, and cell composition, and batch.
Unadjusted p-values <0.05 are bolded.
None of the associations remained significant after controlling for FDR.
Methylation in cord blood samples were assessed by 450K BeadChip. CpG sites 4,5, and 6 are not shown because they were not assessed by 450K.
Given that PON1 DNA methylation in sites 8 to 15 can mediate the effect of the PON1108 genotype on expression (Huen et al. 2015), we also performed regression models controlling for PON1-108 genotype to identify relationships of methylation with cognition that were independent of this promoter SNP. These results are shown in Supplemental Table 6. DNA methylation at CpG site 10 (located in the PON1 CpG Island) was negatively associated with working memory after controlling for potential confounders and PON1-108 genotype (β(95%CI):5.14(−9.70,−0.57). The direction of effect was the same for other CpG sites located near the TSS (CpG sites 8 to 15) although these associations did not reach statistical significance. All of the associations observed between cord PON1 DNA methylation and IQ scores were no longer significant after accounting for multiple comparisons using the FDR.
We previously found that relationships of maternal OP exposure with child cognition were modified by maternal AREase activity. Therefore, we also performed models of PON1 DNA methylation and child cognition stratified by maternal PON1 factors (AREase activity during pregnancy and maternal PON1-108 genotype). We found suggestive evidence of an interaction between cord blood DNA methylation and maternal AREase activity on cognition for several CpG sites including sites 9, 10, 11, and 16 (Supplemental Table 7). In the stratified models, we observed a consistent trend of positive associations of DNA methylation with cognition in children with low maternal AREase activity and inverse associations in children with high maternal AREase activity. Trends were similar but weaker in the model stratifying by PON1-108 genotype (Supplemental Table 8) where relationships of PON1 DNA methylation were positive in children with the maternal PON1-108CC genotype (higher expression genotype) and negative in those with maternal PON1-108CT and PON1-108TT genotypes (lower expression genotypes). None of these associations remained significant after accounting for multiple comparisons however.
2.3. 7 year old PON1 DNA methylation and neurodevelopment
Results from the regression models performed for 7-year-olds’ DNA methylation and cognition are shown in Table 4. Higher methylation levels at CpG site 1 were associated with higher processing speed scores (β(95%CI): 6.5(0.6,12.4)). Similar to findings for cord blood methylation, we also observed a consistent though nonsignificant inverse relationship between methylation levels at sites 8 to 15 with Full Scale IQ as well as with all four composite scores. Results remained similar after stratification by sex (Supplemental Tables 9 and 10). However, the positive association of CpG site 1 was stronger in girls. Furthermore, in boys, we observed a positive association of CpG site 6 with verbal comprehension and Full-Scale IQ scores as well as negative association of CpG site 17 with perceptual reasoning scores. After controlling for PON1-108 genotype (Supplemental Table 11), the positive association of PON1 CpG site 1 (cg22798737) with processing speed persisted (β(95%CI):6.57(0.45,12.69). However, none of the associations observed remained significant after controlling for FDR.
Table 4.
Regression models of 7-year blood PON1 DNA methylation and WISC-IV IQ at age 7 years
| Verbal Comprehension n=179 | Perceptual Reasoning n=179 | Working Memory n= 167 | Processing Speed n=167 | Full Scale IQ n=167 | ||||||
|---|---|---|---|---|---|---|---|---|---|---|
| CpG Site Number | beta(95%CI) | p-value | beta(95%CI) | p-value | beta(95%CI) | p-value | beta(95%CI) | p-value | beta(95%CI) | p-value |
| 1 | 6.30(−1.36,14.00) | 0.11 | 2.52(−4.47,9.51) | 0.48 | 2.83(−3.16,8.82) | 0.35 | 6.50(0.56,12.40) | 0.03 | 4.41(−2.23,11.10) | 0.19 |
| 2 | −1.22(−4.74,2.31) | 0.50 | −1.33(−4.51,1.85) | 0.41 | −1.71(−4.43,1.02) | 0.22 | −0.83(−3.56,1.90) | 0.55 | −1.96(−4.97,1.06) | 0.20 |
| 3 | 3.12(−0.99,7.24) | 0.14 | −0.07(−3.82,3.68) | 0.97 | 1.98(−1.31,5.27) | 0.24 | 1.95(−1.31,5.21) | 0.24 | 1.52(−2.11,5.14) | 0.41 |
| 4 | 2.50(−4.03,9.02) | 0.45 | 1.46(−4.48,7.41) | 0.63 | −0.69(−5.69,4.31) | 0.79 | −0.87(−5.86,4.13) | 0.73 | 0.26(−5.24,5.76) | 0.93 |
| 5 | −0.04(−2.70,2.62) | 0.98 | −0.70(−3.12,1.72) | 0.57 | −0.36(−2.45,1.73) | 0.73 | 0.42(−1.62,2.46) | 0.69 | −0.65(−2.92,1.63) | 0.57 |
| 6 | 2.26(−1.22,5.74) | 0.20 | 0.01(−3.17,3.19) | 1.00 | 0.93(−1.77,3.63) | 0.50 | 1.80(−0.86,4.47) | 0.18 | 1.28(−1.69,4.24) | 0.40 |
| 7 | 2.84(−3.45,9.13) | 0.38 | 1.75(−3.97,7.47) | 0.55 | −0.74(−5.67,4.19) | 0.77 | 0.00(−4.78,4.78) | 0.76 | 1.34(−4.07,6.74) | 0.17 |
| 8 | −0.25(−4.69,4.18) | 0.91 | −1.61(−5.63,2.42) | 0.43 | −0.72(−4.11,2.66) | 0.67 | −1.74(−5.06,1.59) | 1.00 | −1.50(−5.20,2.20) | 0.63 |
| 9 | −1.57(−6.32,3.18) | 0.51 | −1.83(−6.18,2.51) | 0.41 | −1.21(−4.88,2.47) | 0.52 | −1.92(−5.54,1.69) | 0.30 | −2.49(−6.50,1.52) | 0.43 |
| 11 | −1.15(−4.71,2.41) | 0.52 | −1.50(−4.73,1.73) | 0.36 | −1.28(−4.00,1.43) | 0.35 | −1.83(−4.50,0.84) | 0.30 | −1.80(−4.78,1.17) | 0.22 |
| 13 | −0.97(−3.66,1.71) | 0.48 | −0.39(−2.83,2.05) | 0.75 | −0.66(−2.73,1.41) | 0.53 | −1.45(−3.47,0.58) | 0.18 | −1.08(−3.34,1.19) | 0.23 |
| 14 | −0.53(−3.14,2.07) | 0.69 | −1.31(−3.67,1.05) | 0.28 | −0.80(−2.80,1.19) | 0.43 | −1.19(−3.15,0.77) | 0.16 | −1.25(−3.44,0.93) | 0.35 |
| 15 | −0.77(−4.26,2.71) | 0.66 | −1.06(−4.21,2.09) | 0.51 | −0.73(−3.39,1.94) | 0.59 | −1.28(−3.90,1.33) | 0.23 | −1.33(−4.24,1.59) | 0.26 |
| 16 | −0.17(−2.58,2.24) | 0.97 | −0.69(−2.88,1.50) | 0.54 | −0.85(−2.70,1.00) | 0.37 | −0.94(−2.77,0.88) | 0.33 | −0.85(−2.88,1.18) | 0.37 |
| 17 | 0.13(−6.23,6.49) | 0.97 | −2.87(−8.64,2.90) | 0.33 | −2.56(−7.48,2.36) | 0.31 | −2.52(−7.39,2.35) | 0.31 | −2.32(−7.74,3.10) | 0.41 |
| 19 | −3.65(−8.62,1.33) | 0.15 | −1.14(−5.69,3.41) | 0.62 | −0.16(−4.06,3.74) | 0.94 | 0.64(−3.18,4.46) | 0.31 | −2.30(−6.56,1.96) | 0.40 |
All models adjusted for maternal education, maternal scores for verbal cognition, cell composition, and batch.
None of the associations remained significant after controlling for FDR
Methylation in 7-year old blood samples were assessed by EPIC BeadChip. CpG sites 10 and 18 are not shown because they were not assessed by EPIC.
2.4. Mediation analysis of OPs, PON1 DNA methylation, and child cognition
We previously reported that urinary DAP concentrations during pregnancy were, at varying degrees, associated with poorer working memory, processing speed, verbal comprehension, perceptual reasoning and full-scale IQ scores in 7-year old children (Bouchard et al. 2011). Therefore, to consider whether PON1 DNA methylation mediates the relationship of prenatal OP exposure on child cognition, we performed mediation analysis (Supplemental Table 12) for PON1 CpG sites that were at least marginally associated both with prenatal DAP concentrations and 7-year cognition outcomes (Supplemental Tables 13 and 14). We found evidence of a direct effect of prenatal diethyl DAPs on verbal comprehension IQ (Controlled Direct Effect estimate (95%CI):−5.2(−10.1, −0.2) but no statistically significant indirect effect of cord blood methylation at CpG site 19 suggesting that PON1 DNA methylation at site 19 does not mediate the relationship of prenatal OP exposure on child cognition in 7-year old children. We did not find evidence of a significant direct effect of total DAP concentrations on processing speed IQ but we did observe a significant indirect effect (estimate (95%CI):−0.42(−1.77,−0.002) of 7-year old blood methylation at CpG site 1, suggesting that the relationship of methylation at CpG site 1 with processing speed is independent of prenatal OP exposure.
3. Discussion
In this study, we sought to explore whether epigenetic marks, specifically DNA methylation, play a role in the relationship between PON1 and child cognition. Previously, we reported that maternal PON1 levels and prenatal exposure to OPs were associated with child IQ at age 7 in the same cohort (Eskenazi et al. 2014). In the current study, we identified one PON1 CpG site for which increasing cord methylation levels were related with higher verbal comprehension IQ and one CpG site at age 7 which was positively associated with processing speed IQ. However, neither relationship remained statistically significant after controlling for multiple comparisons. Furthermore, CpG sites close to the TSS showed a consistent yet nonsignificant inverse relationship with FSIQ and other composite measures of cognition. Our data provide some suggestive evidence linking PON1 DNA methylation with child IQ.
In our previous molecular studies of PON1 in the CHAMACOS cohort, we found that PON1 enzyme levels were most highly influenced by age and genetics (Holland et al. 2006; Huen et al. 2010; Huen et al. 2009a). However, these factors explained only a portion of the variability of PON1 enzyme levels. More recently, we reported highly significant associations of PON1 DNA methylation both with PON1 genotype and with PON1 enzyme levels measured by AREase activity in newborns and 9-year old children and provided evidence that the relationship of PON1-108 genotype on AREase activity may be mediated through PON1 DNA methylation (Huen et al. 2015). In this study, we observed similar relationships of PON1 DNA methylation with AREase activity in 7-year old children. We also expanded upon our previous studies and identified suggestive evidence of associations between PON1 DNA methylation with child cognition, including some that were independent of child PON1-108 genotype.
Only one other study has examined PON1 DNA methylation in relation to children’s cognition. Cardenas and colleagues identified an inverse association between cord blood PON1 DNA methylation at four CpG sites (sites 9 and 12–14) and Peabody Picture Vocabulary Test (PPVT) scores in 135 boys of different races or ethnicities (77% White, 9% Black, and 7% Hispanic, 7% Other) during early childhood (ages 2 to 5 years) although they did not account for multiple comparisons (Cardenas et al. 2017). PPVT scores have previously been strongly correlated with verbal and Full Scale IQ scores (Dunn L et al. 1997). In our study conducted in older children (age 7 years), we used WISC-IV to assess cognition and also observed an inverse relationship between PON1 DNA methylation and cognition scores at the same CpG sites reported by Cardenas and colleagues, but the associations did not reach statistical significance. Neither study (ours or Cardenas et al.) observed differences in the association of PON1 DNA methylation with cognition by sex.
Our study was also one of the first to examine the role of PON1 DNA methylation as a potential mediator of OP exposure on children’s cognitive outcomes. For CpG site19, cord blood methylation did not appear to mediate the relationship of prenatal diethyl DAPs on verbal comprehension scores. Instead, the total effect seemed primarily driven by prenatal OP exposure. In contrast, we identified a significant natural indirect effect of 7-year old blood methylation at CpG site 1 on processing speed while the direct effect of prenatal total DAPs was not statistically significant. In this case, the relationship of CpG site 1 methylation with cognition did not seem to be related to prenatal OP exposure. PON1 however is a multifunctional enzyme, and the relationship of site 1 methylation with cognition may very well involve a different pathway such as oxidative stress.
Although we did identify two CpG sites that were associated with cognitive outcomes in school-age children, neither relationship remained statistically significant after adjusting for multiple comparisons. For cord blood methylation at CpG site 19, our post-hoc power calculations show we would have greater than 80% power to detect differences in verbal comprehension scores of 7 points given our study sample size of 231, suggesting that our study was adequately powered and the relationship identified was likely non-significant. In contrast, for 7-year old methylation at CpG site 1, we calculated that a sample size of 373 would be needed to detect differences in processing speed IQ scores of about 6 points with 80% power, indicating that our study (n=167) may have been slightly underpowered to detect a statistically significant association in this case. Thus, it is possible that this association could reach statistical significance in a larger study.
This study does have several limitations. Given that DNA methylation is tissue-specific, examination of blood rather than brain tissue may not be the most relevant for neurodevelopmental outcomes, in spite of observed relationships between cord blood methylation and cognitive outcomes in study by Cardenas et al. (2017). Furthermore, tissue specificity may be less of an issue for a metabolic enzyme like PON1, which is known to circulate in the bloodstream as opposed to a protein specific to the brain (e.g. GABA receptors or neurotransmitter reuptake proteins). Additionally, free radicals circulate in blood through the body -- including the brain -- affecting levels of oxidative stress, an important mechanism through which PON1 can affect neurodevelopment in children. Another limitation related to tissue-specificity is that although we examined PON1 DNA methylation in blood samples, plasma PON1 is primarily synthesized in the liver suggesting that blood methylation may not be the most relevant measure for PON1. However, we found strong associations of PON1 DNA methylation in blood with AREase activity, a measure of plasma protein levels, which should be reflective of liver expression. We did not determine associations of PON1 DNA methylation with gene expression. However, we did demonstrate relationships of PON1 DNA methylation at several CpG sites with AREase activity, a well-known marker of PON1 protein expression, providing evidence for the functional significance of PON1 DNA methylation. Finally, this study was performed in a Mexican- American cohort living in an agricultural region and may not be fully generalizable to the general population.
This study provides suggestive evidence that PON1 DNA methylation may be involved in children’s cognitive development, via a pathway independent of OP exposure. Additional studies in larger diverse cohorts are warranted to obtain more definitive answers as to how PON1 DNA methylation contributes to the relationship of PON1 genotypes and levels with child IQ.
Supplementary Material
Highlights.
PON1 DNA methylation was inversely associated with PON1 protein levels.
Methylation levels at some PON1 CpG sites were weakly associated with cognition.
Links between child PON1 DNA methylation and cognition may depend on maternal PON1 levels and genotypes.
The relation of prenatal OPs and cognition was not mediated by PON1 DNA methylation.
Acknowledgements:
We are grateful to the laboratory and field staff and participants of the CHAMACOS study for their contributions. We are thankful to Hong Quach who helped with 450K methylation analyses and to Julie MacIsaac, who helped with processing of EPIC samples.
Funding: This work was supported by grants from the National Institute of Environmental Health Science (NIEHS) [PO1 ES009605, RO1 ES021369, R01 ES023067, and R24 ES028529], from the US Environmental Protection Agency (EPA)[R82670901, and RD83451301], the National Institutes of Health (NIH) [UG3OD023356], and the JPB Foundation of New York. Its contents are solely the responsibility of the authors and do not necessarily represent the official views of NIEHS, EPA, or JPB Foundation of New York.
Abbreviations:
- ASMN
All Sample Mean Normalization
- AREase
arylesterase
- BMIQ
beta mixture quantile
- CDC
Centers for Disease Control and Prevention
- CHAMACOS
Center for the Health Assessment of Mothers and Children of Salinas
- CV
coefficient of variation
- DAP
dialkyl phosphate
- DE
diethyl
- DM
dimethyl
- FSIQ
full-scale IQ
- LOD
limit of detection
- OP
organophosphate
- PON1
paraoxonase 1
- PPVT
Peabody Picture Vocabulary Test
- PRI
Perceptual Reasoning Index
- PSI
Processing Speed Index
- TSS
transcription start site
- VCI
Verbal Comprehension Index
- WISC
Wechsler Intelligence Scale for Children
- WMI
Working Memory Index
Footnotes
Publisher's Disclaimer: This is a PDF file of an unedited manuscript that has been accepted for publication. As a service to our customers we are providing this early version of the manuscript. The manuscript will undergo copyediting, typesetting, and review of the resulting proof before it is published in its final citable form. Please note that during the production process errors may be discovered which could affect the content, and all legal disclaimers that apply to the journal pertain.
References
- Aryee MJ; Jaffe AE; Corrada-Bravo H; Ladd-Acosta C; Feinberg AP; Hansen KD; Irizarry RA Minfi: a flexible and comprehensive Bioconductor package for the analysis of Infinium DNA methylation microarrays. Bioinformatics 2014;30:1363–1369 [DOI] [PMC free article] [PubMed] [Google Scholar]
- Bakulski KM; Feinberg JI; Andrews SV; Yang J; Brown S; S LM; Witter F; Walston J; Feinberg AP; Fallin MD DNA methylation of cord blood cell types: Applications for mixed cell birth studies. Epigenetics 2016;11:354–362 [DOI] [PMC free article] [PubMed] [Google Scholar]
- Benjamini Y; Hochberg Y Controlling the False Discovery Rate: A Practical and Powerful Approach to Multiple Testing. Journal of the Royal Statistical Society Series B (Methodological) 1995;57:289–300 [Google Scholar]
- Bibikova M; Barnes B; Tsan C; Ho V; Klotzle B; Le JM; Delano D; Zhang L; Schroth GP; Gunderson KL; Fan JB; Shen R High density DNA methylation array with single CpG site resolution. Genomics 2011;98:288–295 [DOI] [PubMed] [Google Scholar]
- Bouchard MF; Chevrier J; Harley KG; Kogut K; Vedar M; Calderon N; Trujillo C; Johnson C; Bradman A; Barr DB; Eskenazi B Prenatal exposure to organophosphate pesticides and IQ in 7-year-old children. Environ Health Perspect 2011;119:1189–1195 [DOI] [PMC free article] [PubMed] [Google Scholar]
- Bradman A; Eskenazi B; Barr DB; Bravo R; Castorina R; Chevrier J; Kogut K; Harnly ME; McKone TE Organophosphate urinary metabolite levels during pregnancy and after delivery in women living in an agricultural community. Environ Health Perspect 2005;113:1802–1807 [DOI] [PMC free article] [PubMed] [Google Scholar]
- Cardenas A; Rifas-Shiman SL; Agha G; Hivert MF; Litonjua AA; DeMeo DL; Lin X; Amarasiriwardena CJ; Oken E; Gillman MW; Baccarelli AA Persistent DNA methylation changes associated with prenatal mercury exposure and cognitive performance during childhood. Sci Rep 2017;7:288. [DOI] [PMC free article] [PubMed] [Google Scholar]
- Connelly PW; Maguire GF; Picardo CM; Teiber JF; Draganov D Development of an immunoblot assay with infrared fluorescence to quantify paraoxonase 1 in serum and plasma. J Lipid Res 2008;49:245–250 [DOI] [PubMed] [Google Scholar]
- Costa LG; Giordano G; Cole TB; Marsillach J; Furlong CE Paraoxonase 1 (PON1) as a genetic determinant of susceptibility to organophosphate toxicity. Toxicology 2013;307:115–122 [DOI] [PMC free article] [PubMed] [Google Scholar]
- Du P; Zhang X; Huang CC; Jafari N; Kibbe WA; Hou L; Lin SM Comparison of Beta-value and M-value methods for quantifying methylation levels by microarray analysis. BMC Bioinformatics 2010;11:587. [DOI] [PMC free article] [PubMed] [Google Scholar]
- Dunn L; Dunn L; Williams K; J., W. Peabody picture vocabulary test III. Circle Pines, MN: AGS; 1997 [Google Scholar]
- Dunn LM; Padilla ER; Lugo DE; Dunn LM Test de Vocabulario en Imagenes Peabody: TVIP: Adaptacion Hispanoamericana (Peabody Picture Vocabulary Test: PPVT: Hispanic-American Adaptation) Circle Pines, MN: AGS; 1986 [Google Scholar]
- Dunn M; Dunn LM Peabody Picture Vocabulary Test-Revised Circle Pines, MN: AGS; 1981 [Google Scholar]
- Dupont WD; Plummer WD Power and Sample Size Calculations for studies Involving Linear Regression. Controlled Clinical Trials 1998;19:589–601 [DOI] [PubMed] [Google Scholar]
- Emsley R; Liu H PARAMED: Stata module to perform causal mediation analysis using parametric regression models. Statistical Software Components S457581: Boston College Department of Economics; 2013
- Engel SM; Wetmur J; Chen J; Zhu C; Barr DB; Canfield RL; Wolff MS Prenatal exposure to organophosphates, paraoxonase 1, and cognitive development in childhood. Environ Health Perspect 2011;119:1182–1188 [DOI] [PMC free article] [PubMed] [Google Scholar]
- Erlich PM; Lunetta KL; Cupples LA; Huyck M; Green RC; Baldwin CT; Farrer LA Polymorphisms in the PON gene cluster are associated with Alzheimer disease. Hum Mol Genet 2006;15:77–85 [DOI] [PubMed] [Google Scholar]
- Eskenazi B; Bradman A; Gladstone E; Jaramillo S; Birch K; Holland N CHAMACOS, a longitudinal birth cohort study: lessons from the fields. J Childrens Healt 2003;1:3–27 [Google Scholar]
- Eskenazi B; Huen K; Marks A; Harley KG; Bradman A; Barr DB; Holland N PON1 and neurodevelopment in children from the CHAMACOS study exposed to organophosphate pesticides in utero. Environ Health Perspect 2010;118:1775–1781 [DOI] [PMC free article] [PubMed] [Google Scholar]
- Eskenazi B; Kogut K; Huen K; Harley KG; Bouchard M; Bradman A; Boyd-Barr D; Johnson C; Holland N Organophosphate pesticide exposure, PON1, and neurodevelopment in school-age children from the CHAMACOS study. Environ Res 2014;134:149–157 [DOI] [PMC free article] [PubMed] [Google Scholar]
- Furlong CE; Holland N; Richter RJ; Bradman A; Ho A; Eskenazi B PON1 status of farmworker mothers and children as a predictor of organophosphate sensitivity. Pharmacogenet Genomics 2006;16:183–190 [DOI] [PubMed] [Google Scholar]
- Gandhi S; Abramov AY Mechanism of oxidative stress in neurodegeneration. Oxid Med Cell Longev 2012;2012:428010. [DOI] [PMC free article] [PubMed] [Google Scholar]
- Gonzalez V; Huen K; Venkat S; Pratt K; Xiang P; Harley KG; Kogut K; Trujillo CM; Bradman A; Eskenazi B; Holland NT Cholinesterase and paraoxonase (PON1) enzyme activities in Mexican-American mothers and children from an agricultural community. J Expo Sci Environ Epidemiol 2012;22:641–648 [DOI] [PMC free article] [PubMed] [Google Scholar]
- Holland N; Furlong C; Bastaki M; Richter R; Bradman A; Huen K; Beckman K; Eskenazi B Paraoxonase polymorphisms, haplotypes, and enzyme activity in Latino mothers and newborns. Environ Health Perspect 2006;114:985–991 [DOI] [PMC free article] [PubMed] [Google Scholar]
- Houseman EA; Accomando WP; Koestler DC; Christensen BC; Marsit CJ; Nelson HH; Wiencke JK; Kelsey KT DNA methylation arrays as surrogate measures of cell mixture distribution. BMC Bioinformatics 2012;13:86. [DOI] [PMC free article] [PubMed] [Google Scholar]
- Huen K; Harley K; Bradman A; Eskenazi B; Holland N Longitudinal changes in PON1 enzymatic activities in Mexican-American mothers and children with different genotypes and haplotypes. Toxicol Appl Pharmacol 2010;244:181–189 [DOI] [PMC free article] [PubMed] [Google Scholar]
- Huen K; Harley K; Brooks J; Hubbard A; Bradman A; Eskenazi B; Holland N Developmental changes in PON1 enzyme activity in young children and effects of PON1 polymorphisms. Environ Health Perspect 2009a;117:1632–1638 [DOI] [PMC free article] [PubMed] [Google Scholar]
- Huen K; Richter R; Furlong C; Eskenazi B; Holland N Validation of PON1 enzyme activity assays for longitudinal studies. Clin Chim Acta 2009b;402:67–74 [DOI] [PMC free article] [PubMed] [Google Scholar]
- Huen K; Yousefi P; Street K; Eskenazi B; Holland N PON1 as a model for integration of genetic, epigenetic, and expression data on candidate susceptibility genes. Environ Epigenet 2015;1 [DOI] [PMC free article] [PubMed] [Google Scholar]
- Kafadar AM; Ergen A; Zeybek U; Agachan B; Kuday C; Isbir T Paraoxonase 192 gene polymorphism and serum paraoxonase activity in high grade gliomas and meningiomas. Cell Biochem Funct 2006;24:455–460 [DOI] [PubMed] [Google Scholar]
- Kujiraoka T; Oka T; Ishihara M; Egashira T; Fujioka T; Saito E; Saito S; Miller NE; Hattori H A sandwich enzyme-linked immunosorbent assay for human serum paraoxonase concentration. J Lipid Res 2000;41:1358–1363 [PubMed] [Google Scholar]
- Leduc V; Poirier J Polymorphisms at the paraoxonase 1 L55M and Q192R loci affect the pathophysiology of Alzheimer’s disease: emphasis on the cholinergic system and betaamyloid levels. Neurodegener Dis 2008;5:225–227 [DOI] [PubMed] [Google Scholar]
- Li HL; Liu DP; Liang CC Paraoxonase gene polymorphisms, oxidative stress, and diseases. J Mol Med (Berl) 2003;81:766–779 [DOI] [PubMed] [Google Scholar]
- Paragh G; Balla P; Katona E; Seres I; Egerhazi A; Degrell I Serum paraoxonase activity changes in patients with Alzheimer’s disease and vascular dementia. Eur Arch Psychiatry Clin Neurosci 2002;252:63–67 [DOI] [PubMed] [Google Scholar]
- Pasca SP; Dronca E; Nemes B; Kaucsar T; Endreffy E; Iftene F; Benga I; Cornean R; Dronca M Paraoxonase 1 activities and polymorphisms in autism spectrum disorders. J Cell Mol Med 2010;14:600–607 [DOI] [PMC free article] [PubMed] [Google Scholar]
- Pasca SP; Nemes B; Vlase L; Gagyi CE; Dronca E; Miu AC; Dronca M High levels of homocysteine and low serum paraoxonase 1 arylesterase activity in children with autism. Life Sci 2006;78:2244–2248 [DOI] [PubMed] [Google Scholar]
- Pidsley R; Zotenko E; Peters TJ; Lawrence MG; Risbridger GP; Molloy P; Van Djik S; Muhlhausler B; Stirzaker C; Clark SJ Critical evaluation of the Illumina MethylationEPIC BeadChip microarray for whole-genome DNA methylation profiling. Genome Biol 2016;17:208. [DOI] [PMC free article] [PubMed] [Google Scholar]
- Richter RJ; Furlong CE Determination of paraoxonase (PON1) status requires more than genotyping. Pharmacogenetics 1999;9:745–753 [PubMed] [Google Scholar]
- Saeed M; Siddique N; Hung WY; Usacheva E; Liu E; Sufit RL; Heller SL; Haines JL; Pericak-Vance M; Siddique T Paraoxonase cluster polymorphisms are associated with sporadic ALS. Neurology 2006;67:771–776 [DOI] [PubMed] [Google Scholar]
- Sandoval J; Heyn H; Moran S; Serra-Musach J; Pujana MA; Bibikova M; Esteller M Validation of a DNA methylation microarray for 450,000 CpG sites in the human genome. Epigenetics 2011;6:692–702 [DOI] [PubMed] [Google Scholar]
- Slowik A; Tomik B; Wolkow PP; Partyka D; Turaj W; Malecki MT; Pera J; Dziedzic T; Szczudlik A; Figlewicz DA Paraoxonase gene polymorphisms and sporadic ALS. Neurology 2006;67:766–770 [DOI] [PubMed] [Google Scholar]
- Solomon O; MacIsaac J; Quach H; Tindula G; Kobor MS; Huen K; Meaney MJ; Eskenazi B; Barcellos L; Holland N Comparison of DNA methylation measured by Illumina 450K and EPIC BeadChips in blood of newborns and 14-year-old children. Epigenetics In Press; https://doi.org/10.1080/15592294.2018.1497386. [DOI] [PMC free article] [PubMed] [Google Scholar]
- Stein LJ; Gunier RB; Harley K; Kogut K; Bradman A; Eskenazi B Early childhood adversity potentiates the adverse association between prenatal organophosphate pesticide exposure and child IQ: The CHAMACOS cohort. Neurotoxicology 2016;56:180–187 [DOI] [PMC free article] [PubMed] [Google Scholar]
- Teschendorff AE; Marabita F; Lechner M; Bartlett T; Tegner J; Gomez-Cabrero D; Beck S A beta-mixture quantile normalization method for correcting probe design bias in Illumina Infinium 450 k DNA methylation data. Bioinformatics 2013;29:189–196 [DOI] [PMC free article] [PubMed] [Google Scholar]
- Wechsler D Wechsler Intelligence Scale for Children - Fourth Edition (WISC-IV) ed^eds. San Antonio, TX: Pearson Assessments; 2003 [Google Scholar]
- Wechsler D Wechsler Intelligence Scale for Children - Fourth Edition (Spanish Manual) ed^eds. San Antonio, TX: Pearson Assessments; 2005 [Google Scholar]
- Wells PG; McCallum GP; Chen CS; Henderson JT; Lee CJ; Perstin J; Preston TJ; Wiley MJ; Wong AW Oxidative stress in developmental origins of disease: teratogenesis, neurodevelopmental deficits, and cancer. Toxicol Sci 2009;108:4–18 [DOI] [PubMed] [Google Scholar]
- Woodcock R; A. M-S Woodcock-Johnson Psycho-Educational Battery - Revised ed^eds. Itasca, IL: Riverside Publishing; 1990 [Google Scholar]
- Yousefi P; Huen K; Schall RA; Decker A; Elboudwarej E; Quach H; Barcellos L; Holland N Considerations for normalization of DNA methylation data by Illumina 450K BeadChip assay in population studies. Epigenetics 2013;8:1141–1152 [DOI] [PMC free article] [PubMed] [Google Scholar]
- Zintzaras E; Hadjigeorgiou GM Association of paraoxonase 1 gene polymorphisms with risk of Parkinson’s disease: a meta-analysis. J Hum Genet 2004;49:474–481 [DOI] [PubMed] [Google Scholar]
Associated Data
This section collects any data citations, data availability statements, or supplementary materials included in this article.