Supplemental Digital Content is available in the text
Keywords: Asia, KNHANES, prevalence, South Korea, trend, vitamin D
Abstract
Vitamin D deficiency has become one of the most prevalent health problems in modern society. However, there has been no study that has reported the trend of vitamin D status in Asia. We performed an observational study to investigate the trend of vitamin D status in South Korea based on a representative national database acquired from the Korea National Health and Nutrition Examination Surveys (KNHANES) conducted from 2008 to 2014. A total of 39,759 patients were included in the final analyses. Serum 25-hydroxyvitamin D (25 (OH)D) levels were measured by radioimmunoassay. The overall mean serum level of 25 (OH)D was 45.7 nmol/L in males and 40.9 nmol/L in females in KNHANES 2008 to 2014. There was a significant trend toward lower serum 25 (OH)D levels from 2008 to 2014 in males by −1.2 (95% confidence interval [CI] −1.5 to −0.9) nmol/L per year and in female by −0.7 (95% CI −0.9 to −0.4) nmol/L per year. The overall mean serum level of 25 (OH)D in 2008 was 53.0 nmol/L in males and 45.7 nmol/L in females. It decreased to 43.2 nmol/L in males and 39.2 nmol/L in females in 2014. Vitamin D deficiency, defined as the serum 25 (OH)D level of <50 nmol/L, was found in 65.7% of males and 76.7% of females in overall population. A significant increasing trend of vitamin D deficiency was also observed. The prevalence of vitamin D deficiency in 2008 was 51.8% in males and 68.2% in females, but rose to 75.2% and 82.5%, respectively, in 2014. The present study demonstrated that vitamin D status in South Koreans is still deteriorating. More extensive and proactive measures are needed to improve vitamin D status in South Korea.
1. Introduction
Most of nutrition deficiency diseases have disappeared in developed and newly industrialized countries worldwide. Meanwhile, overnutrition or obesity-related disorders such as type 2 diabetes mellitus, hypertension, and cardiovascular diseases, have become a major health concern in modern society. However, society is now facing a quite different situation, when it comes to vitamin D nutrition. Vitamin D is unique in that it is mostly acquired by cutaneous synthesis in response to the sun's ultraviolet B (UVB) radiation, while dietary sources of vitamin D are very limited. Drastic changes in modern environments, including indoor lifestyle and air pollution, have made vitamin D deficiency one of the most prevalent health problems. Historically, severe deficiency of vitamin D appeared as rickets in western countries during the Industrial Revolution. Autopsy studies in the 19th century once reported that 80% to 90% of children had varying degrees of rickets.[1] Since vitamin D deficiency was recognized as the main cause of rickets, many countries have supplied vitamin D in various forms of fortified foods. Nevertheless, recent epidemiologic studies still indicate high prevalence of vitamin D deficiency or insufficiency worldwide.[2–12] In the United States (US), the prevalence of vitamin D deficiency in 2001 to 2006 was estimated to be 29% in males and 34% in females, if serum 25-hydroxyvitamin D (25 (OH)D) level of <50 nmol/L was adopted as the cut-off value.[4] Vitamin D deficiency in Asian countries has recently received more attention. Although its prevalence has been reported to vary from 6% to 70% in the region, vitamin D deficiency in some Asian countries seems to be more serious than in western counterparts.[9] A previous South Korean study based on the Korea National Health and Nutrition Examination Survey (KNHANES) conducted in 2008 showed that the prevalence of vitamin D deficiency was 47.3% in males and 64.5% in females.[6] Another study based on the Nutrition and Health of Aging Population in China project also showed that 69.2% of participants aged 50 to 70 years have vitamin D deficiency.[10] The common predictors for vitamin D deficiency in Asian countries were young age, female, living in an urban area, and physical inactivity.[9]
Several studies from western countries have assessed the trends of vitamin D status over the past decades.[13–19] However, there was no study that investigated the trend of vitamin D status in Asian population. In the present study, an assessment of the 7-year trend of vitamin D status and the prevalence of vitamin D deficiency in the South Korean population, based on the KNHANES conducted from 2008 to 2014, was performed. Based on examination of prior studies, this research is the first that shows the trend of vitamin D status in Asian country based on a large representative national database.
2. Materials and methods
2.1. Study participants
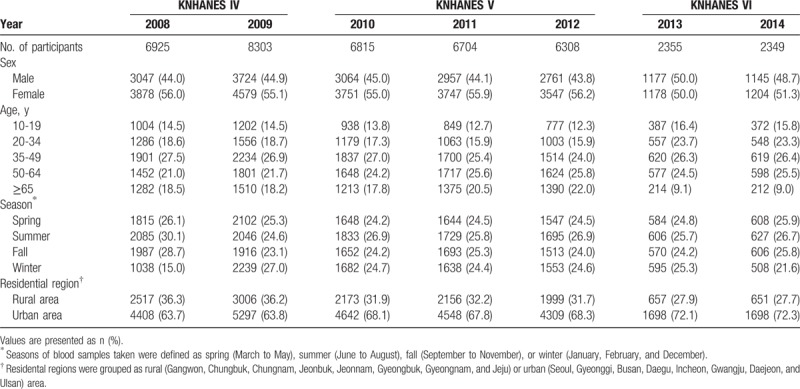
The KNHANES is an ongoing surveillance system that has been conducted by the Division of Health and Nutrition Survey within the Korea Centers for Disease Control and Prevention to evaluate the health and nutritional status of the civilian noninstitutionalized population of South Korea. Since the KNHANES was initiated in 1998, surveys for the KNHANES I (1998), KNHANES II (2001), KNHANES III (2005), KNHANES IV (2007–2009), KNHANES V (2010–2012), and KNHANES VI (2013–2015) have been executed, and the survey for KNHANES VII (2016–2018) is still in progress. The present study is based on the data acquired from the KNHANES IV to VI, conducted between 2008 and 2014. In 2008 to 2009, there were 200 randomly selected sampling units with 23 households in each unit (yielding 4600 households) every year. In 2010 to 2014, there were 192 randomly selected sampling units with 20 households in each unit (yielding 3840 households) every year. For each year, the sampling units were newly selected and did not overlap with previous samples. From 2008 to 2014, a total of 76,660 individuals (12,528 in 2008; 12,722 in 2009; 10,938 in 2010; 10,589 in 2011; 10,069 in 2012; 10,113 in 2013; and 9701 in 2014) were sampled, and a total of 61,378 individuals (9744 in 2008; 10,533 in 2009; 8958 in 2010; 8518 in 2011; 8057 in 2012; 8018 in 2013; and 7550 in 2014) participated in the survey. Among those participants, serum 25 (OH)D levels were measured from 39,759 individuals (6925 in 2008; 8303 in 2009; 6815 in 2010; 6704 in 2011; 6308 in 2012; 2355 in 2013; and 2349 in 2014) aged 10 years and older (Table 1). Blood samples were collected year-round during the survey. All the participants in this survey signed an informed consent form.
Table 1.
Demographic characteristics of participants in KNHANES 2008 to 2014.
2.2. Data collection
The overall survey consists of a health interview survey, a nutrition survey, and a health examination survey. The survey data collected was via household interviews and by direct standardized physical examinations conducted in specially equipped mobile examination centers. Demographic, anthropometric, and behavioral characteristics were measured. Based on the collected data, several variables were defined to improve the interpretation of the results of statistical analyses, of which the details are given in the subsequent section. Age in years was categorized into 5 levels (10–19, 20–34, 35–49, 50–64, and 65 years or more). Residential region was grouped as urban or rural areas. Among the 16 administrative districts where this survey was conducted, Seoul (the capital city of South Korea), the surrounding metropolitan area (Gyeonggi), and 6 other metropolitan cities (Busan, Daegu, Incheon, Gwangju, Daejeon, and Ulsan) of South Korea were grouped as urban areas. The remainder of the regions (Gangwon, Chungbuk, Chungnam, Jeonbuk, Jeonnam, Gyeongbuk, Gyeongnam, and Jeju) was grouped as rural areas. Almost all areas of South Korea are located between 33°N and 38°N of latitude. Serum 25 (OH)D concentration was categorized into 4 levels (<25, 25 to <50, 50 to <75, and ≥75 nmol/L) and the vitamin D deficiency was defined as the serum 25 (OH)D concentration <50 nmol/L. The seasons of blood samples taken were defined as spring (March to May), summer (June to August), fall (September to November), or winter (January, February, and December).
2.3. Measurement of serum 25 (OH)D
Blood samples were collected after an 8-hour fast. They were properly processed, immediately refrigerated, and transported in cold storage to the central testing institute (NeoDin Medical Institute, Seoul, South Korea). Blood samples were analyzed within 24 hours after transportation. Serum 25 (OH)D levels were measured using a 1470 Wizard gamma counter (Perkin Elmer, Turku, Finland) and by radioimmunoassay (RIA) (DiaSorin, Stillwater, MN). The coefficient of variation of control material was ≤7.6% for low level and ≤5.8% for high level, respectively. The central testing institute has participated in the international Vitamin D External Quality Assessment Scheme (DEQAS). Results of the DEQAS proficiency testing showed less than ±2.0 standard deviation index (SDI), except the SDI range from −2.40 to +2.87 due to random error in 2010, without negative or positive trend. Traceability tests using the standard reference material (SRM) 972a developed by the National Institute of Standards and Technology (NIST) showed that, except in cases of a low concentration (level 2), the measurements were less than ±10%, which is the desirable analytical bias goal.[20]
2.4. Statistical analyses
Statistical analyses were conducted to evaluate the effects of participant characteristics (age, season, and residential region) on serum 25 (OH)D concentrations, and the temporal change in the mean concentration of serum 25 (OH)D over years 2008 to 2014. Because the literature consistently showed that the serum 25 (OH)D concentration differs by gender, analyses were done separately for males and females (6). The difference in mean concentrations of serum 25 (OH)D by the participant characteristics was tested with ANOVA or t test, depending on the number of category levels of the characteristic of interest. A linear trend of mean serum 25 (OH)D level over the years was analyzed through a linear regression model, in which the years were treated as a continuous predictor and other characteristics were adjusted, if necessary. Analogously, a linear trend of vitamin D deficiency was analyzed through a logistic regression model. The significance of a test was defined as P < .05. Since study patients in the KNHANES have different sampling probabilities of being selected, the weights based on these probabilities were accounted in all the analyses labeled as being weighted, of which the results were interpreted to the population, but they were not used in the descriptive analyses for the sample patients. Statistical analyses were performed in SAS version 9.4 (SAS Institute, Inc, Cary, NC).
3. Results
3.1. Demographic characteristics
Demographic characteristics of participants are presented in Table 1. The number of patients in years 2013 and 2014 are about one-third of those in the years 2008 to 2012, because serum 25 (OH)D was measured for all the participants aged 10 years and more in 2008 to 2012, but only for 2400 randomly selected participants with age of 10 years or more in 2013 to 2014. A total of 39,759 patients with 17,875 males and 21,884 females were included in the final analyses. Characteristics of the target population accounting for sampling weights are presented in Supplemental Table 1.
3.2. Serum 25 (OH)D levels and the prevalence of vitamin D deficiency in overall population
The serum 25 (OH)D levels averaged over years 2008 to 2014 by the participant characteristics are presented in Table 2. The overall mean serum level of 25 (OH)D was 45.7 nmol/L in males and 40.9 nmol/L in females. Participants aged 20 to 34 years had the lowest serum 25 (OH)D level, 41.4 nmol/L in males and 37.4 nmol/L in females, whereas those aged 65 years or more had the highest serum 25 (OH)D levels. Figure 1 illustrates the proportions of participants with vitamin D group stratified by age group. In both sexes, the prevalence of vitamin D deficiency, defined as the serum 25 (OH)D level of <50 nmol/L, was highest at the age of 20 to 34 years with the prevalence of 76.8% in males and 84.9% in females. Overall, vitamin D deficiency was found in 65.7% of males and 76.7% of females. Only 5.3% of males and 3.3% of females had a serum 25 (OH)D level of >75 nmol/L.
Table 2.
Serum 25 (OH)D levels by participants’ characteristics in KNHANES 2008 to 2014.
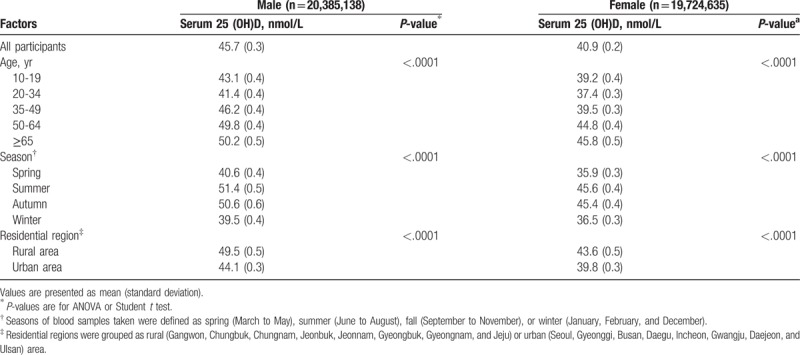
Figure 1.
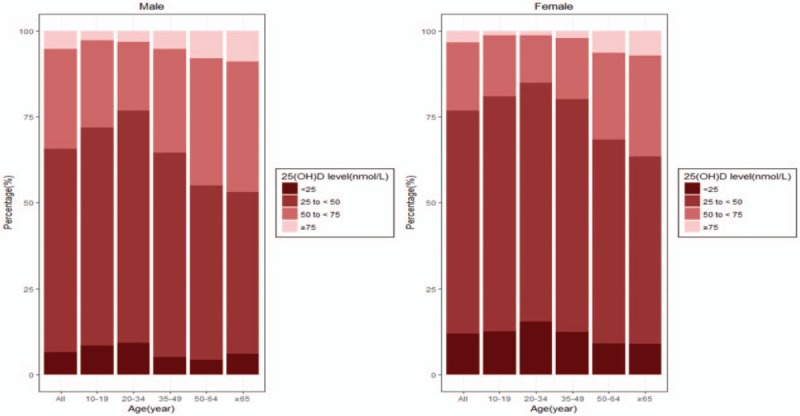
The percentage of participants with serum 25-hydroxyvitamin D (25 (OH)D) levels of <25, 25 to <50, 50 to <75, and 75 nmol/L or greater by age groups.
3.3. Trend of serum 25 (OH)D levels and the prevalence of vitamin D deficiency from 2008 to 2014
The trend of mean serum 25 (OH)D levels between 2008 and 2014 is depicted in Figure 2. The overall mean serum level of 25 (OH)D in 2008 was 53.0 nmol/L in males and 45.7 nmol/L in females. It decreased to 43.2 nmol/L in males and 39.2 nmol/L in females in 2014. Such large decrements can be explained by a significant trend toward lower serum 25 (OH)D levels from 2008 to 2014 in males by −1.2 (95% confidence interval [CI] −1.5 to −0.9) nmol/L per year and in females by −0.7 (95% CI −0.9 to −0.4) nmol/L per year. The changes in the prevalence of vitamin D deficiency during the same period are presented in Figure 3. The prevalence of vitamin D deficiency in 2008 was 51.8% in males and 68.2% in females. It rose to 75.2% and 82.5%, respectively, in 2014. There was a significant increasing trend of vitamin D deficiency from 2008 to 2014 in both males (P < .001) and females (P < .001).
Figure 2.
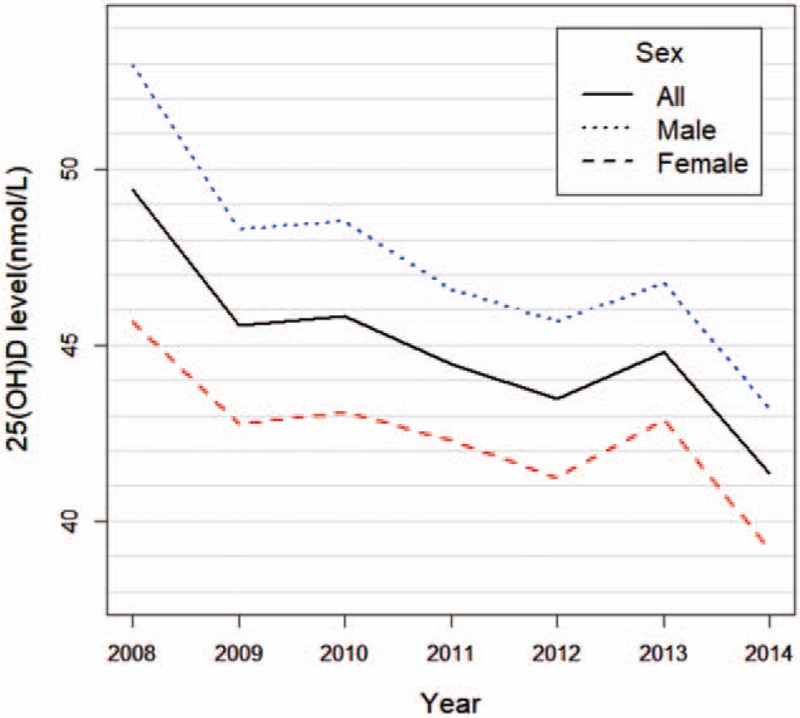
The changes of mean serum 25-hydroxyvitamin D (25 (OH)D) levels from 2008 to 2014.
Figure 3.
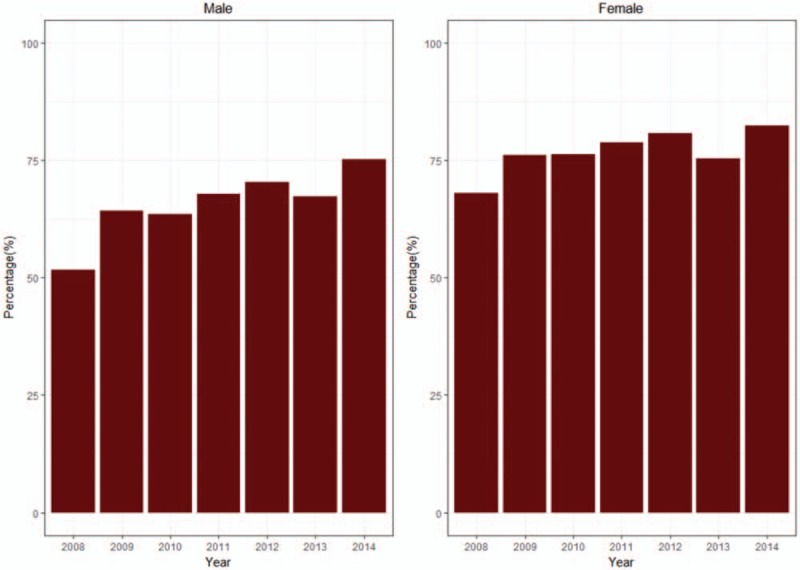
The changes in the prevalence of vitamin D deficiency from 2008 to 2014. Vitamin D deficiency was defined as the serum 25-hydroxyvitamin D concentration <50 nmol/L.
The temporal changes of gender-specific mean serum 25 (OH)D levels from 2008 to 2014 were further investigated by stratifying them, by either seasons and age groups, as shown in Figure 4. Both the mean serum 25 (OH)D levels in 2008 and 2014, and the temporal trends were very similar in summer and fall. For spring and winter, similar patterns were observed, except for the mean serum 25 (OH)D level in males in 2014, as shown in Figure 4A. In both males and females, there was a significant trend toward lower serum 25 (OH)D levels in summer, fall, and winter, but with only little change in spring (P < .001). With respect to age groups, the mean serum 25 (OH)D levels decreased in all age groups in both men and women, except for female patients aged 65 years or more (Fig. 4B). The absolute decrease in the serum 25 (OH)D levels between 2008 and 2014 was highest in those aged 35 to 49 years in males (−12.8 nmol/L) and in those aged 20 to 34 years in females (−7.7 nmol/L).
Figure 4.
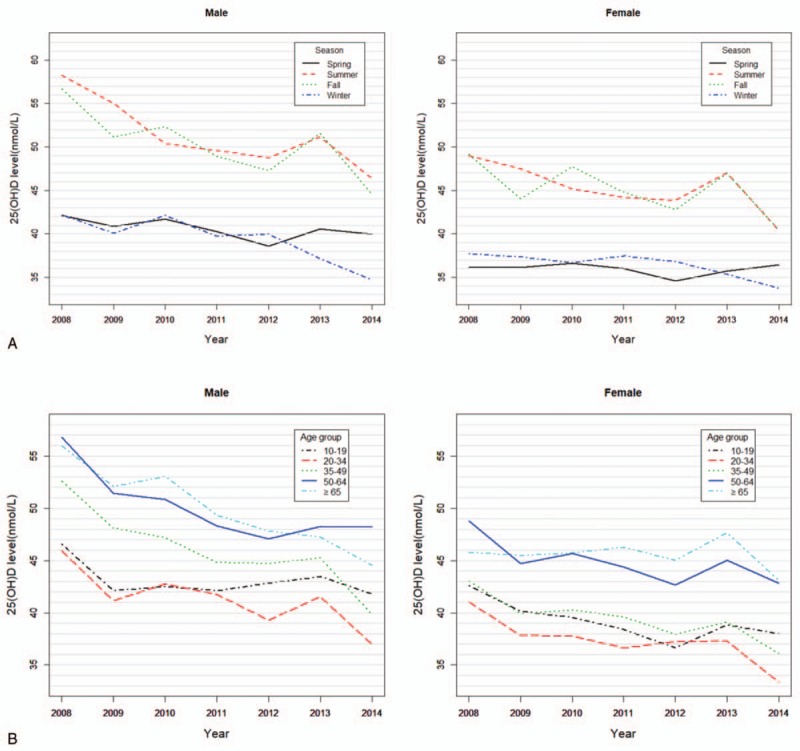
The changes of gender-specific mean serum 25-hydroxyvitamin D (25 (OH)D) levels by seasons (A) or age groups (B) from 2008 to 2014.
4. Discussion
The present study showed that vitamin D deficiency is a very common health problem in South Korea. It was also noted that vitamin D deficiency is most prevalent in young adults and least prevalent in the elderly, which is in accordance with findings from a previous study based on the KNHANES 2008.[6] The higher prevalence of vitamin D deficiency in young adults was also reported in recent studies performed in other countries such as China, Thailand, and United Kingdom.[7,11,12] Considering that the cutaneous production of vitamin D declines with aging, environmental factors such as sun exposure are getting more important for individual's vitamin D status in modern society. Vitamin D deficiency in young generation raises a concern that it may negatively affect young people's bone health in the critical period of achieving peak bone mass. As with other studies, our findings also showed that females have lower 25 (OH)D levels than males. Gender difference in vitamin D status is probably due to environmental factors such as indoor lifestyle and sun avoidance behaviors. The most interesting finding of the present study is the decreasing trend of serum 25 (OH)D levels from 2008 to 2014 regardless of gender, age, or season. The increase in serum 25 (OH)D levels that was observed in 2013 might be a transient phenomenon, of which we cannot provide a clear explanation. One possible cause is sunshine duration, which was much longer in 2013 (2408.8 hours per year) than the average annual hours of sunshine in South Korea (2128.6 hours per year).[21]
Several studies have reported the trends of vitamin D status, all of which were performed in western countries.[13–19] A previous study based on the National Health and Nutrition Examination Survey (NHANES) in the US compared serum 25 (OH)D levels measured by RIA from NHANES III, collected during 1988 through 1994, with NHANES 2000 to 2004, collected from 2000 through 2004.[13] This study showed a decline in serum 25 (OH)D status from 1988 to 1994, to 2000 to 2004, although much of the observed difference between the 2 periods was attributed to assay bias. More recent studies from western countries have showed opposite findings.[14–19] Another NHANES-based study, which assessed the changes of vitamin D status from 1988 to 2010, showed modest increases in serum 25 (OH)D levels by 5 to 6 nmol/L during 2007 to 2010.[14] In this study, serum 25 (OH)D levels were measured by liquid chromatography-tandem mass spectrometry (LC-MS/MS) in NHANES 2007 to 2010, and the LC-MS/MS-equivalent levels predicted from RIA data were used for NHANES 1988 to 2006. It is because NHANES changed the assay method for 25 (OH)D from RIA to LC-MS/MS in 2007. Other studies from the US show that vitamin D status has lately improved in regional populations.[15,16] The Canadian Multicentre Osteoporosis Study (CaMos), a population-based cohort study, examined longitudinal change of serum 25 (OH)D levels measured by chemiluminescent immunoassays over 10 years.[17] Serum 25 (OH)D levels were estimated to increase by 9.3 nmol/L in females and by 3.5 nmol/L in males, between 1995 to 1997 and 2005 to 2007. The percentage of participants with 25 (OH)D levels <50 nmol/L fell from a mean of 29.7% to 19.8% during the same period. A study based on a nationally representative sample of Finnish adults also showed that mean serum 25 (OH)D level measured by LC-MS/MS increased from 48 to 65 nmol/L between 2000 and 2011.[18]
Recent upward trends of vitamin D status in western countries reflect increased vitamin D supplementation with raised health awareness.[14–17] Supplemental vitamin D use was generally associated with increases in total vitamin D intakes of ∼2 to 3 μg/d in the US.[22,23] In the aforementioned study based on NHANES 1988 to 2010, the increase in serum 25 (OH)D levels during 2007 to 2010, corresponded in time with an increase in the use of supplements containing higher amounts of vitamin D.[14] The CaMos also reported that users of vitamin D supplements and mean amount of intake increased over 10 years in its cohort.[17] In addition, vitamin D fortification has made a substantial contribution to the vitamin D status. In western countries, mandatory or voluntary vitamin D fortification programs in line with the national policy have been implemented.[16,24] A variety of fortified food products such as milk, cheeses, margarine, and ready-to-eat cereals, which are usually consumed by westerners, are now available. In the US, it was estimated that mean intake of vitamin D from foods was 4.9 μg/d with 2.0 μg/d from natural sources, and 2.9 μg/d from fortified foods, which means that about 60% of dietary vitamin D intake comes from fortified foods.[22]
Vitamin D deficiency is now well recognized as a common health problem in Asian countries.[5–8] It is also noteworthy that low vitamin D status is most serious in the Middle East, particularly, in girls and women with the prevalence of vitamin D deficiency around 70% or higher reported in some countries .[5,25–27] A variety of cultural, environmental, and genetic factors have been suggested as the causes influencing on low vitamin D status in Asia. From a genetic point of view, Asians’ darker skin cannot produce vitamin D as much as Caucasians’ skin does with the same condition.[28] Differences in dietary culture and vitamin D fortification programs are important factors differentiating Asian from western countries. While vitamin D fortification programs have been implemented in western countries to combat rickets since the early 20th century, vitamin D fortification has been unpopular in Asian countries.[29,30] To make matters worse, Asians’ consumption of vitamin D fortified foods such as milk and its products is very low.[29,31]
Contrary to recent findings from western countries, the present study indicated that vitamin D status in South Koreans is still deteriorating. Although the exact reasons for this study's findings are unclear, it is speculated that continuing changes in lifestyle and environment, which are associated with sunlight exposure, are the principal factors. According to the statistics from the Ministry of Land, Infrastructure and Transport of Korea, the number of urban population in South Korea have continued to grow from 90.5% to 91.7% between 2008 and 2014.[32] In contrast, the number of people who are engaged in outdoor occupations such as agriculture and fishery is diminishing.[33] In a previous report, outdoor occupations were associated with increased vitamin D status, while living in urban region was an independent risk factor for vitamin D deficiency in South Korea.[6] Air pollution might be another reason for aggravating vitamin D status. Tropospheric ozone can reduce the cutaneous production of vitamin D by absorbing solar UVB photons reaching ground level.[34] According to the statistics from the Ministry of Environment of Korea, the concentration of tropospheric ozone has increased in the major cities of South Korea since 2005.[35] These changes in environment are associated with rapid industrialization that most Asian countries have experienced in the past decades. Additional studies are needed on the trend of vitamin D status from other Asian countries to check whether growing of vitamin D deficiency is a common finding of the region.
It is disappointing that vitamin D deficiency is still growing in South Korea, despite the previous reports warning the seriousness of vitamin D deficiency in its population.[6,36] Additional exploration should be performed using more extensive and proactive measures to tackle this problem. A population-based approach, such as fortification of foods widely consumed by Asians, would be a simple and effective strategy.[30,37] Considering the diversity of dietary culture, it is necessary to develop a vitamin D fortification program that suits each population. The government's support for successful implementation of the program is also needed. In addition, other interventions, such as vitamin D supplementation and behavior changes to increase sunlight exposure, should be considered for those at risk for vitamin D deficiency.
The major strength of the present study was that it was performed based on a large representative national database of South Korea collected over 7 years. During that period, participants’ serum 25 (OH)D levels were measured in the same central testing institute that has participated in DEQAS. A concern is that serum 25 (OH)D levels were measured by DiaSorin RIA, which was replaced by LC-MS/MS due to method bias and imprecision in NHANES.[14] Nevertheless, the data of internal and external quality control were found to be generally satisfactory as shown in the results of DEQAS proficiency testing and traceability tests using NIST SRM 972a, which were described in Section 2.
In conclusion, the present study suggests that mean serum 25 (OH)D level is decreasing and the prevalence of vitamin D deficiency is growing in South Korea. Therefore, it is a critical public health issue to improve vitamin D status. A comprehensive campaign and education to raise public awareness of health benefits of vitamin D is necessary. There is also a need to develop a vitamin D fortification program that suits South Korean population. Vitamin D supplementation or lifestyle modification to increase outdoor activities can be recommended as a useful strategy, for those at risk for vitamin D deficiency.
Author contributions
Conceptualization: Han Seok Choi.
Data curation: Ju-Hyun Park, In Young Hong, Han Seok Choi.
Formal analysis: In Young Hong.
Funding acquisition: Han Seok Choi.
Investigation: Ju-Hyun Park, In Young Hong, Han Seok Choi.
Methodology: Ju-Hyun Park, In Young Hong, Jae Woo Chung, Han Seok Choi.
Resources: Han Seok Choi.
Software: Ju-Hyun Park.
Supervision: Han Seok Choi.
Validation: Jae Woo Chung.
Writing – original draft: Ju-Hyun Park, Jae Woo Chung, Han Seok Choi.
Supplementary Material
Footnotes
Abbreviations: 25(OH)D = 25-hydroxyvitamin D, CaMos = Canadian Multicentre Osteoporosis Study, DEQAS = Vitamin D External Quality Assessment Scheme, KNHANES = Korea National Health and Nutrition Examination Surveys, LC-MS/MS = liquid chromatography–tandem mass spectrometry, NHANES = National Health and Nutrition Examination Survey, NIST = National Institute of Standards and Technology, RIA = radioimmunoassay, SDI = standard deviation index, SRM = standard reference material, US = United States, UVB = ultraviolet B.
This research was supported by Basic Science Research Program through the National Research Foundation of Korea (NRF) funded by the Ministry of Science, ICT & Future Planning (NRF-2015R1C1A1A01054333). ClinicalTrials.gov (http://www.clinicaltrials.gov) ID number: NCT03304795.
The authors have no conflicts of interest to disclose.
Supplemental Digital Content is available for this article.
References
- [1].Holick MF. Resurrection of vitamin D deficiency and rickets. J Clin Invest 2006;116:2062–72. [DOI] [PMC free article] [PubMed] [Google Scholar]
- [2].Mithal A, Wahl DA, Bonjour JP, et al. Global vitamin D status and determinants of hypovitaminosis D. Osteoporos Int 2009;20:1807–20. [DOI] [PubMed] [Google Scholar]
- [3].Cashman KD, Dowling KG, Škrabáková Z, et al. Vitamin D deficiency in Europe: pandemic? Am J Clin Nutr 2016;103:1033–44. [DOI] [PMC free article] [PubMed] [Google Scholar]
- [4].Ganji V, Zhang X, Tangpricha V. Serum 25-hydroxyvitamin D concentrations and prevalence estimates of hypovitaminosis D in the U.S. population based on assay-adjusted data. J Nutr 2012;142:498–507. [DOI] [PubMed] [Google Scholar]
- [5].Palacios C, Gonzalez L. Is vitamin D deficiency a major global public health problem? J Steroid Biochem Mol Biol 2014;144P A:138–45. [DOI] [PMC free article] [PubMed] [Google Scholar]
- [6].Choi HS, Oh HJ, Choi H, et al. Vitamin D insufficiency in Korea-a greater threat to younger generation: the Korea National Health and Nutrition Examination Survey (KNHANES) 2008. J Clin Endocrinol Metab 2011;96:643–51. [DOI] [PubMed] [Google Scholar]
- [7].Yu S, Fang H, Han J, et al. The high prevalence of hypovitaminosis D in China: a multicenter vitamin D status survey. Medicine (Baltimore) 2015;94:e585. [DOI] [PMC free article] [PubMed] [Google Scholar]
- [8].Yoshimura N, Muraki S, Oka H, et al. Profiles of vitamin D insufficiency and deficiency in Japanese men and women: association with biological, environmental, and nutritional factors and coexisting disorders: the ROAD study. Osteoporos Int 2013;24:2775–87. [DOI] [PubMed] [Google Scholar]
- [9].Nimitphong H, Holick MF. Vitamin D status and sun exposure in southeast Asia. Dermatoendocrinol 2013;5:34–7. [DOI] [PMC free article] [PubMed] [Google Scholar]
- [10].Lu L, Yu Z, Pan A, et al. Plasma 25-hydroxyvitamin D concentration and metabolic syndrome among middle-aged and elderly Chinese individuals. Diabetes Care 2009;32:1278–83. [DOI] [PMC free article] [PubMed] [Google Scholar]
- [11].Chailurkit LO, Aekplakorn W, Ongphiphadhanakul B. Regional variation and determinants of vitamin D status in sunshine-abundant Thailand. BMC Public Health 2011;11:853. [DOI] [PMC free article] [PubMed] [Google Scholar]
- [12].Prentice A. Vitamin D deficiency: a global perspective. Nutr Rev 2008;66(Suppl 2):S153–64. [DOI] [PubMed] [Google Scholar]
- [13].Looker AC, Pfeiffer CM, Lacher DA, et al. Serum 25-hydroxyvitamin D status of the US population: 1988-1994 compared with 2000-2004. Am J Clin Nutr 2008;88:1519–27. [DOI] [PMC free article] [PubMed] [Google Scholar]
- [14].Schleicher RL, Sternberg MR, Lacher DA, et al. The vitamin D status of the US population from 1988 to 2010 using standardized serum concentrations of 25-hydroxyvitamin D shows recent modest increases. Am J Clin Nutr 2016;104:454–61. [DOI] [PMC free article] [PubMed] [Google Scholar]
- [15].Belsky J, Sena S, Baqai S, et al. A four-year trend in serum 25-hydroxyvitamin D levels in western Connecticut. Conn Med 2016;80:133–7. [PubMed] [Google Scholar]
- [16].Dudenkov DV, Yawn BP, Oberhelman SS, et al. Changing incidence of serum 25-hydroxyvitamin D values above 50 ng/mL: a 10-year population-based study. Mayo Clin Proc 2015;90:577–86. [DOI] [PMC free article] [PubMed] [Google Scholar]
- [17].Berger C, Greene-Finestone LS, Langsetmo L, et al. Temporal trends and determinants of longitudinal change in 25-hydroxyvitamin D and parathyroid hormone levels. J Bone Miner Res 2012;27:1381–9. [DOI] [PMC free article] [PubMed] [Google Scholar]
- [18].Jääskeläinen T, Itkonen ST, Lundqvist A, et al. The positive impact of general vitamin D food fortification policy on vitamin D status in a representative adult Finnish population: evidence from an 11-y follow-up based on standardized 25-hydroxyvitamin D data. Am J Clin Nutr 2017;105:1512–20. [DOI] [PubMed] [Google Scholar]
- [19].Jorde R, Sneve M, Hutchinson M, et al. Tracking of serum 25-hydroxyvitamin D levels during 14 years in a population-based study and during 12 months in an intervention study. Am J Epidemiol 2010;171:903–8. [DOI] [PubMed] [Google Scholar]
- [20].Viljoen A, Singh DK, Farrington K, et al. Analytical quality goals for 25-vitamin D based on biological variation. J Clin Lab Anal 2011;25:130–3. [DOI] [PMC free article] [PubMed] [Google Scholar]
- [21].Korea Meteorological Administration. National Climate Data Service System. [Internet]. Available at http://sts.kma.go.kr/jsp/home/contents/applystatic11/view.do?applyStaticId=krpnslClmStcs. Assessed April 10, 2018.
- [22].Fulgoni VL, 3rd, Keast DR, Bailey RL, et al. Foods, fortificants, and supplements: where do Americans get their nutrients? J Nutr 2011;141:1847–54. [DOI] [PMC free article] [PubMed] [Google Scholar]
- [23].Calvo MS, Whiting SJ, Barton CN. Vitamin D fortification in the United States and Canada: current status and data needs. Am J Clin Nutr 2004;80(6 Suppl):1710S–6S. [DOI] [PubMed] [Google Scholar]
- [24].Calvo MS, Whiting SJ. Survey of current vitamin D food fortification practices in the United States and Canada. J Steroid Biochem Mol Biol 2013;136:211–3. [DOI] [PubMed] [Google Scholar]
- [25].Siddiqui AM, Kamfar HZ. Prevalence of vitamin D deficiency rickets in adolescent school girls in Western region, Saudi Arabia. Saudi Med J 2007;28:441–4. [PubMed] [Google Scholar]
- [26].Maghbooli Z, Hossein-Nezhad A, Shafaei AR, et al. Vitamin D status in mothers and their newborns in Iran. BMC Pregnancy Childbirth 2007;7:1. [DOI] [PMC free article] [PubMed] [Google Scholar]
- [27].Ardawi MS, Sibiany AM, Bakhsh TM, et al. High prevalence of vitamin D deficiency among healthy Saudi Arabian men: relationship to bone mineral density, parathyroid hormone, bone turnover markers, and lifestyle factors. Osteoporos Int 2012;23:675–86. [DOI] [PubMed] [Google Scholar]
- [28].Farrar MD, Kift R, Felton SJ, et al. Recommended summer sunlight exposure amounts fail to produce sufficient vitamin D status in UK adults of South Asian origin. Am J Clin Nutr 2011;94:1219–24. [DOI] [PubMed] [Google Scholar]
- [29].Calvo MS, Whiting SJ, Barton CN. Vitamin D intake: a global perspective of current status. J Nutr 2005;135:310–6. [DOI] [PubMed] [Google Scholar]
- [30].Gupta GR, Gupta A. Fortification of foods with vitamin D in India. Nutrients 2014;6:3601–23. [DOI] [PMC free article] [PubMed] [Google Scholar]
- [31].Yoo K, Cho J, Ly S. Vitamin D intake and serum 25-hydroxyvitamin D levels in Korean adults: analysis of the 2009 Korea National Health and Nutrition Examination Survey (KNHANES IV-3) using a newly established vitamin D database. Nutrients 2016;8: pii: 610. [DOI] [PMC free article] [PubMed] [Google Scholar]
- [32].Ministry of Land, Infrastructure and Transport of Korea. Statistics of Urban Planning. [Internet]. Available at: http://www.index.go.kr/potal/main/EachDtlPageDetail.do?idx_cd=1200. Assessed August 30, 2017.
- [33].Statistics Korea. Agriculture, Forestry & Fishery Census. [Internet]. Available at: http://www.index.go.kr/potal/main/EachDtlPageDetail.do?idx_cd=2745. Assessed August 24, 2017. http://www.index.go.kr/potal/main/EachDtlPageDetail.do?idx_cd=3048. Assessed June 5, 2017.
- [34].Manicourt DH, Devogelaer JP. Urban tropospheric ozone increases the prevalence of vitamin D deficiency among Belgian postmenopausal women with outdoor activities during summer. J Clin Endocrinol Metab 2008;93:3893–9. [DOI] [PubMed] [Google Scholar]
- [35].Ministry of Environment of Korea. Urban Air Quality Information. [Internet]. Available at: https://www.me.go.kr/mamo/web/index.do?menuId=587. Assessed December 4, 2016.
- [36].Choi HS. Vitamin D status in Korea. Endocrinol Metab (Seoul) 2013;28:12–6. [DOI] [PMC free article] [PubMed] [Google Scholar]
- [37].Yang Z, Laillou A, Smith G, et al. A review of vitamin D fortification: implications for nutrition programming in Southeast Asia. Food Nutr Bull 2013;34(Suppl):S81–9. [DOI] [PubMed] [Google Scholar]
Associated Data
This section collects any data citations, data availability statements, or supplementary materials included in this article.


