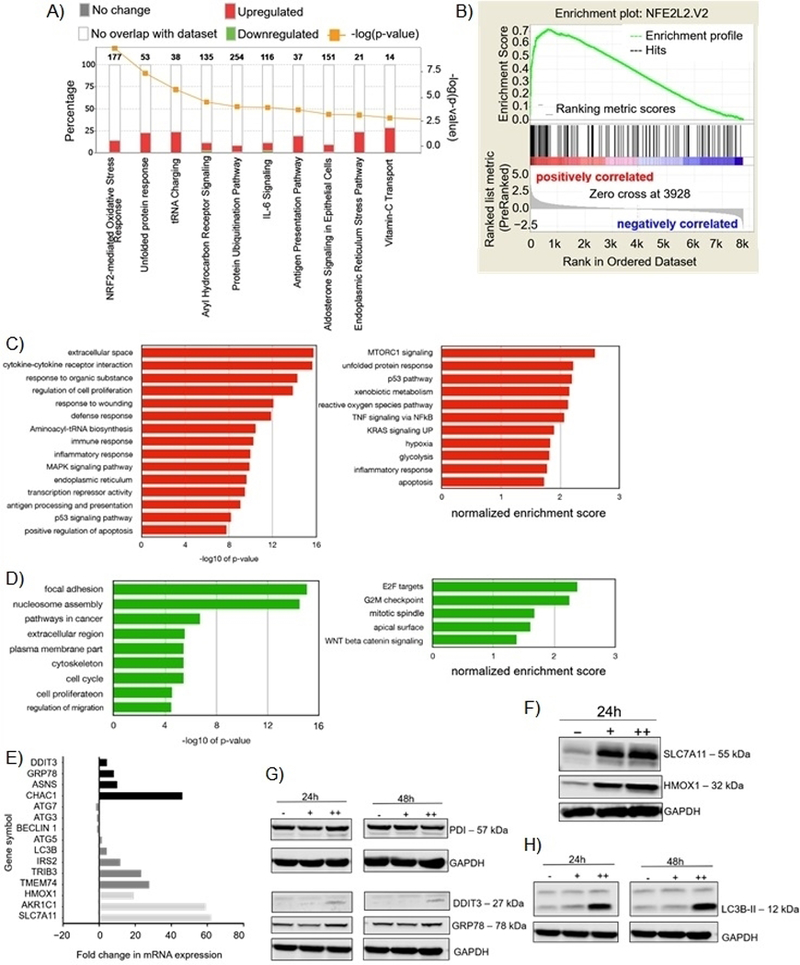
Figure 4.

Effects of 35G8 treatment on cellular pathways. (A) Pathways from the Bru-seq analysis of 35G8-treated cells. (B) GSEA for “NFE2L2.V2,” the top gene set matched with upregulated genes from Bru-seq results. Functional terms represented by genes upregulated (C) and downregulated (D) at least 2-fold by 35G8 treatment. Pathway analysis was performed using DAVID (left) and GSEA (right). (E) Histograms of differentially expressed proteins between 35G8-treated and DMSO-treated U87MG cells. Fold change bars are in black for UPR genes, dark grey for autophagy-related genes, and light grey for Nrf2-related genes. (F) Western blot showing Nrf2-regulated proteins SLC7A11 and HMOX1 expression upon 24-hour treatment of U87MG cells with 1 or 2 μM 35G8. GAPDH used as a loading control. (G) Western blot of ER stress-induced proteins DDIT3 and GRP78 expression upon 24-hour treatment of U87MG cells with 1 and 2 μM 35G8. GAPDH used as a loading control. (H) Western blot of autophagy-related proteins LC3B, beclin 1, ATG3, ATG5, and ATG7 expression upon 24-hour treatment of U87MG cells with 1 (+) and 2 (++) μM 35G8. -: vehicle-treated control. GAPDH used as a loading control. Experiments repeated in triplicate. .
