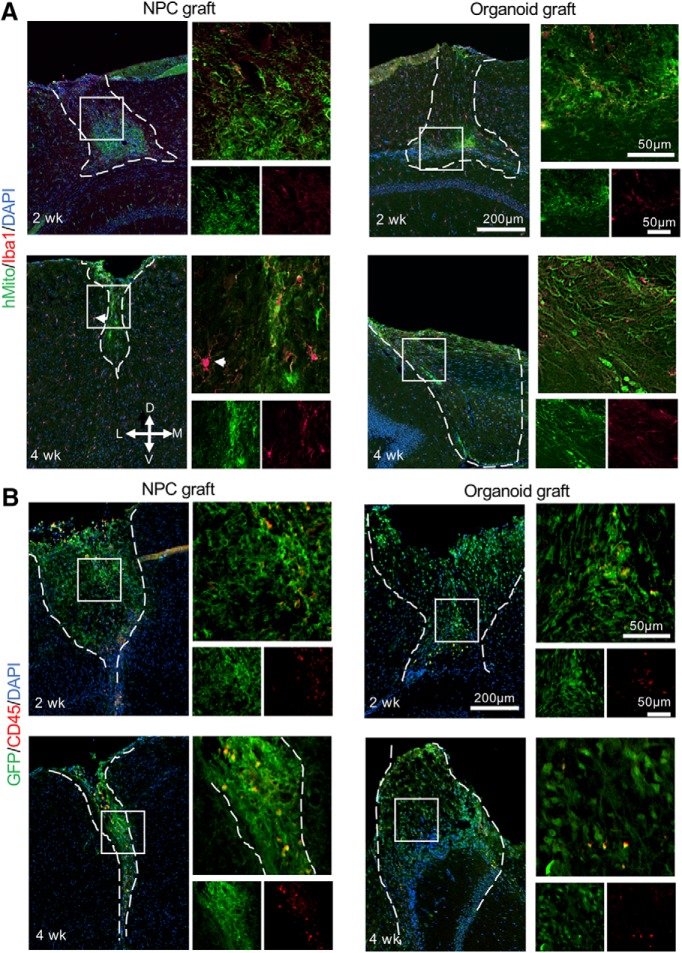
Figure 4.
Host immune response following NPC and organoid transplants. A, Representative immunofluorescence images of Iba1 in hMito-labeled grafts, at two and four weeks after transplantation. Note the hypertrophied Iba1+ microglia inside the NPC graft, as well as in host brain tissue adjacent to the NPC graft (white arrowhead). B, Representative immunofluorescence images of CD45 in GFP-labeled grafts at indicated time points. Dashed white lines delineate the graft areas. Enlarged images of the boxed area are shown on the right. D: dorsal, V: ventral, M: medial, L: lateral.

