Abstract
Objective
Currently, the only approved standard Duchenne muscular dystrophy (DMD) treatment in Japan is oral steroids, which have various disadvantages. Previous work has suggested that hematopoietic‐type prostaglandin D synthase (HPGDS), involved in production of the inflammatory mediator prostaglandin D2 (PGD2), might have a role in DMD pathology. We therefore investigated the safety, pharmacokinetics (PK), and pharmacodynamics of a highly selective HPGDS inhibitor (TAS‐205) in Japanese patients with genetically confirmed DMD.
Methods
This was a double‐blind, randomized, placebo‐controlled phase I study to evaluate the use of single or 7‐day repeated doses of TAS‐205 administered orally. The urinary excretion of PGD2 metabolites was also assessed.
Results
The PK analysis set included 15 and 14 patients in the single‐ and repeated‐dose periods, respectively; the pharmacodynamics set and the safety set included 21 and 19 patients in each period, respectively. The PK of TAS‐205 were linear in the dose range studied (1.67–13.33 mg/kg/dose) and the plasma concentration of TAS‐205 reached steady state by Day 4. TAS‐205 dose‐dependently decreased the urinary excretion of tetranor‐prostaglandin D metabolite at each measurement time point and did not affect the urinary excretion of tetranor‐prostaglandin E metabolite. No clinically significant adverse events were reported after TAS‐205 single or repeated administration.
Interpretation
We confirmed the safety and tolerability of TAS‐205 in this study. TAS‐205 decreased the total urinary excretion of PGD2 metabolites in a dose‐dependent manner, suggesting that TAS‐205 might be a therapeutic option to treat DMD patients.
Introduction
Duchenne muscular dystrophy (DMD), an X‐linked muscular disease with an incidence of ~1 in 3500 male births worldwide, is caused by mutations in the dystrophin gene. The loss of dystrophin in muscle fibers leads to myonecrosis, progressive muscle weakness, and, finally, the inability to walk at around 10 years of age.1, 2, 3 The exact mechanisms involved in disease development and progression are poorly understood, but there is evidence that aberrant inflammatory and immune responses play a role in DMD.3
DMD is fatal, and no complete cure is available. The only approved standard DMD treatment in Japan is oral steroids, which slow disease development4; however, the disadvantages of steroid‐associated adverse events (AEs) may lead to dose reduction, change in regimen, and dose suspension. Therefore, new treatments for DMD with better safety and efficacy profiles than steroids are required.
Hematopoietic‐type prostaglandin D synthase (HPGDS), involved in the production of the inflammatory mediator prostaglandin D2 (PGD2), is present in myonecrotic areas in DMD patients.5, 6 HQL‐79, an HPGDS‐specific inhibitor, significantly reduced necrotic muscle volume and the expression of inflammatory markers in two mouse models of muscle necrosis, suggesting the potential role of PGD2 and HPGDS in the pathology of DMD.7 A study of DMD patients aged 4–15 years reported increased urinary concentrations of tetranor‐prostaglandin D metabolite (t‐PGDM) in DMD patients aged ≥8 years, suggesting the potential role of PGD2‐mediated inflammation in DMD.8
TAS‐205 is a highly selective HPGDS inhibitor. The administration of TAS‐205 to dystrophin‐deficient mdx mice reduced muscle necrosis, recovered locomotor activity, and suppressed urinary t‐PGDM concentrations.9 We investigated the therapeutic potential of TAS‐205 by evaluating its safety, pharmacokinetics (PK), and pharmacodynamics (PD) after single or 7‐day repeated doses in DMD patients.
Patients and Methods
Study design
This was a double‐blind, randomized, placebo‐controlled, phase I, single‐ and repeated‐dose study of TAS‐205 administered as an oral tablet. The study protocol and all amendments received prior approval from the Institutional Review Board of the National Center Hospital, National Center of Neurology and Psychiatry. The study was conducted according to Good Clinical Practice guidelines, applicable local regulations, and the Declaration of Helsinki and was registered at ClinicalTrials.gov (NCT02246478).
The target population comprised male Japanese patients with DMD. The study took place from 29 September 2014, (first enrollment) to 18 June 2015, (last completed follow‐up) at the National Center Hospital, National Center of Neurology and Psychiatry, Tokyo, Japan. After written informed consent was obtained from the legal guardians of all patients at the time of enrollment, all attempts were made to obtain informed assent from patients. Eligible patients were randomly assigned to the TAS‐205 or placebo groups in both single‐dose and repeated‐dose cohorts.
The same patients received the investigational product in both the single‐ and repeated‐dose periods. In both periods, the total number of subjects in each step will be 7: 5 subjects in the TAS‐205 group and 2 subjects in the placebo group. In the former, patients were randomly assigned to receive TAS‐205 in Steps 1 (1.67–3.33 mg/kg), 2 (3.33–6.67 mg/kg), and 3 (6.67–13.33 mg/kg) or placebo, which was administered within 30 min after breakfast on Day 1. These patients then proceeded to the 7‐day repeated‐dose period (Steps A, B, and C, respectively) (Fig. S1) to receive twice daily dosing of TAS‐205 or placebo, respectively. The repeated‐dose cohort, therefore, consisted of patients newly enrolled to the repeated‐dose group (to replace patients meeting the discontinuation criteria and retain the necessary sample size) or those switching from the single‐ to the repeated‐dose group. Additional details regarding study design and discontinuation criteria are provided in the Data S1.
Patients in the single‐dose cohort received TAS‐205 (Step 1: 1.67–3.33, Step 2: 3.33–6.67, or Step 3: 6.67–13.33 mg/kg/dose) or placebo within 30 min after breakfast. Those in the repeated‐dose cohort received TAS‐205 (Step A: 1.67–3.33, Step B: 3.33–6.67, or Step C: 6.67–13.33 mg/kg/dose) twice daily, within 30 min after breakfast and dinner, or placebo, on Days 1–7. Follow‐up was performed on Day 8 (single dose) or Day 14 (repeated dose). Prohibited and allowed therapies are described in the Data S1.
Patients
Major inclusion criteria were male patients aged 5–15 years at the time of providing informed consent; ability to take oral tablets; weighing ≥15 kg and <75 kg; diagnosis of dystrophinopathy determined by a dystrophin genetic test or muscle pathology, for whom the diagnosis was supported by clinical symptoms or signs of DMD (proximal muscular weakness, waddling gait, Gowers’ sign, and progressive ambulatory disability); and confirmed urinary t‐PGDM/creatinine (Cre) concentration ratio ≥5.0 ng/mg Cre within 14 days before enrollment.
Major exclusion criteria were forced vital capacity of <50% of the predicted value within 14 days before enrollment, patients with a left ventricular ejection fraction <50% or left ventricular fractional shortening <25% on cardiac ultrasonography performed within 14 days before enrollment, and those with any systemic allergic disease or chronic inflammatory disease.
Assessments
Safety
The incidences of AEs and adverse drug reactions (ADRs) were calculated using the Medical Dictionary for Regulatory Activities criteria and were further evaluated according to the Common Terminology Criteria for Adverse Events v4.0 (Japan Clinical Oncology Group edition). AE severity was also assessed.
For the single‐dose cohort, laboratory tests, vital signs, and 12‐lead electrocardiography (ECG) were assessed within 14 days before enrollment, Days 2 and 3 post‐TAS‐205 administration, and at follow‐up. Vital signs and 12‐lead ECG were also assessed on Day 1, and laboratory tests were assessed on Day−1.
For the repeated dose cohort, laboratory tests, vital signs, and 12‐lead ECG were assessed before enrollment; on Days−1, 4, and 8; and at follow‐up. Additionally, vital signs and 12‐lead ECG were assessed on Days 1 and 7, and vital signs alone were assessed on Days 2, 3, 5, and 6.
Pharmacokinetics
The following PK parameters were calculated for the single‐dose period using plasma or urine concentrations of TAS‐205 by means of non‐compartmental analysis: maximum plasma concentration (C max), time to maximum plasma concentration (t max), area under the plasma concentration–time curve from time 0 to 48 h post‐dose (AUC0‐48), area under the plasma concentration–time curve from time 0 to infinity (AUC0‐inf), half‐life of elimination (t1/2), and urinary excretion rate. For the repeated‐dose cohort, C max, t max, and AUC0‐8 were calculated on Days 1 and 7.
Pharmacodynamics
The effects of TAS‐205 on urinary excretion of t‐PGDM and tetranor‐prostaglandin E metabolite (t‐PGEM) were assessed by comparisons with placebo. The following PD parameters were calculated at each sampling point for the single‐ and repeated‐dose administration periods: t‐PGDM/Cre concentration ratio, t‐PGEM/Cre concentration ratio, excretion amount of t‐PGDM (Ex[t‐PGDM]), and excretion amount of t‐PGEM (Ex[t‐PGEM]). Details regarding sample collection and measurements of drug or biomarker concentrations are provided in the Data S1.
Statistical analysis
The target sample size was not statistically determined because of the rarity of the disease. The analysis set included all enrolled, randomized, and eligible patients administered TAS‐205 who were included in the PK and PD evaluations. Patients administered TAS‐205 were included in the safety analysis set. Summary statistics were used to assess laboratory tests, vital signs, and 12‐lead ECG data using SAS Version 9.2 (SAS Institute Inc., Cary, NC, USA). Phoenix® WinNonlin® 6.3 (Pharsight Corporation, Sunnyvale, CA, USA) was used to analyze plasma concentrations. The dose proportionality of C max, AUC0‐48, and AUC0‐inf was evaluated by one‐way analysis of variance (ANOVA) of the log‐transformed, dose‐normalized PK parameters. The effect of repeated doses on PK was assessed based on point estimates of geometric mean ratios of C max and AUC0‐8 on Day 7 versus Day 1, and trough plasma concentration (Cpre) on Day 7 versus Day 4 with corresponding 90% confidence intervals (CIs).
For each PD parameter, multiple comparisons were made between the placebo and TAS‐205 groups. For the differences in logarithmically transformed values of PD parameters before and after administration of TAS‐205, a Dunnett test was conducted with the EXSUS 8.0.0 terminal (CAC EXICARE Corporation, Tokyo, Japan) at each time point or on each day of sample collection, using the placebo group as the control group. MedCalc version 16 (MedCalc Software, Ostend, Belgium) was used to develop box plots. A P < 0.05 was considered statistically significant.
Results
Study flow
Of 21 patients enrolled, 15 were randomized to the TAS‐205 group (n = 5 per step) and 6 were randomized to the placebo group (n = 2 per step) (Figs. 1, 2, 3, 4). All of the enrolled patients were eligible to participate in the present study. The PK analysis set included 15 and 14 patients in the single‐ and repeated‐dose periods; the pharmacodynamics set and the safety set included 21 (TAS‐205, n = 15; placebo, n = 6) and 19 (TAS‐205, n = 14; placebo, n = 5) patients in the single‐ and repeated‐dose periods, respectively.
Figure 1.
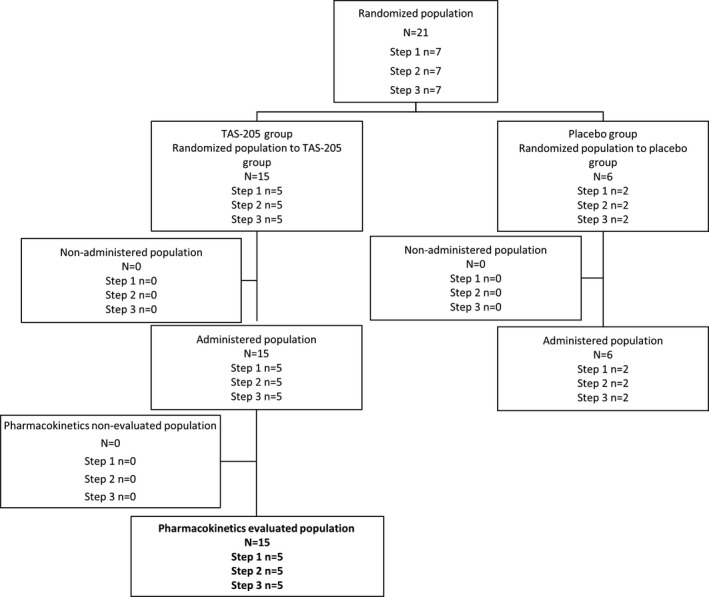
Study flow. Disposition of patients in the single‐dose period included in PK evaluation. PK, pharmacokinetics.
Figure 2.
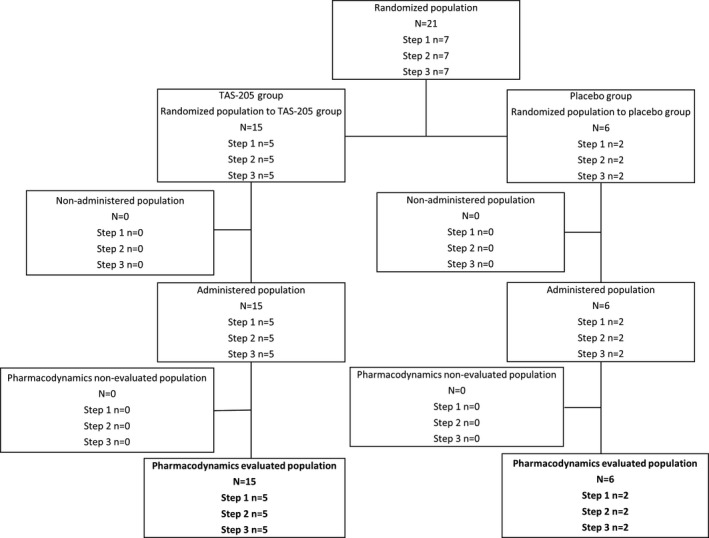
Study flow. Disposition of patients in the single‐dose period included in PD evaluation. PD, pharmacodynamics.
Figure 3.
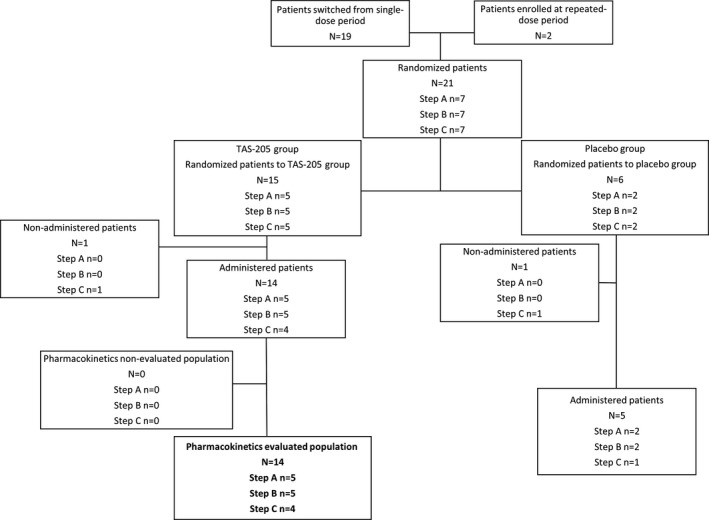
Study flow. Disposition of patients in the repeated‐dose period included in PK evaluation. PK, pharmacokinetics.
Figure 4.
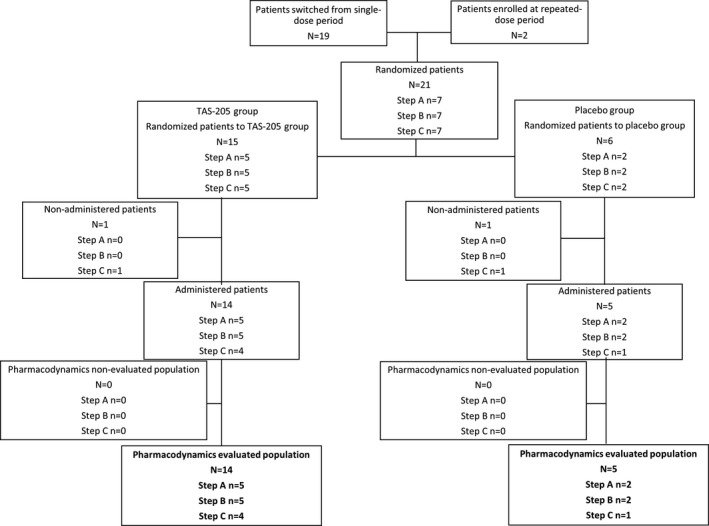
Study flow. Disposition of patients in the repeated‐dose period included in PD evaluation. PD, pharmacodynamics.
Patient characteristics
Patient characteristics are shown in Table 1 and Data S2. All groups (single and repeated dose) showed a similar age, weight, height, use of steroids, and ambulatory ability at all steps. DMD was diagnosed by genetic test in 16 patients, and by genetic test and muscle biopsy in 7 patients. There was no difference in patient background between the TAS‐205 and placebo groups in any step of the single‐ or repeated‐dose periods.
Table 1.
Patient characteristics in the single‐ and repeated‐dose periods by step
| Single‐dose period | Step | 1 | 2 | 3 | |||
|---|---|---|---|---|---|---|---|
| Group | TAS‐205 (n = 5) | Placebo (n = 2) | TAS‐205 (n = 5) | Placebo (n = 2) | TAS‐205 (n = 5) | Placebo (n = 2) | |
| Age (years) | Mean (SD) | 11.6 (1.7) | 11.0 (0.0) | 10.8 (2.3) | 10.5 (4.9) | 10.4 (3.4) | 9.0 (5.7) |
| Median | 12.0 | 11.0 | 11.0 | 10.5 | 11.0 | 9.0 | |
| Min–Max | 9–13 | 11–11 | 7–13 | 7–14 | 6–14 | 5–13 | |
| Weight (kg) | Mean (SD) | 44.96 (16.12) | 41.60 (4.38) | 36.78 (11.58) | 41.25 (23.83) | 38.80 (11.84) | 30.90 (19.23) |
| Median | 37.30 | 41.60 | 38.60 | 41.25 | 44.00 | 30.90 | |
| Min–Max | 26.8–62.9 | 38.5–44.7 | 18.7–50.7 | 24.4–58.1 | 23.8–49.5 | 17.3–44.5 | |
| Height (cm) | Mean (SD) | 136.26 (20.51) | 137.90 (1.98) | 119.46 (5.39) | 128.50 (23.33) | 129.92 (14.91) | 127.45 (30.48) |
| Median | 133.30 | 137.90 | 120.30 | 128.50 | 135.20 | 127.45 | |
| Min–Max | 113.0–161.5 | 136.5–139.3 | 111.0–124.5 | 112.0–145.0 | 111.3–145.0 | 105.9–149.0 | |
| Concomitant steroid | No | 0 (0.0) | 0 (0.0) | 0 (0.0) | 0 (0.0) | 0 (0.0) | 0 (0.0) |
| Yes | 5 (100.0) | 2 (100.0) | 5 (100.0) | 2 (100.0) | 5 (100.0) | 2 (100.0) | |
| Ambulatory ability | Possible | 1 (20.0) | 1 (50.0) | 2 (40.0) | 1 (50.0) | 3 (60.0) | 1 (50.0) |
| Impossible | 4 (80.0) | 1 (50.0) | 3 (60.0) | 1 (50.0) | 2 (40.0) | 1 (50.0) | |
| Repeated‐dose period | Step | A | B | C | |||
| Group | TAS‐205 (n = 5) | Placebo (n = 2) | TAS‐205 (n = 5) | Placebo (n = 2) | TAS‐205 (n = 4) | Placebo (n = 1) | |
| Age (years) | Mean (SD) | 11.2 (2.5) | 11.0 (0.0) | 10.8 (2.3) | 10.5 (4.9) | 10.0 (3.4) | 13.0 (–) |
| Median | 12.0 | 11.0 | 11.0 | 10.5 | 10.0 | 13.0 | |
| Min–Max | 7–13 | 11–11 | 7–13 | 7–14 | 6–14 | 13–13 | |
| Weight (kg) | Mean (SD) | 43.60 (18.19) | 41.60 (4.38) | 36.78 (11.58) | 41.25 (23.83) | 35.35 (13.86) | 44.50 (–) |
| Median | 37.30 | 41.60 | 38.60 | 41.25 | 36.25 | 44.50 | |
| Min–Max | 20.0–62.9 | 38.5–44.7 | 18.7–50.7 | 24.4–58.1 | 19.4–49.5 | 44.5–44.5 | |
| Height (cm) | Mean (SD) | 135.70 (21.33) | 137.90 (1.98) | 119.46 (5.39) | 128.50 (23.33) | 127.78 (15.17) | 149.00 (–) |
| Median | 133.30 | 137.90 | 120.30 | 128.50 | 127.40 | 149.00 | |
| Min–Max | 110.2–161.5 | 136.5–139.3 | 111.0–124.5 | 112.0–145.0 | 111.3–145.0 | 149.0–149.0 | |
| Concomitant steroid | No | 0 (0.0) | 0 (0.0) | 0 (0.0) | 0 (0.0) | 0 (0.0) | 0 (0.0) |
| Yes | 5 (100.0) | 2 (100.0) | 5 (100.0) | 2 (100.0) | 4 (100.0) | 1 (100.0) | |
| Ambulatory ability | Possible | 1 (20.0) | 1 (50.0) | 2 (40.0) | 1 (50.0) | 3 (75.0) | 0 (0.0) |
| Impossible | 4 (80.0) | 1 (50.0) | 3 (60.0) | 1 (50.0) | 1 (25.0) | 1 (100.0) | |
Target population: study drug administered population. Data are shown as n (%). SD, standard deviation.
One patient had a protocol deviation (additional details provided in the Data S2). Therefore, no accurate PK parameter was obtained from this patient. The data from this patient were used for the PK/PD‐evaluated population and PK and PD calculations, but not for the summary statistics and analysis.
Pharmacokinetics
Summary statistics of PK parameters in each step for the single‐ and repeated‐dose groups were obtained (Table 2). In Steps 1, 2, and 3 for the single‐dose period, the median t max and mean t1/2 were 2.00, and 7.05–8.61 h, respectively. The mean urinary excretion rate was 24.98–31.89%. There were no obvious differences among steps in these parameters. The C max/dose, AUC0‐48/dose, and AUC0‐inf/dose in Steps 1, 2, and 3 were assessed (Fig. 5). Additional PK results are described in the Data S2.
Table 2.
Pharmacokinetic parameters of TAS‐205 in the single‐ and repeated‐dose periods
| Single‐dose period | |||||||
|---|---|---|---|---|---|---|---|
| Step | Summary statistics | t1/2 (h) | t max (h) | C max (ng/mL) | AUC0‐48 (ng·h/mL) | AUC0‐inf (ng·h/mL) | Ae (%) |
| 1 (n = 5) | Mean (SD) or median (min–max) | 8.61 (4.20) | 2.00 (0.50–2.00) | 839 (383) | 2729 (901) | 2759 (936) | 24.98 (3.81) |
| CV (%) | 48.7 | NA | 45.6 | 33.0 | 33.9 | 15.3 | |
| 2 (n = 5) | Mean (SD) or median (min–max) | 7.70 (3.16) | 2.00 (1.00–2.00) | 1847 (996) | 5946 (2967) | 5962 (2967) | 26.53 (3.84) |
| CV (%) | 41.1 | NA | 53.9 | 49.9 | 49.8 | 14.5 | |
| 3 (n = 5) | Mean (SD) or median (min–max) | 7.05 (4.07) | 2.00 (1.00–2.00) | 3202 (1493) | 9401 (3493) | 9446 (3646) | 31.89 (9.40) |
| CV (%) | 57.8 | NA | 46.6 | 37.2 | 38.6 | 29.5 | |
| Repeated‐dose period | |||||||
| Day 1 | Day 7 | Day 4 | Day 7 | ||||
| Step | Summary statistics | t max, day 1 (h) | C max, day 1 (ng/mL) | t max, day 7 (h) | C max, day 7 (ng/mL) | Cpre, day 4 (ng/mL) | Cpre, day 7 (ng/mL) |
| A (n = 5) | Mean (SD) or median (min–max) | 2.00 (1.00–2.00) | 1004 (656) | 2.00 (2.00–2.00) | 891 (297) | 42.9 (19.9) | 41.1 (14.2) |
| CV (%) | NA | 65.3 | NA | 33.3 | 46.3 | 34.6 | |
| B (n = 5) | Mean (SD) or median (min–max) | 2.00 (1.00–2.00) | 1894 (691) | 2.00 (1.00–2.00) | 2322 (776) | 68.94 (41.0) | 70.9 (36.0) |
| CV (%) | NA | 36.5 | NA | 33.4 | 59.6 | 50.7 | |
| C (n = 3) | Mean (SD) or median (min–max) | 2.00 (2.00–4.00) | 2635 (2813) | 2.00 (0.50–2.00) | 4660 (3671) | 75.9 (34.7) | 98.7 (55.7) |
| CV (%) | NA | 106.8 | NA | 78.8 | 45.8 | 56.5 | |
SD, standard deviation; CV, coefficient of variation; C max, maximum plasma concentration; AUC0‐48, area under the plasma concentration–time curve from 0 to 48 h post‐dose; AUC0‐inf, AUC to infinite time; t1/2, half‐life of elimination; Ae, urinary excretion rate; t max, time to maximum plasma concentration; Cpre, trough plasma concentration.
Figure 5.

Comparisons of (A) C max/dose, (B) AUC0‐48/dose, and (C) AUC0‐inf/dose values of TAS‐205 among steps in the single‐dose period. N = 5. The solid line shows the median; the square shows the mean. Box ends represent 25th and 75th percentiles. Whiskers show the maximums and minimums. C max, maximum plasma concentration; AUC0‐48, area under the plasma concentration–time curve from time 0 to 48 h post‐dose, AUC0‐inf, area under the plasma concentration–time curve from time 0 to infinity.
Pharmacodynamics
In the single‐administration period, there were no significant differences in the ratios of either biomarker between TAS‐205 and placebo groups. Changes in t‐PGDM/Cre and t‐PGEM/Cre ratios in pooled urine relative to baseline over time for the repeated‐dose period were assessed (Fig. 6A and B). Time‐specific multiple comparisons with the placebo group as a control revealed that t‐PGDM/Cre ratios on Day 1/Step B (P = 0.0487), Day 4/Step C (P = 0.0190), and Day 7/Step C (P = 0.0448) were significantly lower in the treatment group versus placebo (Fig. 6A). The amounts of Ex(t‐PGDM) and Ex(t‐PGEM) from the repeated‐dose administration period were also assessed (Fig. 7A and B). The time‐specific multiple comparison with the placebo group as a control revealed that Ex(t‐PGDM) on Day 7/Step C was significantly lower in the treatment group versus placebo (P = 0.0299) (Fig. 7A).
Figure 6.
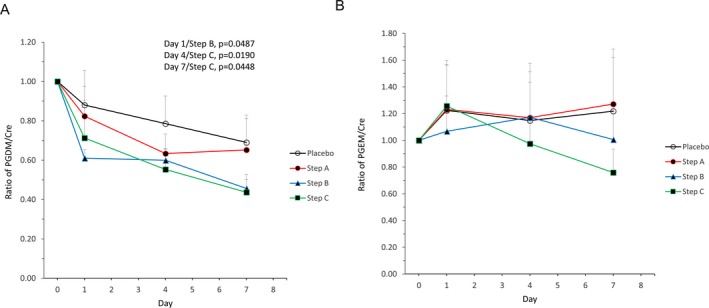
Time‐dependent changes in the ratio of (A) tetranor‐PGDM/Cre and (B) tetranor‐PGEM/Cre in pooled urine in the repeated‐dose period. Mean + standard deviation (n = 3–5). Day 0 = pre‐dose. PGDM, prostaglandin D metabolite; Cre, creatinine; PGEM, prostaglandin E metabolite.
Figure 7.
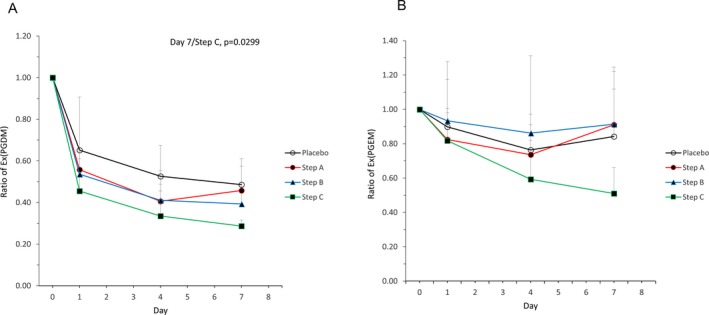
Time‐dependent changes in the ratio of (A) Ex(tetranor‐PGDM) and (B) Ex(tetranor‐PGEM) in pooled urine in the repeated‐dose period. Mean + standard deviation (n = 3–5). Day 0 = pre‐dose. PGDM, prostaglandin D metabolite; PGEM, prostaglandin E metabolite.
The mean ratios of t‐PGDM/Cre, t‐PGEM/Cre, Ex(t‐PGDM), and Ex(t‐PGEM) relative to baseline in the placebo group and Steps A, B, and C are shown in Table 3. A comparison of t‐PGDM/Cre, Ex(t‐PGDM), t‐PGEM/Cre, and Ex(t‐PGEM) values in pre‐dosing pooled urine between ambulatory and nonambulatory patients in the single‐ and repeated‐dose periods was obtained (Fig. 8A and B). For both single‐ and repeated‐dose administration periods, one‐way ANOVA revealed that PGDM/Cre and PGEM/Cre in pooled urine were significantly higher in nonambulatory versus ambulatory patients.
Table 3.
Mean ratios of t‐PGDM/Cre, t‐PGEM/Cre, Ex(t‐PGDM), and Ex(t‐PGEM) relative to baseline in the placebo group and Steps A, B, and C.
| Placebo | Step A | Step B | Step C | |||||||||
|---|---|---|---|---|---|---|---|---|---|---|---|---|
| Day 1 | Day 4 | Day 7 | Day 1 | Day 4 | Day 7 | Day 1 | Day 4 | Day 7 | Day 1 | Day 4 | Day 7 | |
| Mean ratios of t‐PGDM/Cre relative to baseline | 0.88 | 0.79 | 0.69 | 0.82 | 0.63 | 0.65 | 0.61 | 0.60 | 0.46 | 0.71 | 0.55 | 0.44 |
| Mean ratios of t‐PGEM/Cre relative to baseline | 1.22 | 1.15 | 1.22 | 1.23 | 1.17 | 1.27 | 1.07 | 1.17 | 1.01 | 1.26 | 0.98 | 0.76 |
| Mean ratios of Ex(t‐PGDM) relative to baseline | 0.65 | 0.53 | 0.49 | 0.56 | 0.41 | 0.46 | 0.54 | 0.41 | 0.39 | 0.46 | 0.34 | 0.29 |
| Mean ratios of Ex(t‐PGEM) relative to baseline | 0.90 | 0.76 | 0.84 | 0.82 | 0.74 | 0.91 | 0.93 | 0.86 | 0.91 | 0.82 | 0.59 | 0.51 |
For each assessment item and group shown in the table, the mean ratio on Day 0 is 1.00. Cre, creatinine; Ex(t‐PGDM), excreted t‐PGDM; Ex(t‐PGEM), excreted t‐PGEM; t‐PGDM, tetranor‐prostaglandin D metabolite; t‐PGEM, tetranor‐prostaglandin E metabolite.
Figure 8.
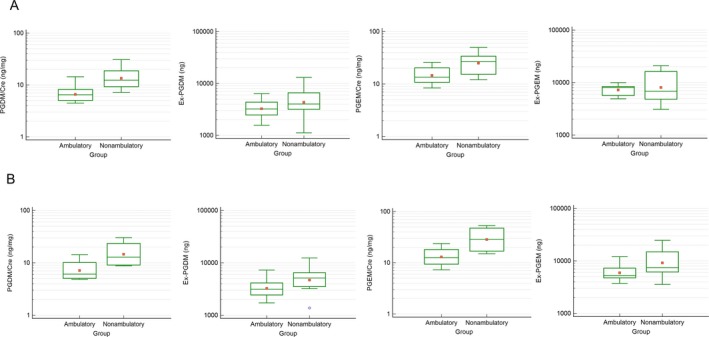
Comparison of tetranor‐PGDM/Cre, Ex(tetranor‐PGDM), tetranor‐PGEM/Cre, and Ex(tetranor‐PGEM) ratios in pre‐dosing pooled urine between ambulatory and nonambulatory patients in (A) the single‐dose and (B) repeated‐dose periods. Ambulatory patients (A: n = 9, B: n = 8); nonambulatory patients (A: n = 12, B: n = 11). The solid line shows the median; the square shows the mean. Box ends represent 25th and 75th percentiles. Whiskers show the maximums and minimums. The open circle in (B) represents an outlier. PGDM, prostaglandin D metabolite; Cre, creatinine; PGEM, prostaglandin E metabolite.
Safety
No deaths or other serious AEs were reported. No patients were withdrawn from the study because of AEs in either dosing period. The AEs and ADRs from single‐ and repeated‐dose administration of TAS‐205 were collected (Table 4). In the single‐dose period, blood bilirubin increased, cystatin C increased, and hyperuricemia were considered ADRs. In the repeated‐dose period, none of the AEs were considered an ADR.
Table 4.
Total incidence of AEs and ADRs in single‐ and repeated‐dose periods.
| MedDRA (ver.18.0) preferred term | Total AE n (%) | Total ADR n (%) | |||
|---|---|---|---|---|---|
| Single dose | |||||
| Step | TAS‐205 | Placebo | TAS‐205 | Placebo | |
| 1 | (n = 5) | (n = 2) | (n = 5) | (n = 2) | |
| Any AE or ADR | 3 (60.0) | 0 (0.0) | 1 (20.0) | 0 (0.0) | |
| Catheter site pain | 2 (40.0) | 0 (0.0) | ‐ | ‐ | |
| Blood bilirubin increased | 1 (20.0) | 0 (0.0) | 1 (20.0) | 0 (0.0) | |
| 2 | (n = 5) | (n = 2) | (n = 5) | (n = 2) | |
| Any AE or ADR | 1 (20.0) | 0 (0.0) | 1 (20.0) | 0 (0.0) | |
| Cystatin C increased | 1 (20.0) | 0 (0.0) | 1 (20.0) | 0 (0.0) | |
| 3 | (n = 5) | (n = 2) | (n = 5) | (n = 2) | |
| Any AE or ADR | 1 (20.0) | 0 (0.0) | 1 (20.0) | 0 (0.0) | |
| Hyperuricemia | 1 (20.0) | 0 (0.0) | 1 (20.0) | 0 (0.0) | |
| Repeated dose | |||||
| Step | TAS‐205 | Placebo | TAS‐205 | Placebo | |
| A | (n = 5) | (n = 2) | (n = 5) | (n = 2) | |
| Any AE or ADR | 1 (20.0) | 0 (0.0) | 0 (0.0) | 0 (0.0) | |
| Epistaxis | 1 (20.0) | 0 (0.0) | ‐ | ‐ | |
| B | (n = 5) | (n = 2) | (n = 5) | (n = 2) | |
| Any AE or ADR | 3 (60.0) | 0 (0.0) | 0 (0.0) | 0 (0.0) | |
| Abdominal pain | 1 (20.0) | 0 (0.0) | ‐ | ‐ | |
| Nasopharyngitis | 1 (20.0) | 0 (0.0) | ‐ | ‐ | |
| Ligament sprain | 1 (20.0) | 0 (0.0) | ‐ | ‐ | |
| Erythema | 1 (20.0) | 0 (0.0) | ‐ | ‐ | |
| Nail bed bleeding | 1 (20.0) | 0 (0.0) | ‐ | ‐ | |
| C | (n = 4) | (n = 1) | (n = 4) | (n = 1) | |
| Any AE or ADR | 1 (25.0) | 0 (0.0) | 0 (0.0) | 0 (0.0) | |
| Arthropod sting | 1 (25.0) | 0 (0.0) | ‐ | ‐ | |
| All steps | (n = 14) | (n = 5) | (n = 14) | (n = 5) | |
| Any AE or ADR | 5 (35.7) | 0 (0.0) | 0 (0.0) | 0 (0.0) | |
Analyzed population: patients administered the study drugs. All AEs and ADRs were classified as mild. Data are shown as n (%). AEs, adverse events; ADRs: adverse drug reactions.
AEs and ADRs occurred more frequently in the TAS‐205 group; however, no AEs were common to all steps or increased dose‐dependently in either dosing period. All AEs reported in each dosing period were resolving or resolved, and none were clinically significant.
No clinically significant abnormal changes were observed in laboratory values, 12‐lead ECG, blood pressure, pulse rate, or body temperature between the TAS‐205 and placebo groups in the single‐ or repeated‐dose groups before and after administration, except for an abnormal change in body temperature in 1 of 5 patients (20.0%) in Step B in the TAS‐205 group, which was associated with nasopharyngitis but was unrelated to TAS‐205.
Discussion
This study evaluated the safety, tolerability, PK, and PD of TAS‐205, a novel selective HPGDS inhibitor, in Japanese DMD patients. No clinically significant AEs were reported after TAS‐205 single‐ or repeated‐dose administration. No dose‐dependent increase in the incidence of AEs was shown. The severity of all AEs was mild, and all were resolved. ADRs of blood bilirubin increased, cystatin C increased, and hyperuricemia were each reported in 20.0% of patients. In all cases, these values increased on Day 2 after administration, but decreased to values that were within the range standard for the site during follow‐up. In the cases of elevated cystatin C and hyperuricemia, the patients had levels near or above the upper limit of the standard value at screening.
Regarding the PK analysis, the plasma concentration of TAS‐205 increased with increasing dose. Based on the results in the single‐dose administration period, the C max, and AUC values of TAS‐205 were dose‐proportional in the dose range studied (1.67–13.33 mg/kg/dose), which demonstrates that TAS‐205 followed a linear PK. In the repeated‐dose administration period, the 90% CI of the geometric mean ratio of Cpre on Day 7 versus Day 4 included 1 in all steps; therefore, the plasma concentration of TAS‐205 reached a steady state by Day 4. Furthermore, the geometric mean ratio of C max and AUC0‐8 on Day 7 versus Day 1 with the corresponding 90% CI suggested a minimal increase in the plasma concentration of TAS‐205 after repeated doses. The plasma concentration of TAS‐205 reached a steady state by Day 4, and no marked accumulation after repeated TAS‐205 administration was observed.
Regarding the PD analysis, t‐PGDM/Cre ratios (on Day 1/Step B, Day 4/Step C, and Day 7/Step C) and Ex(t‐PGDM) (on Day 7/Step C) were significantly lower in the treatment versus placebo group; the placebo group also showed a decreasing trend. This can be explained by the fact that our patients were hospitalized; thus, our results are as expected in patients who have limited mobility. In contrast, the study by Nakagawa et al. was not conducted under hospitalization; thus, we could not compare these results.8
For the main PD analysis results, multiple comparisons indicated that, in the repeated‐dose period, TAS‐205 significantly decreased urinary PGDM/Cre at 3.33–6.67 and 6.67–13.33 mg/kg/dose. Furthermore, the Ex(t‐PGDM) in the TAS‐205 group at 6.67–13.33 mg/kg/dose was significantly lower than that of the placebo group. However, TAS‐205 had no effect on either t‐PGEM/Cre or Ex(t‐PGEM). In the present study, PGD2 has an inhibitory effect on muscle fiber regeneration, while prostaglandin E2 and major prostaglandin promote muscle fiber regeneration.10 Therefore, increased muscle fiber regeneration is achieved by selectively inhibiting PGD2. As TAS‐205 was developed to selectively inhibit PGD2, it was suggested that TAS‐205 would be effective in the treatment of DMD.
DMD patients progressively lose the ability to walk.11 Consistent with a previous report,12 the t‐PGDM/Cre ratio in nonambulatory patients was significantly higher compared with that in ambulatory patients. This indicates that the t‐PGDM/Cre ratio may be a surrogate biomarker for DMD progression such as gradual loss of ambulatory ability.
Nakagawa et al. found no difference between DMD patients with and without steroid use when comparing the PGDM/Cre ratio in spot urine.8 Takeshita et al.12 used 24‐hour urine and reported no effect of steroids on PGDM/Cre. However, steroids are known to inhibit prostaglandin synthase or cyclooxygenase, resulting in inhibition of prostaglandin production.13 Taken together, the reports by Nakagawa et al. and Takeshita et al. suggest that the process of PGD2 production may not be affected by steroids. In the present study, we confirmed the effect of TAS‐205 on PGD2 production by the significant PGDM/Cre inhibition shown in the TAS‐205 group. The relationship between PGD2 and muscle necrosis in relation to DMD pathology has been reported.5, 6 Although, the effect of steroids on DMD pathology is unknown,14 the effect of TAS‐205 on DMD pathology may differ to that of steroids. Therefore, it was considered that the combined use of steroid and TAS‐205 could be useful in DMD. The effect of steroids on the DMD pathology, besides safety and PK profile, of TAS‐205 could not be investigated because all patients received combination steroid therapy; therefore this should be investigated in the future.
A limitation of this study was its small sample size, which may cause sampling errors, such as large variability of within‐ and between‐subject values, or bias, and might affect the precision and interpretation of the results. Therefore, further studies with larger sample sizes should be performed to confirm our current findings.
TAS‐205 decreased the total Ex(t‐PGDM) and the t‐PGDM/Cre ratio in a dose‐dependent manner under steroid treatment, suggesting that these factors might be effective biomarkers for the action of TAS‐205 in DMD pathology. In DMD patients, Cre decreases along with decreasing muscle volume.15 Considering that PGD2 is generated by the muscle, it is important to correct it by muscle mass in order to evaluate patients with different muscle masses. Therefore, we used ng/mg Cre corrected by Cre to reflect the PGD2 production volume per unit of muscle mass.
A previous study reported high PGDM/Cre values and high HPGDS immunoreactivity in myonecrosis areas of DMD patients.6, 8 Because TAS‐205 inhibits PGD2 production, which is involved in the spread of myonecrosis, TAS‐205 might delay the decline of physical function in DMD patients by selectively inhibiting HPGDS. The efficacy and safety of TAS‐205 should be assessed by investigating its effects on the motor function, muscle volume, and PD of a large DMD population. Currently, a phase IIa study to evaluate the efficacy of TAS‐205 in DMD is ongoing (Clinical gov: NCT02752048).
In conclusion, TAS‐205 was safe and tolerable in patients with DMD when administered as single and repeated doses of 1.67–13.33 mg/kg twice daily for 7 days. The PK profile of TAS‐205 was determined, including linearity and time to steady state. TAS‐205 decreased the total excretion of t‐PGDM and t‐PGDM/Cre ratios in a dose‐dependent manner. Further studies to evaluate the efficacy of TAS‐205 in patients with DMD are required.
Author contributions
Conception and design of the study: ET, HK, and ST. Acquisition and collection of data: ET, HK, YS, AI, and MS. Data analysis and interpretation: ET, HK, and ST. Drafting of the manuscript: All authors. Final approval of the manuscript: All authors. Accountable for all aspects of the work: All authors.
Conflicts of interest
HK received a grant from Taiho Pharmaceutical Co., Ltd., which manufactures the drug used in this study, during the conduct of this study. ET and ST received grants from Taiho Pharmaceutical Co., Ltd., outside the submitted work. YS, AI, and MS have no other conflicts of interest of direct relevance to the current research.
Supporting information
Figure S1. Study design. aReplacement of patients occurred (during the repeated dose period enrollment) only if any patient failed to proceed to the repeated dose period or met the discontinuation criteria after single‐dose administration of the investigational product; the newly enrolled patients received repeated doses only.
Data S1. Methods.
Data S2. Results.
Acknowledgments
The authors thank Taiho Pharmaceutical Co., Ltd., for providing funding for this study. The authors also wish to thank the participating patients and their families; all the investigators, site staff, and operation staff who participated in the study; and J. Ludovic Croxford, PhD, and Ms Hikari Chiba of Edanz Medical Writing for providing medical writing services.
Funding Information
The authors thank Taiho Pharmaceutical Co., Ltd., for providing funding for this study.
Funding Statement
This work was funded by Taiho Pharmaceutical Co., Ltd. grant .
References
- 1. Hoffman EP, Brown RH Jr, Kunkel LM. Dystrophin: the protein product of the Duchenne muscular dystrophy locus. Cell 1987;51:919–928. [DOI] [PubMed] [Google Scholar]
- 2. Theadom A, Rodrigues M, Roxburgh R, et al. Prevalence of muscular dystrophies: a systematic literature review. Neuroepidemiology 2014;43:259–268. [DOI] [PubMed] [Google Scholar]
- 3. Evans NP, Misyak SA, Robertson JL, et al. Dysregulated intracellular signaling and inflammatory gene expression during initial disease onset in Duchenne muscular dystrophy. Am J Phys Med Rehabil 2009;88:502–522. [DOI] [PubMed] [Google Scholar]
- 4. Falzarano MS, Scotton C, Passarelli C, et al. Duchenne muscular dystrophy: from diagnosis to therapy. Molecules 2015;20:18168–18184. [DOI] [PMC free article] [PubMed] [Google Scholar]
- 5. Urade Y, Hayaishi O. Prostaglandin D synthase: structure and function. Vitam Horm 2000;58:89–120. [DOI] [PubMed] [Google Scholar]
- 6. Okinaga T, Mohri I, Fujimura H, et al. Induction of hematopoietic prostaglandin D synthase in hyalinated necrotic muscle fibers: its implication in grouped necrosis. Acta Neuropathol 2002;104:377–384. [DOI] [PubMed] [Google Scholar]
- 7. Mohri I, Aritake K, Taniguchi H, et al. Inhibition of prostaglandin D synthase suppresses muscular necrosis. Am J Pathol 2009;174:1735–1744. [DOI] [PMC free article] [PubMed] [Google Scholar]
- 8. Nakagawa T, Takeuchi A, Kakiuchi R, et al. A prostaglandin D2 metabolite is elevated in the urine of Duchenne muscular dystrophy patients and increases further from 8 years old. Clin Chim Acta 2013; 423: 10–14. [DOI] [PubMed] [Google Scholar]
- 9. Tanaka K, Aritake K, Tayama M, et al. Novel inhibitor of hematopoietic prostaglandin D synthase improves the muscle disorder in an experimental model of Duchenne muscular dystrophy. Neuromuscul Disord 2014;24:821 [Abstract G.P.88]. [Google Scholar]
- 10. Ho ATV, Palla AR, Blake MR, et al. Prostaglandin E2 is essential for efficacious skeletal muscle stem‐cell function, augmenting regeneration and strength. Proc Natl Acad Sci USA 2017;114:6675–6684. [DOI] [PMC free article] [PubMed] [Google Scholar]
- 11. Bushby K, Finkel R, Birnkrant DJ, et al. Diagnosis and management of Duchenne muscular dystrophy, part 1: diagnosis, and pharmacological and psychosocial management. Lancet Neurol 2010;9:77–93. [DOI] [PubMed] [Google Scholar]
- 12. Takeshita E, Komaki H, Tachimori H, et al. Urinary prostaglandin metabolites as Duchenne muscular dystrophy progression markers. Brain Dev 2018;Pii: S0387‐7604: 30310–30313. [DOI] [PubMed] [Google Scholar]
- 13. Masferrer JL, Seibert K, Zweifel B, Needleman P. Endogenous glucocorticoids regulate an inducible cyclooxygenase enzyme. Proc Natl Acad Sci USA 1992;89:3917–3921. [DOI] [PMC free article] [PubMed] [Google Scholar]
- 14. Moxley RT III, Pandya S, Ciafaloni E, et al. Change in natural history of Duchenne muscular dystrophy with long‐term corticosteroid treatment: implications for management. J Child Neurol 2010;25:1116–1129. [DOI] [PubMed] [Google Scholar]
- 15. Griggs RC, Forbes G, Moxley RT, Herr BE. The assessment of muscle mass in progressive neuromuscular disease. Neurology 1983;33:158–165. [DOI] [PubMed] [Google Scholar]
Associated Data
This section collects any data citations, data availability statements, or supplementary materials included in this article.
Supplementary Materials
Figure S1. Study design. aReplacement of patients occurred (during the repeated dose period enrollment) only if any patient failed to proceed to the repeated dose period or met the discontinuation criteria after single‐dose administration of the investigational product; the newly enrolled patients received repeated doses only.
Data S1. Methods.
Data S2. Results.


