Abstract
Objective
To assess the effects of dietary vitamin D3 on proinflammatory (interleukin-17A [IL-17A] and IL-6) and anti-inflammatory (IL-10) cytokines.
Methods
Our study was conducted on 75 participants who were divided into 3 groups: multiple sclerosis participants (MSPs, n = 25), first-degree relative participants (FDRPs, n = 25), and healthy participants (HPs, n = 25). All groups received 50,000 IU vitamin D3/wk for 8 weeks. Serum 25-(OH) vitamin D3 levels and messenger RNA (mRNA) expression levels of ILs were determined using electrochemiluminescence assay and real-time PCR, respectively.
Results
Vitamin D3 affected the levels of IL-17A, IL-10, and IL-6 among the 3 groups (p < 0.001 for all). Levels of IL-17A (MSPs: fold change [FC] = 5.9, p = 0.014; FDRPs: FC = 5.2, p = 0.006; HPs: FC = 4.2, p = 0.012) and IL-6 (MSPs: FC = 5.6, p = 0.003; FDRPs: FC = 5.5, p = 0.002; HPs: FC = 5.1, p < 0.001) were downregulated after vitamin D3 treatment. In addition, levels of IL-10 (MSPs: FC = 6.2, p = 0.005; FDRPs: FC = 4.6, p < 0.001; HPs: FC = 5.2, p < 0.001) were upregulated after 8 weeks.
Conclusions
Although supplementation with vitamin D3 reduced the mRNA expression levels of IL-17A and IL-6, it increased the mRNA expression level of IL-10 in all groups. However, these effects were more considerable in the MSP group than in the other groups. Of interest, in a deficiency state of serum vitamin D3, IL-17A expression had a positive feedback effect on the expression of IL-6. Conversely, in the sufficient state, IL-10 expression had a negative feedback effect on the expression of IL-17A and IL-6.
There are 2 theories that attempt to elucidate the process of inflammation in patients with multiple sclerosis (MS). First, it is proposed that the disease may rely on the dysregulation of anti-inflammatory cytokines, such as interleukin-10 (IL-10) and interleukin-4 (IL-4), as well as proinflammatory cytokines such as tumor necrosis factor-α (TNFα), interleukin-2 (IL-2), interferon-γ (IFN-γ), and interleukin-1β (IL-1β). These pro- and anti-inflammatory cytokines are produced by T-helper 1 (Th-1) and Th-2 cells, respectively.1 Proinflammatory cytokines augment the permeability of the blood-brain barrier (BBB), allowing for the demyelization and neurodegeneration of the CNS, whereas anti-inflammatory cytokines quell the production of proinflammatory cytokines.2,3 Second, besides the incomplete notion of Th-1/Th-2 disruption, other studies have proposed that Th-17 cells and IL-17 family members, such as IL-17A and IL-17F, are involved in the disease process. Specially, IL-17A plays a significant role in the stimulation and secretion of proinflammatory cytokines and in chronic CNS inflammation.4,5
The development of MS may begin in individuals who are genetically susceptible.6 Some studies have revealed that first-degree relatives of patients with MS are a 10–256 or 20–407 times more likely to develop MS than the general population.
Hence, in the present study, we have proposed a schematic model for the fluctuation of pro- and anti-inflammatory cytokines by vitamin D3, referred to as the See-Saw model (figure e-1, links.lww.com/NXG/A115). In fact, we assessed the response of these interleukins to supplementation with vitamin D3, as well as the stabilization and balance of this scheme in all 3 groups. Ultimately, our major aim was to find an appropriate way to ameliorate the intensity of MS in afflicted patients and perhaps prevent the disease in 2 other groups via nutrigenomics, especially in first-degree relatives.
Methods
Standard protocol approvals, registrations, and patient consents
This study was approved by the Ethical Committee of Tabriz University of Medical Sciences, Iran (ethical code: IR.TBZMED.REC.1395.780) and Iranian Registry of Clinical Trials (IRCT201703033655N3). Informed consent forms were obtained from all participants, and they could withdraw from the study by their own decision.
Study design and intervention
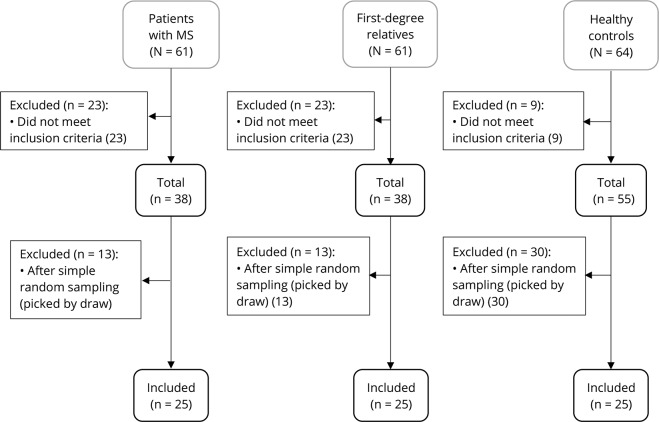
The study started on February 19, 2017, and ended on June 10, 2017. All randomized participants completed the trial. Twenty-five participants were randomized to each group through simple random sampling. Allocation to each group was through lottery, and random paper was concealed in draw balls (figure 1), including multiple sclerosis participants (MSPs) as the first group (n = 25), first-degree relative participants (FDRPs) of patients with MS, such as son, daughter, sister, or brother as the second group (n = 25), and healthy participants (HPs) as the third group (n = 25). All groups received 50,000 IU of vitamin D3 orally (Zahravi Pharmaceutical Co, Tabriz, Iran) every Friday and between lunch meals for 8 weeks. Serum 25-(OH) vitamin D3 and mRNA expression levels of interleukins were measured before and after supplementation in all groups.
Figure 1. Enrollment and selection of participants allocated to groups by simple random sampling.
Participants and eligibility criteria
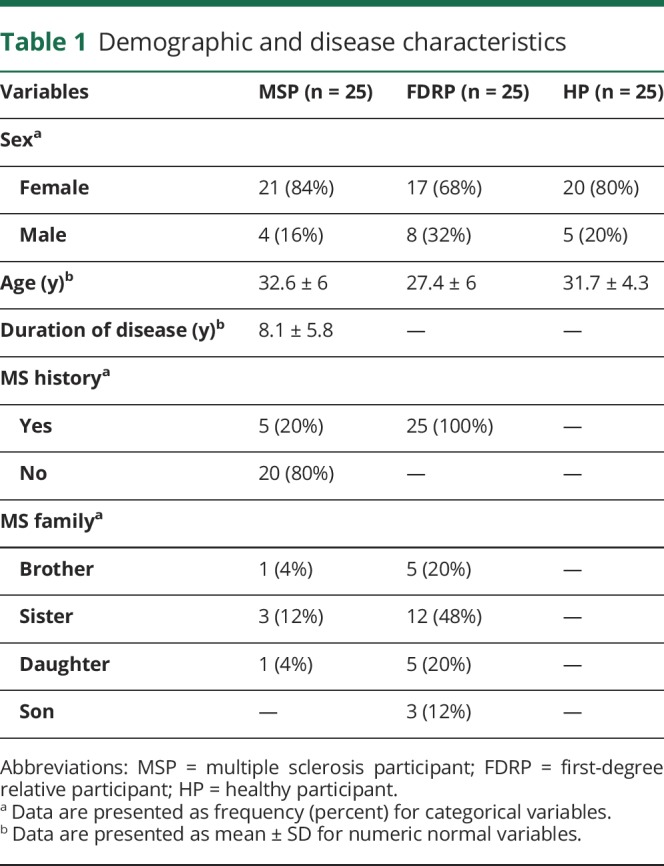
The sample size was estimated based on a previous study in Iran,8 with an odds ratio (OR) of 6, confidence level of 95%, and power of 80%. It was predicted that 25 persons in each group would be sufficient for the detection of changes in serum parameters and gene expression, using G-power. MSPs and FDRPs were selected from the Ardabil MS society. MSPs were diagnosed by a neurologist, according to the McDonald criteria. HPs were chosen from Ardabil University of Medical Sciences. To be included in the study, HPs were at the age of 30 ± 10 years, able to give blood samples, and willing to take part in the study. Malabsorption, taking medicines that interact with vitamin D3, calcium, and vitamin D3 supplementation in the last 30 days, gestation, and lactation were considered exclusion criteria. Demographic and disease characteristics are shown in table 1.
Table 1.
Demographic and disease characteristics
Serum 25-(OH) vitamin D3 assay
Whole-blood samples (10 mL) were obtained from the participants before and after the trial. To separate the sera, 5 mL of the blood samples was centrifuged at 1,233g for 10 minutes at 4°C. Serum levels of 25-(OH) vitamin D3 were measured using electrochemiluminescence assay.
RNA extraction and cDNA synthesis
Five milliliters of blood samples was collected in anticoagulant EDTA tubes. Total RNA was extracted using the MN kit (MACHEREY-NAGEL, Germany), according to the manufacturer's instructions. Concentration, integration, and purity of RNA samples were determined by spectrometry, Nano-Drop (Thermo Scientific, Waltham, MA), and gel electrophoresis. Five micrograms of total RNA was used for cDNA synthesis with a random hexamer primer through HyperScript Reverse Transcriptase (GeneAll, South Korea) in 20 μL total reaction mixture.
Real-time PCR analysis
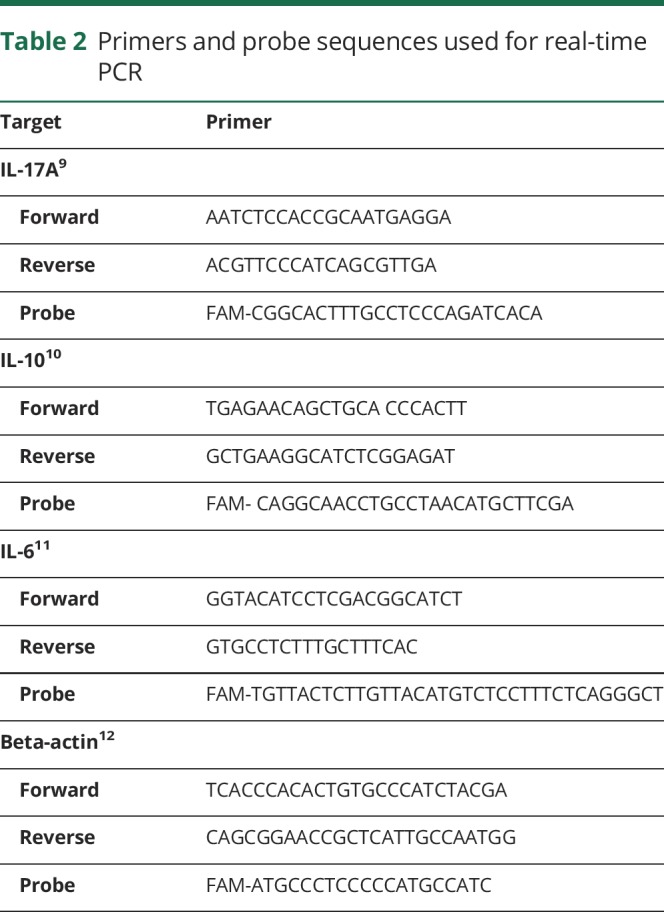
Real-time PCR was performed on a Roche Light cycler 96 (version: 1.1.0.1320, Germany), using primers specific for IL-6, IL-10, and IL-17A, with β-actin as a housekeeping control. Primer and probe sequences are presented in table 2.9–12 Real-time PCR reactions were performed in a total volume of 25 μL containing 4 μL of synthesized cDNA solution, 12.5 μL of RealQ Plus 2x Master Mix for probe (Ampliqon, Denmark), 500 nM of each forward and reverse primers, and 250 nM of the TaqMan probe. The amplification program included a prewarming step (10 minutes at 94°C), denaturation step (94°C for 15 seconds), and an annealing/extension step (60°C for 60 seconds).
Table 2.
Primers and probe sequences used for real-time PCR
Outcome measures
The primary outcome of the study was to identify any changes in the serum levels of 25-(OH) vitamin D3 or in the levels of IL-17A, IL-10, and IL-6 mRNA expression in all 3 groups after 8 weeks.
Adverse events
Participants were continuously monitored for any side effects of vitamin D3 consumption from baseline of the study. However, no particular events were found.
Statistical analysis
Statistical analysis was performed using SPSS version 23.0 software (SPSS Inc, Chicago, IL). Data are presented using mean ± SD for numeric normal variables and frequency (percent) for categorical variables. The one-way analysis of variance (ANOVA), followed by the post hoc Tukey test, was used for group comparisons. The Paired t test was applied for within-group comparisons. Relative mRNA expression normalized to β-actin was calculated by the ΔΔCT method,13 and the fold change (FC) expression of each gene was calculated by the ratio formula (ratio = 2−ΔΔCT). In all analysis, p < 0.05 were considered statistically significant.
Data availability
The datasets applied and analyzed during the current study are available from the corresponding and first authors on reasonable request from any qualified investigator.
Results
The flow diagram of the study is shown in figure e-2 (links.lww.com/NXG/A116). Of 186 participants, 75 participants (25 per each group) were eligible to be assigned to the study intervention (figure 1).
Association between vitamin D3 treatment and mRNA expression levels of IL-6, IL-17A, and IL-10
Between-group comparisons
Before supplementation
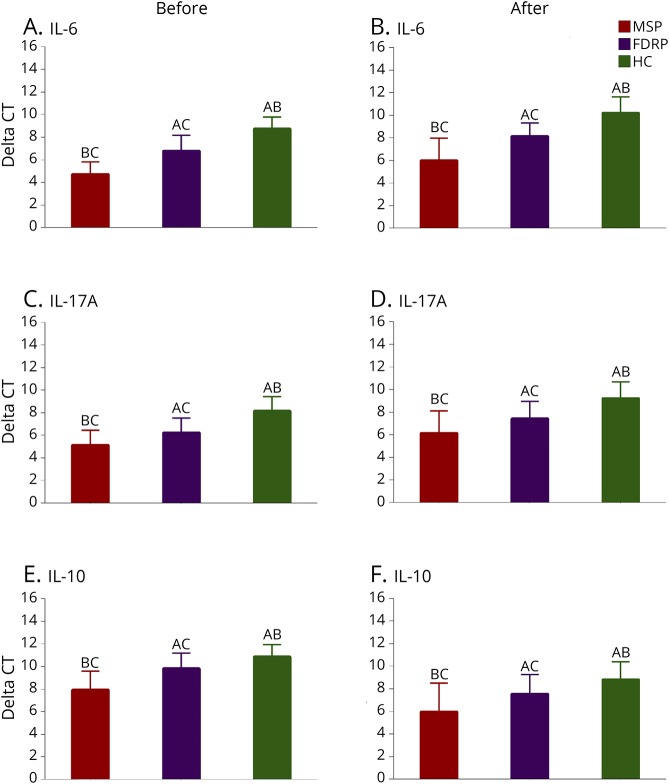
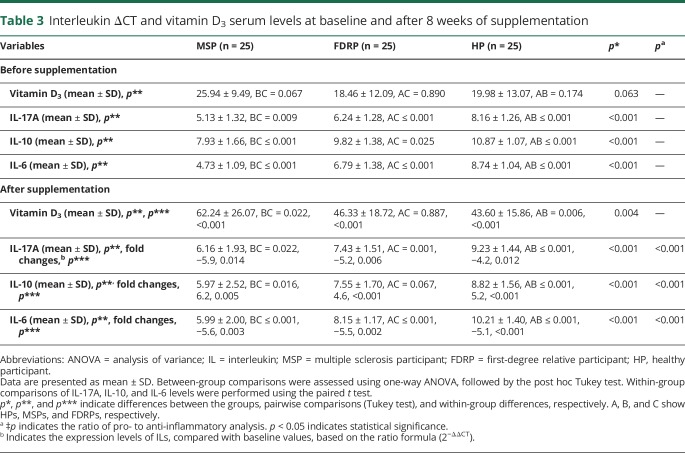
At baseline, the results of one-way ANOVA showed that there were differences in the mRNA expression levels of IL-6, IL-17A, and IL-10 (p < 0.001 for all) among the groups, but levels of serum vitamin D3 (p = 0.063) were almost the same in all groups. The results of the pairwise comparison using the Tukey test also revealed differences between each 2 groups in IL-6 (MSPs and FDRPs: p < 0.001, FDRPs and HPs: p < 0.001, MSPs and HPs: p < 0.001), IL-17A (MSPs and FDRPs: p = 0.009, FDRPs and HPs: p = 0.025, MSPs and HPs: p < 0.001), and IL-10 (MSPs and FDRPs: p < 0.001, FDRPs and HPs: p < 0.001, MSPs and HPs: p < 0.001) (figures 2, A, C, and E and table 3).
Figure 2. Between-group comparisons.
Effects of vitamin D3 supplementation on serum levels of proinflammatory and anti-inflammatory markers (n = 25 per group). (A–F) IL-6, IL-17A, and IL-10 mRNA expression levels of healthy controls (HCs), multiple sclerosis participants (MSPs), and first-degree relative participants (FDRPs). HPs (A), MSPs (B), and FDRPs (C). One-way analysis of variance, followed by the post hoc Tukey test, was used. Data were expressed as mean ± SD, and p < 0.05 was regarded as statistically significant.
Table 3.
Interleukin ΔCT and vitamin D3 serum levels at baseline and after 8 weeks of supplementation
After supplementation
After 8 weeks of supplementation with vitamin D3, there were differences among groups in mRNA expression levels of IL-6 (p < 0.001), IL-17A (p < 0.001), and IL-10 (p < 0.001), as well as in the levels of serum vitamin D3 (p = 0.004). Pairwise comparisons indicated that there were differences between each 2 groups in IL-6 (MSPs and FDRPs: p < 0.001, FDRPs and HPs: p < 0.001, MSPs and HPs: p < 0.001), IL-17A (MSPs and FDRPs: p = 0.022, FDRPs and HPs: p = 0.001, MSPs and HPs: p < 0.001), IL-10 (MSPs and FDRPs: p = 0.005, FDRPs and HPs: p < 0.001, MSPs and HPs: p < 0.001), and serum vitamin D3 (MSPs and FDRPs: p = 0.022, FDRPs and HPs: p = 0.887, MSPs and HPs: p = 0.006). However, no significant differences were found in the levels of serum vitamin D3 between the FDRP and HP groups (figures 2, B, D, and F and table 3).
Within-group comparisons (before–after)
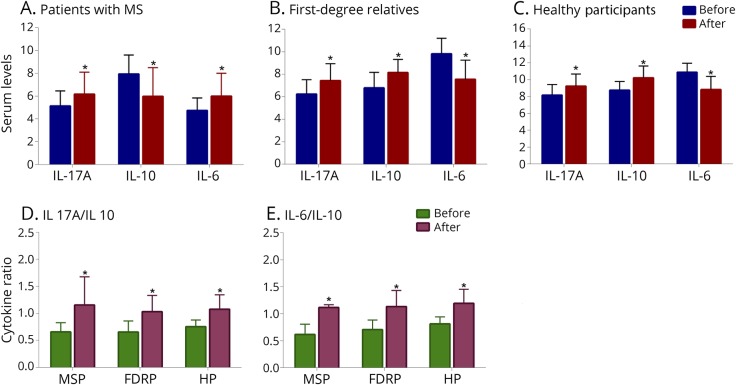
The results of the paired t test analyses revealed that the production of proinflammatory cytokines (i.e., IL-17A and IL-6) decreased, whereas secretion of the anti-inflammatory cytokine, IL-10, increased in each group after intervention. The observed FCs in MSPs were −5.9 for IL-17A, (p = 0.014), −5.6 for IL-6 (p = 0.003), and 6.2 for IL-10 (p = 0.005). The FCs in FDRPs were −5.2 for IL-17A (p = 0.006), −5.5 for IL-6 (p = 0.002), and 4.6 for IL-10 (p < 0.001). In HPs, the FCs were −4.2 for IL-17A (p = 0.012), −5.1 for IL-6 (p < 0.001), and 5.2 for IL-10 (p < 0.001) (figures 3, A–C and table 3). In addition, the ratio of pro- to anti-inflammatory cytokines, including the ratio of IL-17A to IL-10 and IL-6 to IL-10, in each group showed that there were differences within the groups (MSPs, p < 0.001; FDRPs, p < 0.001; HPs, p < 0.001, figure 3, D and E).
Figure 3. Within-group comparisons (before–after).
Effects of vitamin D3 on serum levels of proinflammatory and anti-inflammatory markers (n = 25 per group) (A–C) and the ratio of pro-to anti-inflammatory cytokines (D and E). IL-6, IL-17A, and IL-10 mRNA expression levels of healthy participants, patients with MS, and first-degree relatives. Paired t test analysis was used. Data were expressed as mean ± SD. *p < 0.05 was regarded as statistically significant.
Discussion
With respect to the role of vitamin D3 in the immune system and gene expression, we proposed a schematic balance for fluctuations of pro- (IL-17A and IL-6) and anti-inflammatory (IL-10) cytokines by vitamin D3 that we refer to as the See-Saw model.
In the present trial, 88% of MSPs, 84% of FDRPs, and 80% of HPs showed a positive response after 8 weeks supplementation with 50,000 IU vitamin D3. There were no differences in serum vitamin D3 levels among the groups at baseline. This finding is similar to the results of other studies.14,15 However, our finding does not conform with that of other studies, which indicated that serum levels of vitamin D3 in MSPs were lower than those in HPs.16,17 This contradiction may be justified by several reasons, including economic conditions, clothing, inappropriate food habits, and above all, weather conditions and geographical location (the mountainous weather of Northwest of Iran with higher latitude and lower temperature). These may all cause lower exposure to sunlight and consequent insufficiency of serum vitamin D3. Several studies indicate that vitamin D3 deficiency is a common phenomenon among patients with MS with neuroinflammatory lesions.18 In addition, numerous studies have demonstrated the effects of 1, 25-(OH)2 vitamin D3 on antigen-presenting cell (APC) function and T-cell responses. Vitamin D3 directly increases the expression level of vitamin D receptor (VDR), especially after bioactivation on T cells.19 Duan et al.20 reported that VDR is the active form of vitamin D receptor and is widely expressed in the brain. Evidence suggests that VDRs and vitamin D are key molecules for the development of the nervous system, and they can reduce anxiety and increase the production of neurotrophic factors.
1,25-(OH)2 vitamin D3 can take part in the activation or repression of gene transcription and expression through direct interaction with VDR/retinoid X receptor (RXR). By this mechanism, 1,25-(OH)2 vitamin D3 is able to bind directly to specific DNA sequences called vitamin D response elements (VDREs) in target genes.21
Our findings indicate that administration of vitamin D3 decreased the mRNA expression levels of IL-17A and IL-6 and increased the mRNA expression level of IL-10 in all 3 groups. Of 25 participations in each group, we observed downregulation of IL-17A in 76% of MSPs, 80% of FDRPs, and 80% of HPs; we also observed that downregulation of IL-6 in 80% of MSPs, 80% of FDRPs, and 84% of HPs occurred after 8-week treatment with 50,000 IU vitamin D3. In addition, 80% of MSPs, 88% of FDRPs, and 84% of HPs showed upregulation of IL-10.
IL-17A is produced by Th17 cells, which have a major function in the progression of immune system disorders including MS.22 Luchtman et al. demonstrated an increase in the secretion of IL-17 in the periphery and in the CNS of patients with MS. IL-17 can lead to increased CCL2, IL-6, and IL-8 secretion. In addition, IL-17 production also results in the formation of reactive oxygen species.23 Upregulation of IL-6 occurs during neuroinflammation of the CNS and leads to neuronal damage, especially in axons.24 Furthermore, the presence of transforming growth factor-β (TGF-β) and IL-6 stimulates T-cell differentiation into Th-17 cells, which subsequently increases the level of IL-17A secretion.8,24 IL-6 plays a key role in MS development in 2 ways: by increasing IL-17 and IL-22 secretion and through the upregulation of CCR6 expression on activated myelin-specific T cells. Therefore, it seems that IL-17A and IL-6 act as agonists through these pathways.25,26 Da Costa et al.27 reported that IL-6 and IL-17A levels directly correlated with neurologic disabilities in patients with MS. Moreover, 1,25-(OH)2 vitamin D3 decreases the secretion of proinflammatory cytokines in vitro. Naghavi Gargari et al.8 indicated a positive association between the mRNA expression of IL-6 and IL-17A. Supplementation of 1,25-(OH)2 vitamin D3 inhibits IL-17A production in T cells of patients with MS.28 In fact, vitamin D3 administration can ameliorate MS disease through to downregulation of IL-17A and IL-6. On the other hand, a pivotal role of anti-inflammatory cytokines, especially IL-10, stimulated by vitamin D3, has been established in the suppression of T-cell activation through macrophages. Therefore, the arrest of IL-10 production may exacerbate inflammation.29,30 Thereby, vitamin D3 supplementation can increase IL-10 by T cells and reduce the production of IL-6 and IL-17 in both patient and control groups.31
Nevertheless, in several studies, contradictory results have also been reported. For instance, Fujita et al. and Niino et al. have both shown that 1,25-(OH)2 vitamin D3 can downregulate the production of IL-10.32,33. In addition, studies by Naghavi Gargari et al. and Smolders et al. have demonstrated the upregulation of IL-6 and IL-17A by vitamin D.8,34 Meanwhile, Yao et al.35 have shown that IL-6 has anti- and pro-inflammatory effects and that it can be secreted from various cell types, including lymphocytes, macrophages, and monocytes. Multiple factors, including the variety of cell types studied, duration and dosage of 1,25(OH)2 vitamin D3 treatment, type of samples, genetic inheritance of patients, and polymorphisms in VDR genes, have all been proposed to account for these contradictory findings as reported in several studies.8,14,29,36
In this study, we also compared the ratio of pro- to anti-inflammatory cytokines (IL-17A:IL-10 and IL-6:IL-10). In all groups, both ratios were improved, but the most significant changes occurred in MSPs. In addition, the changes in the ratio of IL-6:IL-10 were found to be more important than the changes in the ratio of IL-17A:IL-10. Therefore, these results may confirm 2 points: First, vitamin D3 reduces the gene expression levels of IL-6 and IL-17A. The expression level of IL-6 decreases subsequent to the reduction in IL-17A expression, which is why the ratio of in IL-6:IL10 was more tangible. Second, increased expression of IL-10 had a negative feedback effect on the expression levels of IL-17A and IL-6.
To prove the accuracy of the proposed schematic (See-Saw model), the sample size should be increased in each group. In addition, a blank control group (out of the restricted criteria) should be more defined. In this state, a placebo would be administered to determine the actual effects of vitamin D3 on the expression levels of genes. Overall, the results suggest that long-term supplementation with a lower daily dosage may be beneficial. Furthermore, participants should be assessed at the midpoint of the study to determine the temporal effect of vitamin D3 supplementation. A reliable questionnaire should also be devised and used for the effect of vitamin D3 supplements on the behavioral and mental performance of the participants before and after the intervention. The present study and many other similar ones only examined the mRNA expression levels of these cytokines; however, an analysis of cytokine protein expression would be useful to confirm the effect of vitamin D3. In addition, epigenetic studies may be useful to address some of the contradictions presented by other studies. Epigenetics refers to the modification of gene expression and changes in chromatin structure without alteration of the DNA sequence.37 Recent studies suggest that interactions between environmental factors and epigenetic parameters are an underlying cause of MS.
Finally, we determined that upregulation of IL-10 and downregulation of IL-17A and IL-6 occur at sufficient serum levels of vitamin D3. These features were more noticeable in MSPs. As mentioned earlier, IL-17A and IL-6 augment the production of each other. Sufficient serum levels of vitamin D3 result in the production of IL-10 and have a negative feedback effect on the expression levels of IL-17A and IL-6. Stabilization and proper balance of the schematic See-Saw model by sufficient levels of vitamin D3 seem to offer a feasible method for protection from MS by dietary modifications.
Acknowledgment
The authors specially thank patients with MS for their participation in the study and the Nutrition Research Center of Tabriz University of Medical Sciences, Tabriz, Iran, and Ardabil University of Medical Sciences and Imam Khomeini Hospital (Genetic Laboratory) and MS Society, Ardabil, Iran, for their financial support.
Glossary
- APC
antigen-presenting cell
- BBB
blood-brain barrier
- FC
fold change
- FDRP
first-degree relative participant
- HP
healthy participant
- IFN-γ
interferon-γ
- IL
interleukin
- MS
multiple sclerosis
- MSP
multiple sclerosis participant
- TGF-β
transforming growth factor-β
- Th
T helper
- VDR
vitamin D receptor
- VDRE
vitamin D response element
Author contributions
S. Rafie-Arefhosseini and R. Hashemi proposed the See-Saw schematic model and wrote the study protocol and design. Davar Altafi, a neurologist, diagnosed patients with multiple sclerosis (MS). Reza Hashemi performed RNA extraction, cDNA synthesis, and real-time PCR under the supervision of Seyed Saeed Hosseini-Asl and also performed analysis and interpretation of the results. Reza Hashemi and Mohammad Morshedi performed statistical analysis and interpretation under the supervision of Mohammad Asghari-Jafarabadi. Mohammad Morshedi drew figures using Graph Prism software. Seyed Rafie-Arefhosseini, Reza Hashemi, and Mohammad Morshedi involved in drafting the manuscript and revising it critically for content. All authors have given their final approval of the version to be published.
Study funding
This study was financially supported by the Nutrition Research Center, Tabriz University of Medical Sciences, Tabriz, Iran, and Ardabil University of Medical Sciences, Ardabil, Iran. The results of this article were extracted from the MSc. Thesis of Reza Hashemi (Grant no.: 5/D/960060) was registered at Tabriz University of Medical Sciences, Tabriz, Iran.
Disclosure
R. Hashemi, M. Morshedi, M. Asghari Jafarabadi, and D. Altafi report no disclosures. S. Hosseini-Asl has received research support from Ardabil University of Medical Sciences. S. Rafie-Arefhosseini is an employee of and has received research support from Tabriz University of Medical Sciences. Full disclosure form information provided by the authors is available with the full text of this article at Neurology.org/NG.
References
- 1.Kjølhede T, Dalgas U, Gade AB, et al. . Acute and chronic cytokine responses to resistance exercise and training in people with multiple sclerosis. Scand J Med Sci Sports 2016;26:824–834. [DOI] [PubMed] [Google Scholar]
- 2.Martins TB, Rose JW, Jaskowski TD, et al. . Analysis of proinflammatory and anti-inflammatory cytokine serum concentrations in patients with multiple sclerosis by using a multiplexed immunoassay. Am J Clin Pathol 2011;136:696–704. [DOI] [PubMed] [Google Scholar]
- 3.Siffrin V, Vogt J, Radbruch H, Nitsch R, Zipp F. Multiple sclerosis – candidate mechanisms underlying CNS atrophy. Trends Neurosci 2010;33:202–210. [DOI] [PubMed] [Google Scholar]
- 4.Kebir H, Kreymborg K, Ifergan I, et al. . Human TH17 lymphocytes promote blood-brain barrier disruption and central nervous system inflammation. 2007;13:1173–1175. [DOI] [PMC free article] [PubMed] [Google Scholar]
- 5.Camperio C, Muscolini M, Volpe E, et al. . CD28 ligation in the absence of TCR stimulation up-regulates IL-17A and proinflammatory cytokines in relapsing-remitting multiple sclerosis T lymphocytes. Immunol Lett 2014;158:134–142. [DOI] [PubMed] [Google Scholar]
- 6.Ramagopalan SV, Dobson R, Meier UC, Giovannoni G. Multiple sclerosis: risk factors, prodromes, and potential causal pathways. Lancet Neurol 2010;9:727–739. [DOI] [PubMed] [Google Scholar]
- 7.Xia Z, White CC, Owen EK, et al. . Genes and environment in multiple sclerosis project: a platform to investigate multiple sclerosis risk. Ann Neurol 2016;79:178–189. [DOI] [PMC free article] [PubMed] [Google Scholar]
- 8.Naghavi Gargari B, Behmanesh M, Shirvani Farsani Z, Pahlevan Kakhki M, Azimi AR. Vitamin D supplementation up-regulates IL-6 and IL-17A gene expression in multiple sclerosis patients. Int Immunopharmacol 2015;28:414–419. [DOI] [PubMed] [Google Scholar]
- 9.Furusawa H, Suzuki Y, Miyazaki Y, Inasea N, Eishib Y. Th1andTh17immuneresponsestoviable Propionibacteriumacnes in patientswithsarcoidosis. Respir Invest 2012;50:104–109. [DOI] [PubMed] [Google Scholar]
- 10.Wang Z, Zheng Y, Hou C, et al. . DNA methylation impairs TLR9 induced Foxp3 expression by attenuating IRF-7 binding activity in fulminant type 1 diabetes. Autoimmunity 2013;41:50–59. [DOI] [PubMed] [Google Scholar]
- 11.Liang H, Hussey SE, Sanchez-Avila A, Tantiwong P, Musi N. Effect of lipopolysaccharide on inflammation and insulin action in human muscle. PLoS One 2013;8:e63983. [DOI] [PMC free article] [PubMed] [Google Scholar]
- 12.Seung-Hun S, Jae-Kwan L, Oye-Sun S, Ho-Suk S. The relationship etween cytokines and HPV-16, HPV-16E6, E7 and high-risk HPV viral load in the uterin cervix. Gynecol Oncol 2007;104:732–738. [DOI] [PubMed] [Google Scholar]
- 13.Yuan JS, Reed A, Chen F, Stewart CN. Statistical analysis of real-time PCR data. BMC Bioinformatic 2006;7:85. [DOI] [PMC free article] [PubMed] [Google Scholar]
- 14.Eskandari G, Ghajarzadeh M, Yekaninejad MS, et al. . Comparison of serum vitamin D level in multiple sclerosis patients, their siblings, and healthy controls. Iran J Neurol 2015;14:81. [PMC free article] [PubMed] [Google Scholar]
- 15.Yildiz M, Tettenborn B, Putzki N. Vitamin D levels in Swiss multiple sclerosis patients. Swiss Med Wkly 2011;141:w13192. [DOI] [PubMed] [Google Scholar]
- 16.Nikanfar M, Taheri-Aghdam AA, Yazdani M, et al. . Serum 25(OH) vitamin D levels is not associated with disability in multiple sclerosis patients: a case-control study. Iran J Neurol 2015;14:17–21. [PMC free article] [PubMed] [Google Scholar]
- 17.Runia TF, Hop WC, de Rijke YB, Buljevac D, Hintzen RQ. Lower serum vitamin D levels are associated with a higher relapse risk in multiple sclerosis. Neurology 2012;79:261–266. [DOI] [PubMed] [Google Scholar]
- 18.Delvin E, Souberbielle JC, Viard JP, Salle B. Role of vitamin D in acquired immune and autoimmune diseases. Crit Rev Clin Lab Sci 2014;51:232–247. [DOI] [PubMed] [Google Scholar]
- 19.Peelen E, Knippenberg S, Muris AH, et al. . Effects of vitamin D on the peripheral adaptive immune system: a review. Autoimmun Rev 2011;10:733–743. [DOI] [PubMed] [Google Scholar]
- 20.Duan Sh, Lv ZH, Fan X, et al. . Vitamin D status and the risk of multiple sclerosis: a systematicreview and meta-analysis. Neurosci Lett 2014;570:108–113. [DOI] [PubMed] [Google Scholar]
- 21.Christakos S, Dhawan P, Verstuyf A, Verlinden L, Carmeliet G. Vitamin D: metabolism, molecular mechanism of action, and pleiotropic effects. Am Physiol Soc 2016;96:365–408. [DOI] [PMC free article] [PubMed] [Google Scholar]
- 22.Bolaños-Jiménez R, Arizmendi-Vargas J, Carrillo-Ruiz J, et al. . Multiple sclerosis: an overview of the disease and current concepts of its pathophysiology. J Neurosci Behav Health 2010;3:44–50. [Google Scholar]
- 23.Luchtman WD, Ellwardt E, Larochelle C, Zipp F. IL-17 and related cytokines involved in the pathology and immunotherapy of multiple sclerosis. Curr Future Dev 2014;25:403–413. [DOI] [PubMed] [Google Scholar]
- 24.Erta M, Quintana A, Hidalgo J. Interleukin-6, a major cytokine in the central nervous system. Int J Biol Sci 2012;8:1254. [DOI] [PMC free article] [PubMed] [Google Scholar]
- 25.Kebir H, Ifergan I, Alvarez JI, et al. . Preferential recruitment of interferon-gamma-expressing TH17 cells in multiple sclerosis. Ann Neurol 2009;66:390–402. [DOI] [PubMed] [Google Scholar]
- 26.Ferreira TB, Hygino J, Barros PO, et al. . Endogenous interleukin-6 amplifies interleukin-17 production and corticoid-resistance in peripheral T cells from patients with multiple sclerosis. Immunology 2014;143:560–568. [DOI] [PMC free article] [PubMed] [Google Scholar]
- 27.da Costa DS, Hygino J, Ferreira B, et al. . Vitamin D modulates different IL-17-secreting T cell subsets in multiple sclerosis patients. J Neuroimmunol 2016;299:8–18. [DOI] [PubMed] [Google Scholar]
- 28.Joshi S, Pantalena LC, Liu XK, et al. . 1,25-dihydroxyvitamin D(3) ameliorates Th17 autoimmunity via transcriptional modulation of interleukin-17A. Mol Cel Biol 2011;31:3653–3669. [DOI] [PMC free article] [PubMed] [Google Scholar]
- 29.Korf H, Wenes M, Stijlemans B, et al. . 1,25-Dihydroxyvitamin D3 curtails the inflammatory and T cell stimulatory capacity of macrophages through an IL-10-dependent mechanism. Immunobiology 2012;217:1292–1300. [DOI] [PubMed] [Google Scholar]
- 30.Farsani ZS, Behmanesh M, Sahraian MA. Interleukin-10 but not transforming growth factor-â1 gene expression is up-regulated by vitamin D treatment in multiple sclerosis patients. J Neurol Sci 2015;350:18–23. [DOI] [PubMed] [Google Scholar]
- 31.Correale J, Ysrraelit MC, Gaitan MI. Immunomodulatory effects of vitamin D in multiple sclerosis. Brain 2009;132:1146–1160. [DOI] [PubMed] [Google Scholar]
- 32.Fujita H, Asahina A, Komine M, Tamaki K. The direct action of 1α,25(OH)2- vitamin D3 on purified mouse Langerhans cells. Cell Immunol 2007;245:70–79. [DOI] [PubMed] [Google Scholar]
- 33.Niino M, Fukazawa T, Miyazaki Y, et al. . Suppression of IL-10 production by calcitriol in patients with multiple sclerosis. J Neuroimmunol 2014;270:86–94. [DOI] [PubMed] [Google Scholar]
- 34.Smolders J, Hupperts R, Barkhof F, et al. . Efficacy of vitamin D3 as add-on therapy in patients with relapsing-remitting multiple sclerosis receiving subcutaneous interferon beta-1a: a phase II, multicenter, double-blind, randomized, placebo-controlled trial. J Neurol Sci 2011;311:44–49. [DOI] [PubMed] [Google Scholar]
- 35.Yao X, Huang J, Zhong H, et al. . Targeting interleukin-6 in inflammatory autoimmune diseases and cancers. Pharmacol Ther 2014;141:125–139. [DOI] [PubMed] [Google Scholar]
- 36.Matilainen JM, Husso T, Toropainen S, et al. . Primary effect of 1α,25(OH) 2D3 on IL-10 expression in monocytes is short-term down-regulation. Biochim Biophys Acta 2010;1803:1276–1286. [DOI] [PubMed] [Google Scholar]
- 37.Wise IA, Charchar FJ. Epigenetic modifications in essential hypertension. Int J Mol Sci 2016;17:451–465. [DOI] [PMC free article] [PubMed] [Google Scholar]
Associated Data
This section collects any data citations, data availability statements, or supplementary materials included in this article.
Data Availability Statement
The datasets applied and analyzed during the current study are available from the corresponding and first authors on reasonable request from any qualified investigator.


