 Bisphenol A (BPA) is an endocrine disruptor of xenobiotic type, mainly used for the production of polycarbonate plastic, epoxy resins and non-polymer additives.
Abstract
Bisphenol A (BPA) is an endocrine disruptor of xenobiotic type, mainly used for the production of polycarbonate plastic, epoxy resins and non-polymer additives. Because of its wide usages in the environment, the toxic effects of BPA have proved to be harmful to human health. However, its effects on human haemoglobin remain unclear. The affinity between BPA and haemoglobin, as well as erythrocytes, is an important factor in understanding the mechanism of the toxicity of BPA. Flavonoids are strong antioxidants that prevent oxidative stress and Quercetin is a flavonoid found in numerous vegetables and fruits. Therefore, the present investigation was undertaken to investigate whether Quercetin can be used to alleviate the toxic effects of BPA in vitro in human red blood cells (RBC). Venous blood samples were collected from healthy, well-nourished adult volunteers (25–30 years old) by phlebotomy. In a RBC suspension with a cell density of 2 × 10⁴ cell per mL, the concentration of BPA (25–150 µg mL–1) was found to cause an increase in the lipid peroxidation (LPO) and a decrease in the activities of superoxide dismutase (SOD), catalase (CAT) and glutathione peroxidase (GPX) in human RBC. However, the concurrent addition of BPA (150 µg mL–1) and quercetin (10–50 µg mL–1) lead to significant amelioration. In silico studies gave structural insight into BPA and quercetin to decipher the plausible binding mechanism and molecular level recognition.
A Introduction
Human beings have been producing and releasing environmental contaminants ever since the discovery of fire. Some of these contaminants belong to the xenobiotic group of “endocrine disruptors” (EDs). EDs are compounds that interfere with endocrine systems and disrupt their normal functions within an organism without remarkable toxicity. EDs bind or block hormone receptors, triggering or preventing hormonal response. Chemicals implicated in endocrine disruption include biocides, industrial compounds, surfactants, and plasticizers comprising bisphenol A (BPA).
BPA has become ubiquitous in the environment over the last few decades because of its presence in a multitude of products, including food and beverage packaging, flame retardants, adhesives, building materials, electronic components and paper coatings. Global consumption of BPA in 2011 was around 5.5 million metric tons and will surely escalate in the future. When first used, BPA was treated as one of the most essential chemicals in the living world, but it is now become a menace to the living world. Furthermore, BPA is universal in the environment because of its continuous release as a result of chemical manufacture, transport, and processing units.1 Post-consumer release is primarily via effluent discharge from municipal wastewater treatment plants, leaching from landfills, combustion of domestic waste, and the degradation of plastics in the environment. BPA can migrate into food from cans and from polycarbonate plastic products such as baby bottles, tableware, and food containers. The use of BPA in food and beverage containers accounts for the majority of daily human exposure; estimated human consumption of BPA from epoxy-lined food cans alone is 6.6 μg per person-day. Heating plastic, such as in a microwave, increases the leaching of BPA into liquids. The unremitting exposure of the environment and humans to BPA has however awakened the scientific community and researchers to its hazardous effects.
Male Holtzman rats have been previously exposed to various doses of BPA and the results showed that BPA caused an increase in lipid peroxidation and a decrease in the activity of various enzymatic and nonenzymatic antioxidants in the bone marrow cells, blood lymphocytes, and testicular and epididymal tissues in the rats. So, the study concluded that BPA exposure induced oxidative stress.2 Korkmaz et al.3 found that there was an increase in the thiobarbituric acid reactive substances (TBARS) level in the liver of rats exposed to BPA. Similarly, previous studies have shown an increase in the TBARS levels in the brain, testes, and kidneys of male rats exposed to BPA.3,4
Animal experimentation to investigate BPA toxicity has also revealed effects such as an increase in prostate weight and cancer, mammary gland organization and cancer, protein induction in the uterus, organization of sexually dimorphic circuits in the hypothalamus, onset of estrous cyclicity and earlier puberty, body weight, genital malformation and an increase in the percentage of malformed sperm.
Many studies have revealed the toxicity of BPA as an endocrine disruptor/xenoestrogen, with proven effects on the male and female reproductive system. For male workers, BPA exposure has been associated with a consistently higher risk of male sexual dysfunction across all areas of male sexual function.5 BPA exposure has been positively correlated with decreased semen quality and male infertility, for which induction of germ cell apoptosis is considered a primary contributing factor.6 For female workers, occupational exposure to BPA has been associated with alterations in relevant reproductive hormones, including increased prolactin, progesterone and estradiol levels.7 Alterations in hormone levels, both in male and female workers, are in agreement with the endocrine disrupting activity of BPA, as discussed above, and indicate that occupationally exposed workers have an increased risk of endocrine dysfunction associated with BPA exposure.
Quercetin is abundant in diverse plant materials (leaves, grains, fruits, and vegetables) as well as in common types of food and drink, with onions, apples, berries, broccoli, tea, and red wine being typical examples.8 In fact, quercetin functions as an antioxidant, radical scavenger, anti-inflammatory, anti-diabetic, antibacterial, antiviral, gastroprotective, immune-modulator, and is used in the treatment of obesity and cardiovascular diseases.9 It is also involved in the prevention of neurological disorders, due to its neuroprotective effects.10 It has been postulated that quercetin protects against mitochondrial damage as a result of its ability to interact with several mitochondria that affect cells and tissues. The lipophilic nature of quercetin assists it in passing through cell membranes and plays an important role in it finding various intracellular routes, concerned with chemoprevention (e.g. apoptosis, cell cycle, detoxification, antioxidant replication, cell invasion, angiogenesis).11,12
Molecular modelling is an in silico method to understand the binding mechanism and stability of receptor and ligand molecules. It includes various molecular simulation approaches, such as molecular docking and molecular dynamics simulation techniques. These are the most frequently used molecular modelling strategies due to their wide range of applications in the analysis of molecular recognition events, such as binding energetics, molecular interactions and induced conformational changes.13,14
The global manufacture and use of BPA is collectively increasing day by day, therefore the number of individuals that are exposed to this compound is, consequently, increasing every year. So, there is a crucial requirement to measure the effective exposure to BPA in the environment, which will allow the execution of suitable preventive measures. Quercetin is a potent antioxidant, which is found in a variety of fruits and vegetables, and, being an antioxidant, it can neutralise the effects of bisphenol A. There are very few studies that have focused on the oxidative stress generated by BPA under in vitro conditions. However, no data is available for the mitigatory effect of quercetin on BPA related toxicity.
So, the aim of this study is to assess the ameliorative effect of the naturally available antioxidant quercetin on BPA-induced oxidative stress under in vitro conditions by measuring the malondialdehyde (MDA) levels and activities of the enzyme superoxide dismutase (SOD), catalase (CAT) and glutathione peroxidase (GPX).
B Materials and methods
Chemicals
The chemicals used in the present study were purchased from Hi Media Laboratories Pvt. Ltd, Mumbai, India, and Sisco Research Laboratories Pvt. Ltd, Mumbai, India.
Oxidative stress in human erythrocytesdative stress in human erythrocytes
Erythrocyte suspension preparation
Intravenous blood samples were collected from healthy, well-nourished adult volunteers (25–30 years) by venipuncture. The study complied with all institutional and national guidelines as per the Indian Council of Medical Research: Ethical guidelines for Biomedical Research on human participant (2006). All voluntary participants were provided with detailed information regarding the study design and its implications. Written consent was also taken from them. The protocol was approved by the Institutional Ethical Committee, at the Zoology department, Gujarat University, Ahmedabad. Final RBC suspensions were prepared with a cell density of 2 × 10⁴ cell per mL, following the method of Verma and Raval.15
The treatment of erythrocytes
Erythrocytes suspended in normal saline were used as an untreated control. In the first set of experimental samples, erythrocytes were treated with BPA (25–150 µg mL–1). In the second set of experimental samples, erythrocytes were treated with BPA (150 µg mL–1) and quercetin (10–50 µg mL–1), respectively. All of the control and experimental samples were incubated for 4 h at 37 °C with intermittent shaking. After the incubation, all of the samples were centrifuged at 1000g for 10 min and the supernatants were isolated. The MDA levels, and SOD, CAT and GPX activities were measured using standard procedures. The lipid peroxidation assay was done using a previously reported method16 and the result was expressed as n moles of MDA formed per mg protein per 60 min. The activities of superoxide dismutase and catalase were assayed using the methods described by Kakkar et al. in 1984 and Lück et al. in 196517,18 with appropriate modification and expressed as U mg–1 protein and µM/H2O2 per mg protein, respectively. The glutathione content was measured using the method described by Grunert et al. in 1951 19 and was expressed as µg GSH per mg protein. The enzyme activities were measured in terms of the protein content.20
Statistical analysis
The results were expressed as means ± S.E.M. For each parameter, at least 10 replicates were measured. Experimental data were analysed using Student's t-test at the p < 0.001 level. Linear regression analysis was done using Graph pad Instat software version, 5.03.
Dataset preparation
The three-dimensional structure of BPA (PubChem ID: 6623 & CAS no. 80-05-7) and quercetin (PubChem ID: 5280343 & CAS no. 117-39-5) were retrieved from the Pubchem database, while the crystal structure of human GPX8 (Protein Data Bank (PDB) ID: 3cyn) and deoxy human haemoglobin (PDB ID: 2d60)21 were downloaded from the PDB database (; http://www.rcsb.org/pdb/home/home.do). The protein structures were prepared by deleting the water molecules, and adding H atoms and protonation states to chargeable amino acids and atom-typed using the Amber03 force field.22–25 To obtain the natural state of both the receptor and ligand, energy minimization was performed using the Amber03 force field of the YASARA structure view.25,26
Molecular docking
Molecular docking was performed using the YASARA software24 to procure the binding affinity of BPA and quercetin with 3cyn and 2d60 proteins individually. The active site residues were identified through a literature review and validated the docking experiment, which was undertaken to investigate the binding energy and various interactions to decipher a plausible binding mechanism. The binding free energy ΔGbind was estimated according to the below equation:27 where ΔGvdW = the van der Waals term for the docking energy; ΔGHbond = the H bonding term for the docking energy; ΔGelec = the electrostatic term for the docking energy; ΔGtor = the torsional free energy term for the ligand when the ligand goes from the unbound to the bound state; and ΔGdesolv = the desolvation term for the docking energy.
The receptor–ligand interactions were gauged using Accelry's Discovery Studio visualizer version 16, which included non-covalent, π-lone pair, π-alkyl, π–π stacking and π–π T-shape stacking interactions.13
Molecular dynamics simulation
The Desmond v3.6 package was used to investigate the structural integrity and stability of the receptor–ligand inclusion complex in the form of molecular dynamics (MD) simulations.28–30 The MD simulations of all four docked complexes were performed with the below mentioned parameters; TIP3P water solvent model: a cubic periodic box containing simple point charge (SPC) (10 Å × 10 Å × 10 Å) with optimized potentials for liquid simulations (OPLS) all-atom force field 2005, a temperature of 298 K, pressure of 1 bar, pH 7.0, Coulomb electrostatics cut-off of van der Waals (vdW) interaction of 7.86, 0.9% NaCl, solvent density 0.997, periodic boundaries, and all atoms mobile.31,32 The MD simulations were performed on 2d60-bisphenol A, 2d60-quercetin, 3cyn-bisphenol A, and 3cyn-quercetin, for 10 ns long time intervals to analyse the stability of their structures and confirmations during the whole event.33 Root mean square deviation (RMSD), root mean square fluctuation (RMSF), hydrogen bond, radius of gyration (Rg), histogram, and torsional evaluation measurements were carried out to predict the structural changes and dynamic fluctuations of the receptor–ligand complexes.
C Results and discussion
Oxidative stress created by BPA was estimated in human erythrocytes with the alleviating effects of quercetin. Human erythrocytes are a reliable and easily obtainable model to detect oxidative stress; their simple internal structure in combination with the absence of a nucleus and organelles offers an ideal environment that is not affected by the complex and renewable buffer system in which a cause-effect relationship can be clearly shown. Also, these cells lacking protein synthesis machinery represent a simplified model. Lipid peroxidation is regarded as one of the main manifestations of oxidative damage and can be seen as one of the major pathways for explaining the toxicity of many xenobiotics. Erythrocytes have been found to be the common targets of such oxidative damage because they are rich in unsaturated lipids.34
The present study reveals that the addition of BPA to erythrocytes causes a significant increase in the lipid peroxidation. The lipid peroxidation (LPO) level in RBCs treated with BPA (25–150 µg mL–1) was found to increase when compared with the untreated control group (Table 1). The increase was found to be concentration-dependent and the maximum increase was found at 150 µg mL–1 of BPA. A previous study35 revealed that the addition of BPA to the RBC suspension caused a concentration-dependent increase in the percentage of haemolysis, which is mainly due to the destabilization of the RBC membrane through reactive oxygen species (ROS) production that leads to the influx of water into the cells, causing haemolysis.
Table 1. The effect of BPA on the LPO levels, and SOD, CAT and GPX activities in human RBCs.
| Concentration of BPA (µg ml–1) | LPO (n moles of MDA produced/60 min ml–1 of packed red blood cells (PRBC)) | SOD (U mg–1 protein) | CAT (µ moles H2O2 per mg protein) | GPX (µ moles GPX per mg protein) |
| 0 (control) | 0.236 ± 0.011 | 9.898 ± 0.053 | 32.133 ± 0.355 | 19.228 ± 0.049 |
| 25 | 1.040 ± 0.064a | 7.906 ± 0.088a | 28.127 ± 0.035a | 14.763 ± 0.357a |
| 50 | 1.457 ± 0.072a | 6.466 ± 0.087a | 25.017 ± 0.150a | 13.996 ± 0.236a |
| 75 | 1.994 ± 0.127a | 5.173 ± 0.065a | 24.126 ± 0.087a | 12.601 ± 0.354a |
| 100 | 2.849 ± 0.111a | 4.813 ± 0.091a | 22.323 ± 0.077a | 12.352 ± 0.169a |
| 125 | 3.841 ± 0.135a | 4.078 ± 0.049a | 22.160 ± 0.193a | 11.355 ± 0.146a |
| 150 | 4.822 ± 0.139a | 2.911 ± 0.146a | 17.929 ± 0.377a | 11.301 ± 0.146a |
Table 2 shows the significant alleviation achieved through the combined treatment of quercetin (10–50 µg mL–1). Only the quercetin (50 µg mL–1) treatment group showed a non-significant difference when compared with the untreated control. The maximum significant (p < 0.001) decrease in the TBARS production was found with the co-treatment of BPA (150 µg mL–1) + quercetin (50 µg mL–1) to be 95.09%. Furthermore, Table 2 show that quercetin inhibited BPA caused lipid peroxidation in erythrocytes in a concentration-dependent manner and indicates its role as an ameliorating agent.
Table 2. The effect of BPA on the LPO levels, and SOD, CAT and GPX activities in human RBCs and its amelioration by quercetin.
| BPA (µg ml–1) | Quercetin (µg ml–1) | LPO (n moles of MDA produced/60 min ml–1 of PRBC) | SOD (U mg–1 protein) | CAT (µ moles H2O2 per mg protein) | GPX (µ moles GPX per mg protein) |
| 0 | 50 | 0.254 ± 0.052 | 10.653 ± 0.120 | 33.767 ± 0.063 | 20.454 ± 0.160 |
| 150 | 0 | 4.822 ± 0.139a | 2.911 ± 0.146a | 17.929 ± 0.377a | 11.301 ± 0.146a |
| 150 | 10 | 2.154 ± 0.117b | 4.397 ± 0.092b | 18.783 ± 0.090b | 14.416 ± 0.383b |
| 150 | 20 | 1.302 ± 0.034b | 5.427 ± 0.128b | 23.688 ± 0.420b | 17.129 ± 0.326b |
| 150 | 30 | 0.642 ± 0.022b | 8.469 ± 0.077b | 29.103 ± 0.368b | 19.787 ± 0.526b |
| 150 | 40 | 0.370 ± 0.017b | 8.999 ± 0.150b | 30.307 ± 0.241b | 20.116 ± 0.217b |
| 150 | 50 | 0.237 ± 0.010b | 10.495 ± 0.137b | 33.515 ± 0.561b | 21.275 0.606b |
The SOD, CAT, and GPX activities in the hemolysate of RBCs was found to decrease significantly (p < 0.001) upon exposure to BPA (25–150 µg mL–1) when compared to the untreated control (Table 1). The overall effect of BPA treatment (25–150 µg mL–1) was found to be concentration dependent. Also, co-treatment of BPA + quercetin (10–50 µg mL–1) was found to ameliorate the changes by increasing the activities of the antioxidant enzymes (Table 2). There was a non-significant difference in the SOD, CAT, and GPX activities of the untreated control and antidote control, i.e. quercetin (50 µg mL–1). A reverse linear correlation was found between the LPO level and SOD, CAT, and GPX activities (R2 = 0.8978, R2 = 0.9131, R2 = 0.7363), respectively, in the human RBCs of BPA treated samples, i.e. an increase in the TBARS levels correlated with a decrease in the activities of the antioxidant enzymes. The BPA + Quercetin treatment showed this type of correlation (R2 = 0.9209, R2 = 0.9893, R2 = 0.9745) in human RBCs, respectively, between the LPO and all three antioxidant enzymes. All of the bisphenols examined caused methemoglobin formation, with BPA inducing the strongest oxidative potential. Flow cytometry analysis showed that all of the bisphenols (excluding BPS) induced significant changes in the erythrocyte size. Changes in the red blood cell shape were examined using phase contrast microscopy. It was noticed that BPA and BPAF induced echinocytosis, and BPF caused stomatocytosis.39 BPA administration has been shown to induce a state of oxidative stress and change the liver and kidney histology of the freshwater fish, C. Idella.40
These observed results confirm that an increase in the LPO was accompanied by a decrease in the activity of the antioxidant enzymes SOD, CAT and GPX in the erythrocytes (Table 1). This is also well-maintained in the reverse correlation between the LPO and antioxidant enzymes erythrocytes. Quercetin was found to decrease the MDA levels and increase the activities of the antioxidant enzymes, indicating that these have a protective effect on maintaining the cell membrane integrity (Table 2). The scavenging role of quercetin might include removing toxins and helping to maintain the internal environment of the cells by lessening the toxicity of BPA. The response was found to be concentration-dependent. The antioxidant effects of quercetin are due to it being able to scavenge free radicals directly to inhibit xanthine oxidase, lipid peroxidation and to alter the antioxidant defence pathway both in vivo and in vitro.36 In Alzheimer's patients, it has been found that the extracellular accumulation of amyloid beta-peptide creates oxidative stress in brain. This formation of amyloid plaques can be prevented by taking quercetin. As quercetin also increases the GSH content, it stops the propagation of lipid peroxidation and ultimately helps to prevent oxidative damage.37 Smoking causes the formation of free radicals, which damages RBC membranes. It was shown in a previous study38 that quercetin aglycone and its conjugate metabolites have protect against the smoking caused membrane damage of RBCs. This study reveals that the hydroxyl groups present in the structure of quercetin are responsible for the antioxidant activities of quercetin. Quercetin is the member of the flavonoid family that has the most effective scavenging activity for ROS. Due to its contribution to the total plasma antioxidant capacity, it also permits the formation of an endogenous antioxidant shield.
Molecular docking analysis
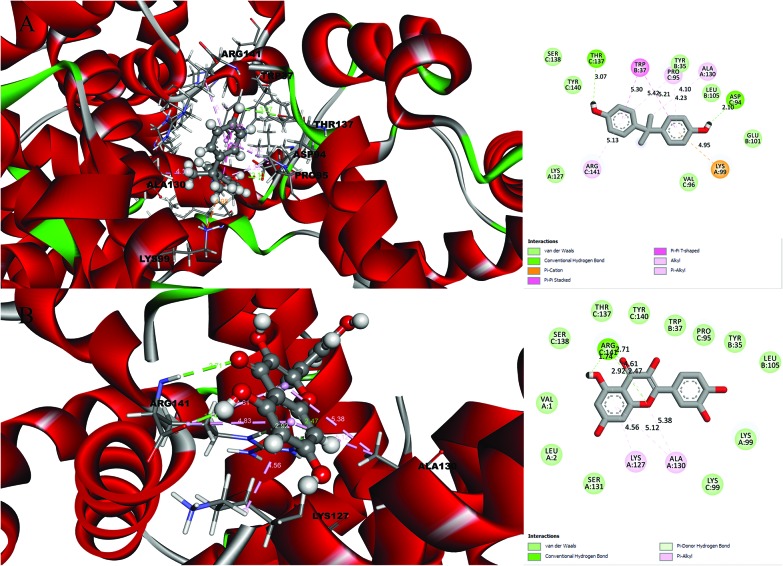
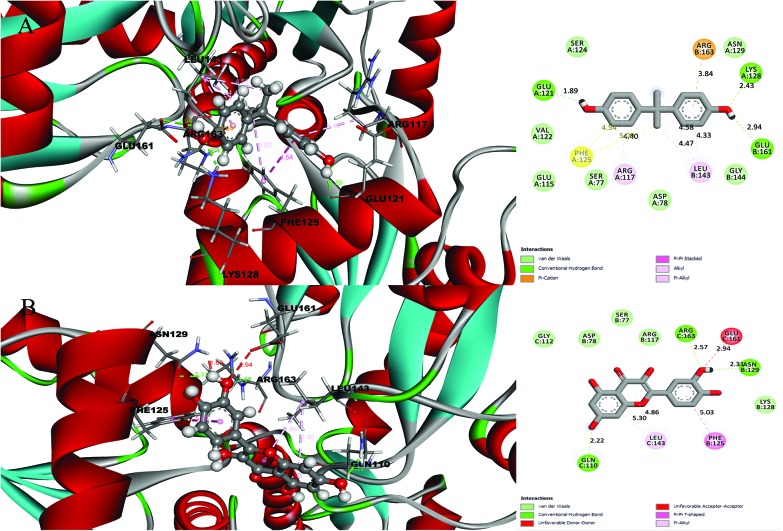
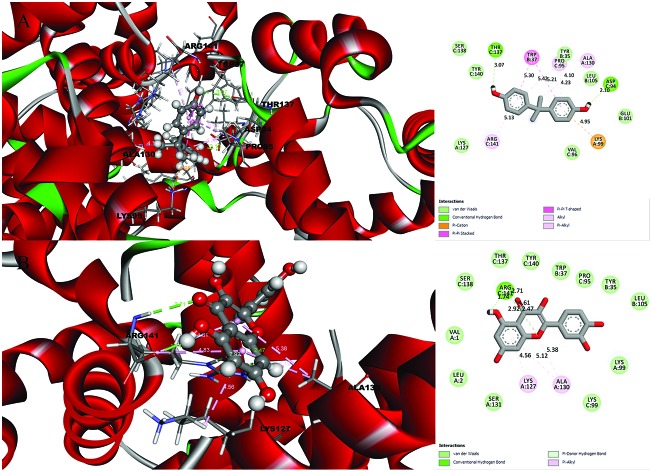
A detailed investigation on the binding affinities of BPA and quercetin towards 2d60 and 3cyn (Fig. 1 and 2) was carried out to decipher the plausible binder.
Fig. 1. Molecular docking results and receptor–ligand interactions for with a 2D representation of the crystal structure of the deoxy human haemoglobin protein (PDB code: 2d60) with (A) BPA and (B) quercetin.
Fig. 2. Molecular docking results and receptor–ligand interactions for a with 2D representation of the structure of the human GPX8 protein (PDB code: 3cyn) with (A) BPA and (B) quercetin.
After analysing the docking results, quercetin was found to be a potential docked ligand for both receptors, with binding energies of 7.906 and 7.535 kcal mol–1, respectively (Table 3), and interacted with Val 1, Leu 2, Tyr 35, Trp 37, Ser 77, Asp 78, Pro 95, Lys 99, Leu 105, Gln 110, Arg 117, Phe 125, Lys 127, Lys 128, Asn 129, Ala 130, Ser 131, Gly 112, Thr 137, Ser 138, Tyr 140, Arg 141, Leu 143, Glu 161, and Arg 163. These results are significant and might be a potential cause for the higher affinity of quercetin with the 2d60 and 3cyn complexes.
Table 3. Molecular docking results analysis: the binding energy, hydrogen bonds, contacting residues.
| Proteins | Ligands | Binding energy [kcal mol–1] | Hydrogen bonds | Contacting receptor residues |
| 2D60 | BPA | 6.627 | 2 | Lys 99, Lys 127, Ala 130, Tyr 35, Trp 37, Glu 101, Leu 105, Asp 94, Pro 95, Val 96, Thr 137, Ser 138, Tyr 140, Arg 141 |
| Quercetin | 7.906 | 2 | Val 1, Leu 2, Lys 99, Lys 127, Ala 130, Ser 131, Tyr 35, Trp 37, Leu 105, Pro 95, Lys 99, Thr 137, Ser 138, Tyr 140, Arg 141 | |
| 3CYN | BPA | 6.958 | 2 | Ser 77, Asp 78, Glu 115, Arg 117, Glu 121, Val 122, Ser 124, Phe 125, Lys 128, Asn 129, Leu 143, Gly 144, Glu 161, Arg 163 |
| Quercetin | 7.535 | 3 | Ser 77, Asp 78, Arg 117, Phe 125, Lys 128, Asn 129, Gln 110, Gly 112, Leu 143, Glu 161, Arg 163 |
Molecular dynamics simulation
A total of four molecular dynamics simulations were carried out to explore the structural details of both compounds (BPA and quercetin) over a 10 ns time period. The best docking modes of the selected complexes were considered in the MD simulations. The equilibrium of the MD trajectories were evaluated by event and quality analysis, which included protein–ligand root mean square deviations (RMSD), protein RMSD, protein root mean square fluctuations (RMSF), protein secondary structure elements (SSE) analysis, ligand RMSF, protein–ligand contacts, ligand–protein contacts, ligand torsional profiles, and ligand properties.
The protein RMSD plot shows the RMSD evolution of a protein (left Y-axis). All of the protein frames are first aligned on the reference frame backbone, and then the RMSD is calculated based on the atom selection. Monitoring the RMSD of the protein can give an insight into its structural conformation throughout the simulation. RMSD analysis provides point wise distribution on the ligand over the receptor during the MD simulation event which reveals the fluctuations and stabilization of receptor–ligand complex. Changes in the order of 1–3 Å are perfectly acceptable for small, globular proteins. Changes much larger than that, however, indicate that the protein underwent a large conformational change during the simulation (Fig. S1, S2, S3, and S4†).
The ligand RMSD (right Y-axis) shows the stability of the ligand with respect to the protein and its binding pocket. In the ligand RMSD plot, the ‘Ligand fit Protein’ shows the RMSD of a ligand when the protein–ligand complex is first aligned on the protein backbone of the reference and then the RMSD of the ligand heavy atoms is measured. If the values observed are significantly larger than the RMSD of the protein, then it is likely that the ligand has diffused away from its initial binding site. The ‘Ligand fit ‘Ligand’ shows a RMSD of a ligand that is aligned and measured just on its reference conformation. This RMSD value is a measure of the internal fluctuations of the ligand atoms (Fig. S5, S6, S7 and S8†).
The protein root mean square fluctuation (RMSF) peaks indicate areas of the protein that fluctuate the most during the simulation. Secondary structure elements such as alpha helices and beta strands are usually more rigid than the unstructured part of the protein, and thus fluctuate less than the loop regions. Secondary structure elements (SSE) containing alpha-helical and beta-strand regions are highlighted with red and blue backgrounds, respectively. These regions are defined by helices or strands that persist over 70% of the entire simulation. Protein residues that interact with the ligand are marked with green-coloured vertical bars. The RMSF of the protein can also be correlated with the experimental X-ray B-factor (right Y-axis). Due to the difference between the RMSF and B-factor definitions, one-to-one correspondence should not be expected. However, the simulation results should be in line with the crystallographic data (Fig. S9, S10, S11 and S12†).
The protein secondary structure elements (SSE), such as alpha-helices and beta-strands, were monitored throughout the simulation. The SSE vs. residue index reports the SSE distribution by residue index throughout the protein structure. The time vs. residue index summarizes the SSE composition for each trajectory frame over the course of the simulation, and the plot at the bottom monitors each residue and its SSE assignment over time (Fig. S9, S10, S11 and S12†).
The ligand root mean square fluctuation (L-RMSF) plot shows the ligand fluctuations broken down by atom, corresponding to the 2D structure in the top panel of the plot. In the bottom panel, the ‘Fit Ligand on Protein’ line shows the ligand fluctuations, with respect to the protein. The protein–ligand complex is first aligned on the protein backbone and then the ligand RMSF is measured based on the ligand heavy atoms. The ‘Ligand’ line shows fluctuations where the ligand in each frame is aligned on the ligand in the reference frame, and the fluctuations of the ligand heavy atoms are measured. These RMSF values reflect the internal atom fluctuations of the ligand (Fig. S13, S14, S15 and S16†).
Protein interactions with the ligand can be monitored throughout the simulations. These interactions can be categorized by type and summarized, as shown in the protein–ligand interactions plot (Fig. S17, S18, S19 and S20†). Protein–ligand interactions (or ‘contacts’) can be categorized into four types: hydrogen bonds, hydrophobic, ionic and water bridges. Each interaction type contains more specific subtypes, which can be explored through the ‘Simulation Interactions Diagram’ panel. The stacked bar charts are normalized over the course of the trajectory. Hydrogen bonds (H-bonds) play a significant role in ligand binding. Consideration of the hydrogen-bonding properties in drug design is important because of their strong influence on drug specificity, metabolization and adsorption (Fig. S25, S26, S27 and S28†).
Hydrogen bonds between a protein and a ligand can be further broken down into four subtypes: backbone acceptor, backbone donor, side-chain acceptor, and side-chain donor. The current geometric criteria for a protein–ligand H-bond is: a distance of 2.5 Å between the donor and acceptor atoms (D—H···A), a donor angle of >120° between the donor-hydrogen-acceptor atoms (D—H···A), and an acceptor angle of >90° between the hydrogen-acceptor-bonded atom (H···A—X). Hydrophobic contacts fall into three subtypes: π-cations, π–π, and other, non-specific interactions. Generally these types of interactions involve a hydrophobic amino acid and an aromatic or aliphatic group on the ligand, but we have extended this category to also include π-cation interactions. The current geometric criteria for hydrophobic interactions is as follows: π-cations—aromatic and charged groups within 4.5 Å, two π–π aromatic groups stacked face-to-face or face-to-edge, other—a non-specific hydrophobic side chain within 3.6 Å of ligand aromatic or aliphatic carbons. Ionic or polar interactions, are found between two oppositely charged atoms that are within 3.7 Å of one another and do not involve a hydrogen bond. We also monitored the protein–metal–ligand interactions, which are defined by a metal ion coordinated within 3.4 Å of protein and ligands heavy atoms (except for carbon). All ionic interactions can be broken down into two subtypes: those mediated by either a protein backbone or side chains. Water bridges are hydrogen-bonded protein–ligand interactions mediated by a water molecule. The hydrogen-bond geometry is slightly relaxed from the standard H-bond definition. The current geometric criteria for a protein–water or water–ligand H-bond are: a distance of 2.7 Å between the donor and acceptor atoms (D—H···A), a donor angle of >10° between the donor-hydrogen-acceptor atoms (D—H···A), and an acceptor angle of >80° between the hydrogen-acceptor-bonded atom (H···A—X) (Fig. S25, S26, S27 and S28†).
A timeline representation of the interactions and contacts (H-bonds, hydrophobic, ionic, and water bridges (Fig. S21, S22, S23 and S24†)) has been previously summarized. The top panel shows the total number of specific contacts the protein makes with the ligand over the course of the trajectory. The bottom panel shows which residues interact with the ligand in each trajectory frame. Some residues make more than one specific contact with the ligand, which is represented by a darker shade of orange, according to the scale to the right of the plot.
A schematic diagram of interactions found between receptor and ligand depicted with atom-level distribution. Interactions that occur for more than 30.0% of the simulation time in the selected trajectory (0.00 through 10.00 nanoseconds), are shown. Note: It is possible to have interactions that are >100% as some residues may have multiple interactions of a single type with the same ligand atom. The ligand torsion plot summarizes the conformational evolution of every rotatable bond (RB) in the ligand throughout the simulation trajectory (0.00 through 10.00 nanoseconds). The top panel shows a 2d schematic of the ligand with color-coded rotatable bonds. Each rotatable bond torsion is accompanied by a dial plot and bar plots of the same colour. Dial (or radial) plots describe the conformation of the torsion throughout the course of the simulation.
The beginning of the simulation is in the center of the radial plot and the time evolution is plotted radially outwards. The bar plots summarize the data on the dial plots, by showing the probability density of the torsion. If torsional potential information is available, the plot also shows the potential of the rotatable bond (by summing the potential of the related torsions). The values of the potential are on the left Y-axis of the chart, and are expressed in kcal mol–1. Looking at the histogram and torsion potential relationships may give an insight into the conformational strain that the ligand undergoes to maintain a protein-bound conformation (Fig. S29, S30, S31 and S32†).
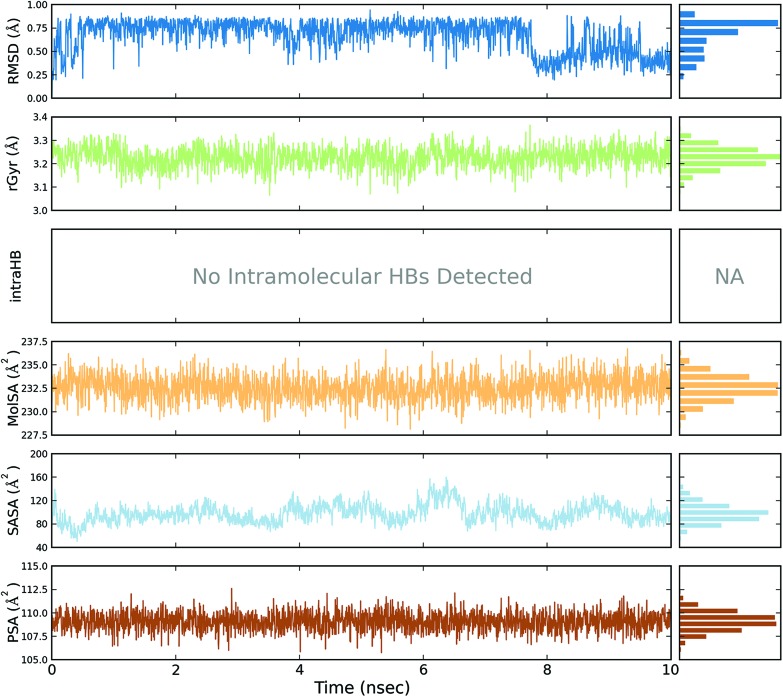
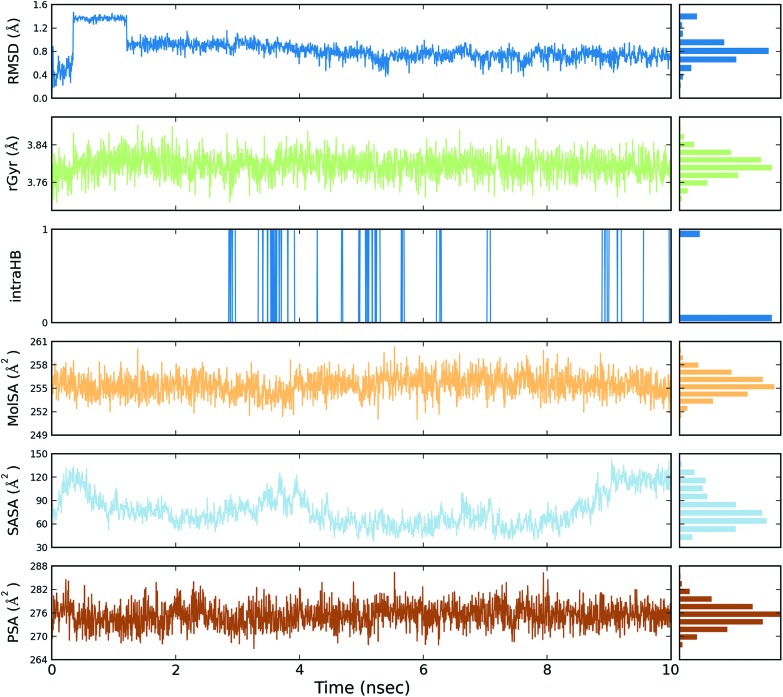
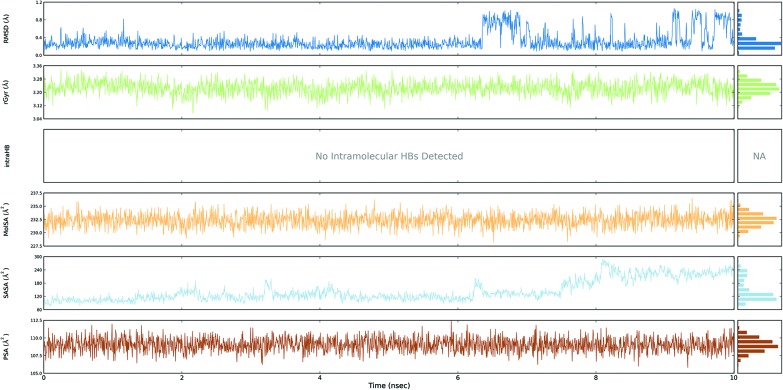
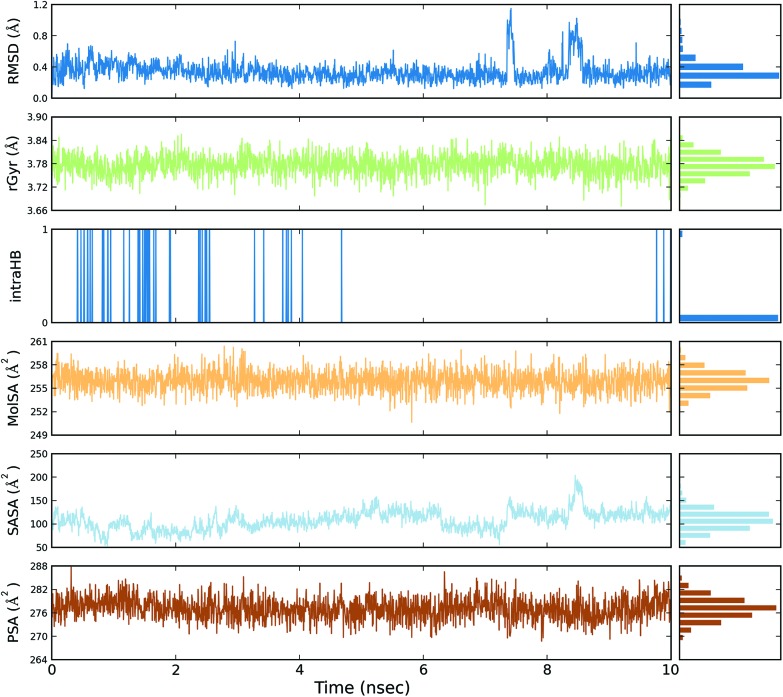
The ligand root mean square deviation (RMSD) of a ligand with respect to the reference conformation (typically the first frame is used as the reference and it is regarded as time t = 0). The radius of gyration (rGyr) is used to measure how extended a ligand is, and is equivalent to its principal moment of inertia. The molecular surface area (MolSA) was calculated with probe radius which was 1.4 Å. This value is equivalent to a van der Waals surface area. The solvent accessible surface area (SASA) is the surface area of a molecule accessible by a water molecule and the polar surface area (PSA) is the solvent accessible surface area in a molecule contributed to only by oxygen and nitrogen atoms (Fig. 3, 4, 5 and 6).
Fig. 3. Event analysis of the ligand in the crystal structure of deoxy human haemoglobin protein (PDB code: 2d60) with BPA.
Fig. 4. Event analysis of the ligand in the structure of human GPX8 protein (PDB code: 3cyn) with BPA.
Fig. 5. Event analysis of the ligand in the crystal structure of deoxy human haemoglobin protein (PDB code: 2d60) with quercetin.
Fig. 6. Event analysis of the of ligand in the structure of human GPX8 protein (PDB code: 3cyn) with quercetin.
On the basis of molecular dynamics analysis, quercetin has been identified as a potent antioxidant. It fights against free radicals, which disturbs the balance between the antioxidants and oxidants in the body. Thus, quercetin seems protect against reperfusion, and can inhibit low-density lipoprotein (LDL) oxidation in vitro, and atherosclerosis, etc. by directly scavenging free radicals.41
Conclusions
In BPA toxicity tests on human erythrocytes, different concentrations of BPA were shown to increase LPO. It was also observed that the combination of BPA and quercetin lowered LPO levels in human blood cells, due to an increase in antioxidant enzymes. Quercetin was found to prevent BPA induced-oxidative stress, mostly likely due to its nucleophilic, radical scavenging and detoxifying properties. Thus, dietary supplementation of quercetin-containing fruits and vegetables might be beneficial to populations that are exposed to BPA through a variety of sources. Molecular docking and dynamics simulations experiments were used to understand the roles and interactions of BPA and quercetin in terms of toxicity and amelioration, respectively, at the molecular level, and the results were found to be in agreement with those of the in vitro study, which revealed the same mechanism of binding and stabilization.
Funding
Sangai NP (SR/WOS-A/LS-270/2012) is thankful for the financial assistance under the scheme of Women Scientists – A (WOS-A) from the Department of Science and Technology (DST), Government of India, New Delhi, India. Mr. Chirag N. Patel acknowledges financial assistance from the University Grants Commission (UGC), Govt. of India in the form of a Rajiv Gandhi National Fellowship.
Conflicts of interest
All the authors have read and agreed to the submission of this paper and there is no conflict of interest among the authors and their institutions.
Supplementary Material
Acknowledgments
The authors gratefully acknowledge the Department of Botany, Bioinformatics and Climate Change Impacts Management at Gujarat University for providing the opportunity to access the bioinformatics research facilities.
Footnotes
†Electronic supplementary information (ESI) available. See DOI: 10.1039/c8tx00105g
References
- Bensaude-Vincent B. and Simon J., Chemistry: The impure science, World Scientific, 2012. [Google Scholar]
- Tiwari D., Vanage G. Int. J. Toxicol. 2017;36:142–152. doi: 10.1177/1091581817691224. [DOI] [PubMed] [Google Scholar]
- Korkmaz A., Ahbab M. A., Kolankaya D., Barlas N. Food Chem. Toxicol. 2010;48:2865–2871. doi: 10.1016/j.fct.2010.07.019. [DOI] [PubMed] [Google Scholar]
- Aydoğan M., Korkmaz A., Barlas N., Kolankaya D. Toxicology. 2008;249:35–39. doi: 10.1016/j.tox.2008.04.002. [DOI] [PubMed] [Google Scholar]
- Li D., Zhou Z., Qing D., He Y., Wu T., Miao M., Wang J., Weng X., Ferber J., Herrinton L. Hum. Reprod. 2009;25:519–527. doi: 10.1093/humrep/dep381. [DOI] [PubMed] [Google Scholar]
- Lagos-Cabré R., Moreno R. D. Biol. Res. 2012;45:5–14. doi: 10.4067/S0716-97602012000100001. [DOI] [PubMed] [Google Scholar]
- Miao M., Yuan W., Yang F., Liang H., Zhou Z., Li R., Gao E., Li D.-K. Int. J. Environ. Res. Public Health. 2015;12:13240–13250. doi: 10.3390/ijerph121013240. [DOI] [PMC free article] [PubMed] [Google Scholar]
- Scalbert A., Williamson G. J. Nutr. 2000;130:2073S–2085S. doi: 10.1093/jn/130.8.2073S. [DOI] [PubMed] [Google Scholar]
- Massi A., Bortolini O., Ragno D., Bernardi T., Sacchetti G., Tacchini M., De Risi C. Molecules. 2017;22:1270. doi: 10.3390/molecules22081270. [DOI] [PMC free article] [PubMed] [Google Scholar]
- Suganthy N., Devi K. P., Nabavi S. F., Braidy N., Nabavi S. M. Biomed. Pharmacother. 2016;84:892–908. doi: 10.1016/j.biopha.2016.10.011. [DOI] [PubMed] [Google Scholar]
- de Oliveira M. R., Nabavi S. M., Braidy N., Setzer W. N., Ahmed T., Nabavi S. F. Biotechnol. Adv. 2016;34:532–549. doi: 10.1016/j.biotechadv.2015.12.014. [DOI] [PubMed] [Google Scholar]
- Kumar S., Pandey A. K. Sci. World J. 2013:2013. [Google Scholar]
- Panchal U., Modi K., Dey S., Prajapati U., Patel C., Jain V. J. Lumin. 2017;184:74–82. [Google Scholar]
- Modi K., Panchal U., Dey S., Patel C., Kongor A., Pandya H. A., Jain V. J. Fluoresc. 2016;26:1729–1736. doi: 10.1007/s10895-016-1864-6. [DOI] [PubMed] [Google Scholar]
- Verma R., Raval P. Bull. Environ. Contam. Toxicol. 1991;47:428–432. doi: 10.1007/BF01702206. [DOI] [PubMed] [Google Scholar]
- Ohkawa H., Ohishi N., Yagi K. Anal. Biochem. 1979;95:351–358. doi: 10.1016/0003-2697(79)90738-3. [DOI] [PubMed] [Google Scholar]
- Kakkar P., Das B. and Viswanathan P., A modified spectrophotometric assay of superoxide dismutase, 1984. [PubMed] [Google Scholar]
- Lück H., in Methods of enzymatic analysis, Elsevier, 1965, pp. 885–894. [Google Scholar]
- Grunert R., Phillips P. Arch. Biochem. 1951;30:217. [PubMed] [Google Scholar]
- Lowry O., Rosebrough N., Farr A., Randall R., J. Biol. Chem., 1951, 193 , 265 –275 , , Back to cited text, 1951 . [PubMed] [Google Scholar]
- Yokoyama T., Neya S., Tsuneshige A., Yonetani T., Park S.-Y., Tame J. R. J. Mol. Biol. 2006;356:790–801. doi: 10.1016/j.jmb.2005.12.018. [DOI] [PubMed] [Google Scholar]
- Parmar R., Patel C. N., Highland H., Desai K. and George L. B., Pesticide Target Protein and Phytochemical Interactions-A Computational Study Mitigating Mosquito-Vectors, Young Scientists' Conference, India International Science Festival, 2015.
- Prasanth Kumar S., Jasrai Y. T., Pandya H. A., Rawal R. M. J. Biomol. Struct. Dyn. 2015;33:56–69. doi: 10.1080/07391102.2013.849618. [DOI] [PubMed] [Google Scholar]
- Krieger E., Koraimann G., Vriend G. Proteins: Struct., Funct., Bioinf. 2002;47:393–402. doi: 10.1002/prot.10104. [DOI] [PubMed] [Google Scholar]
- Krieger E., Darden T., Nabuurs S. B., Finkelstein A., Vriend G. Proteins: Struct., Funct., Bioinf. 2004;57:678–683. doi: 10.1002/prot.20251. [DOI] [PubMed] [Google Scholar]
- Parmar F., Patel C., Highland H., Pandya H., George L.-B. Adv. Biol. 2016:2016. [Google Scholar]
- Patel C. N., Georrge J. J., Modi K. M., Narechania M. B., Patel D. P., Gonzalez F. J., Pandya H. A. J. Biomol. Struct. Dyn. 2017:1–20. doi: 10.1080/07391102.2017.1404931. [DOI] [PMC free article] [PubMed] [Google Scholar]
- Bowers K. J., Chow D. E., Xu H., Dror R. O., Eastwood M. P., Gregersen B. A., Klepeis J. L., Kolossvary I., Moraes M. A., Sacerdoti F. D. and Salmon J. K., Scalable Algorithms for Molecular Dynamics Simulations on Commodity Clusters, SC '06: Proceedings of the 2006 ACM/IEEE Conference on Supercomputing, Tampa, FL, 2006, p. 43.
- S. Release, 1: Desmond Molecular Dynamics System, version 3.7, DE Shaw Research, New York, NY, 2014. Maestro-Desmond Interoperability Tools, version, 2014, 3.
- Shivakumar D., Williams J., Wu Y., Damm W., Shelley J., Sherman W. J. Chem. Theory Comput. 2010;6:1509–1519. doi: 10.1021/ct900587b. [DOI] [PubMed] [Google Scholar]
- Jorgensen W. L., Chandrasekhar J., Madura J. D., Impey R. W., Klein M. L. J. Chem. Phys. 1983;79:926–935. [Google Scholar]
- Reddy S., Reddy K. T., Kumari V. V., Basha S. H. J. Biomol. Struct. Dyn. 2015;33:2695–2709. doi: 10.1080/07391102.2015.1004834. [DOI] [PubMed] [Google Scholar]
- Darjee S. M., Modi K. M., Panchal U., Patel C., Jain V. K. J. Mol. Struct. 2017;1133:1–8. [Google Scholar]
- Sen T., Ghosh T. and Chaudhuri A., Glucose oxidase-induced lysis of erythrocytes, 1995. [PubMed] [Google Scholar]
- Verma R. J., Sangai N. P. Acta Pol. Pharm. 2009;66:41–44. [PubMed] [Google Scholar]
- Fiorani M., de Sanctis R., Menghinello P., Cucchiarini L., Cellini B., Dachà M. Free Radical Res. 2001;34:639–648. doi: 10.1080/10715760100300531. [DOI] [PubMed] [Google Scholar]
- Ansari M. A., Abdul H. M., Joshi G., Opii W. O., Butterfield D. A. J. Nutr. Biochem. 2009;20:269–275. doi: 10.1016/j.jnutbio.2008.03.002. [DOI] [PMC free article] [PubMed] [Google Scholar]
- Begum A. N., Terao J. J. Nutr. Biochem. 2002;13:265–272. doi: 10.1016/s0955-2863(01)00219-4. [DOI] [PubMed] [Google Scholar]
- Macczak A., Cyrkler M., Bukowska B., Michalowicz J. Toxicol. In Vitro. 2017;41:143–149. doi: 10.1016/j.tiv.2017.02.018. [DOI] [PubMed] [Google Scholar]
- Faheem M., Lone K. P. Braz. J. Pharm. Sci. 2017;53(3):e17003. [Google Scholar]
- Kerry N. L., Abbey M. Atheroscelerosis. 1997;135(1):93–102. doi: 10.1016/s0021-9150(97)00156-1. [DOI] [PubMed] [Google Scholar]
Associated Data
This section collects any data citations, data availability statements, or supplementary materials included in this article.


