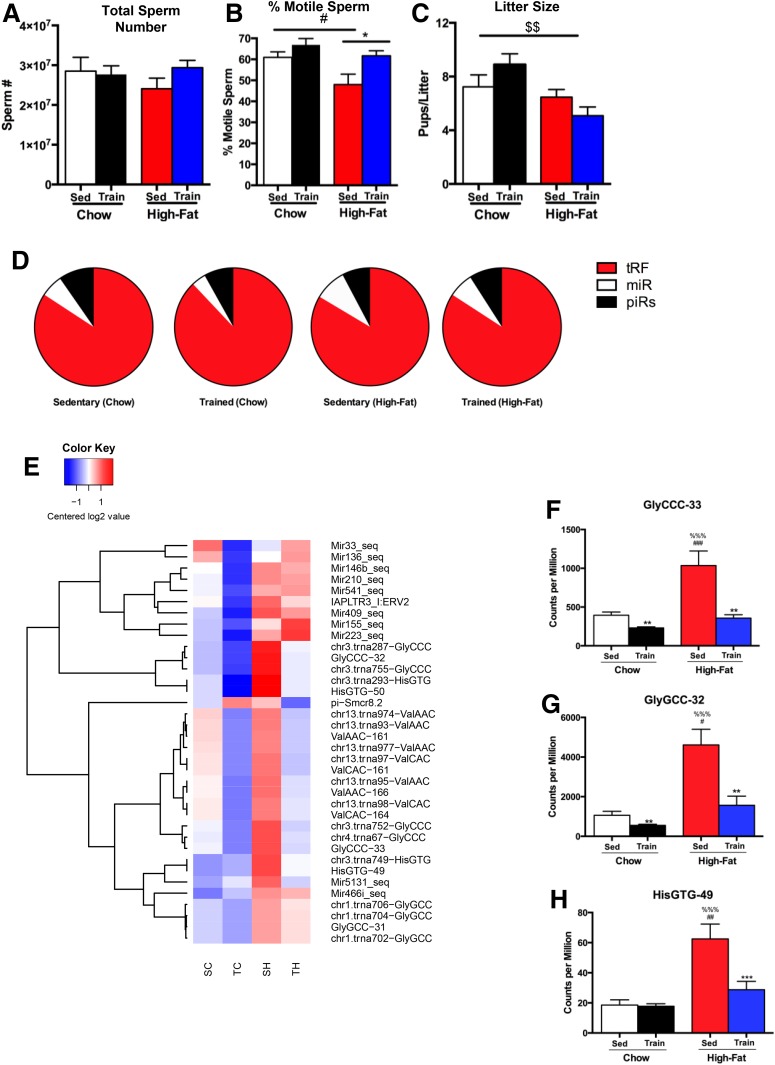
Figure 5.
Paternal exercise and high-fat diet alter sperm composition. Total sperm (A) and sperm motility (B) were measured in Sedentary (Sed) and Trained (Train) chow-fed (Chow) and high fat–fed (High-Fat) male mice, and litter size (C) was measured in litters from Sedentary and Trained chow-fed and high fat–fed sires. Data are expressed as the mean ± SEM (n = 10/group). Symbols represent differences compared with Sedentary control groups (*P < 0.05); Sedentary Chow vs. Sedentary High-Fat (#P < 0.05); or an overall effect of chow vs. high-fat diet ($$P < 0.01). D: Pie charts showing the percentage of small RNAs mapping to the indicated features. E: Heat maps showing the differences in expression of small RNAs in response to paternal diet and exercise. SC, Sedentary chow-fed; SH, Sedentary high fat–fed; TC, Trained chow-fed; TH, Trained high fat–fed. F–H: Select tRFs that are altered with diet and exercise. GlyCCC-33 (F), GlyGCC-32 (G), and HisGTG-49 (H). Data are expressed as the mean ± SEM (n = 11–12/group). Symbols represent differences compared with Sedentary control groups (**P < 0.01; ***P < 0.001); Sedentary Chow vs. Sedentary High-Fat (#P < 0.05, ##P < 0.01, ###P < 0.001); or Sedentary High-Fat vs. Trained Chow (%%%P < 0.001).

