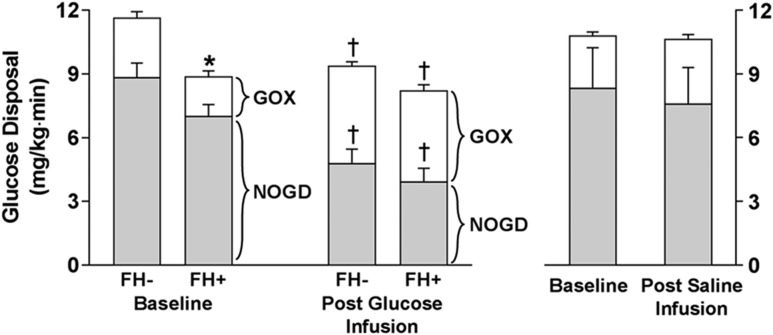
Figure 3.
Insulin-stimulated TGD (total height of bars), nonoxidative glucose disposal (NOGD) (shaded part of bars), and glucose oxidation (GOX) in FH+ and FH− individuals during the euglycemic insulin clamp performed at baseline and after 3 days of glucose infusion. Right panel shows control subjects receiving saline infusion. *P < 0.05, FH+ vs. FH−; †P < 0.05, postglucose infusion vs. baseline.

