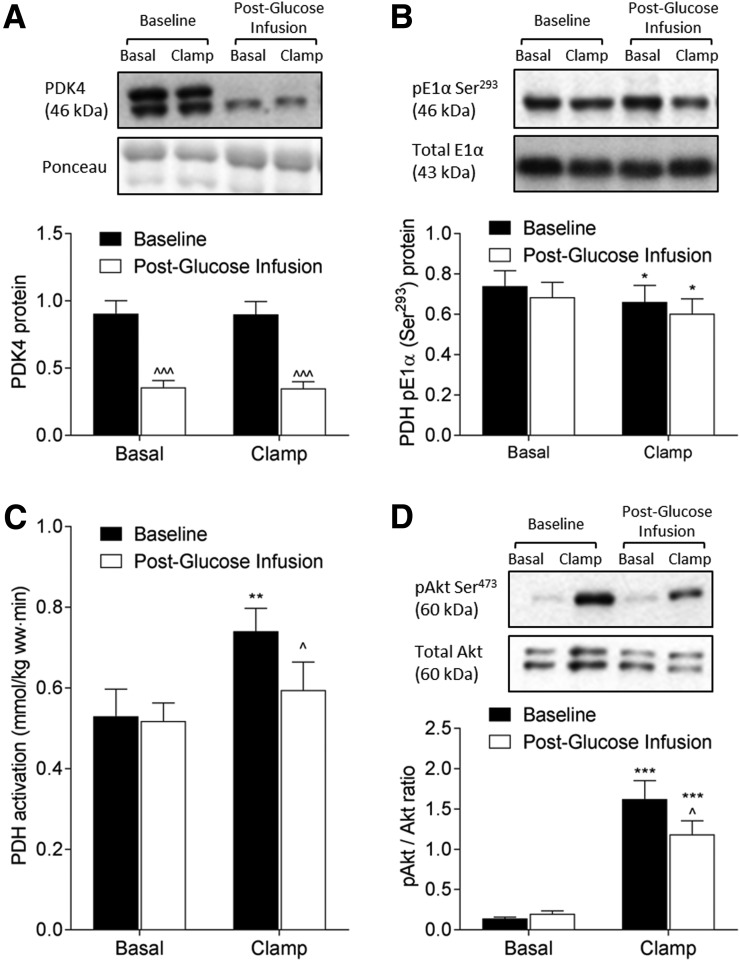
Figure 5.
PDH regulation and insulin signaling. Representative Western blot images and densitometry quantitation of PDK4 protein expression (A), PDH E1α subunit phosphorylation (B), and Akt phosphorylation (D) and PDH activation status (C) at baseline (black bars) and after 3 days of glucose (white bars) infusion in NGT subjects. Data represent mean ± SE and were analyzed using two-way mixed-model (group × clamp; group × infusion) ANOVA. *P < 0.05, **P < 0.01, and ***P < 0.001 for clamp vs. basal; ^P < 0.05 and ^^^P < 0.001, postglucose infusion vs. baseline.

