Abstract
Metazoan gene regulation often involves pausing of RNA polymerase II (Pol II) in the promoter-proximal region. Paused Pol II is stabilized by the protein complexes DRB sensitivity-inducing factor (DSIF) and negative elongation factor (NELF). Here we report the cryo-electron microscopy (cryo-EM) structure of the paused Sus scrofa/Homo sapiens Pol II-DSIF-NELF transcription elongation complex (PEC) at 3.2 Å resolution. The structure reveals a tilted DNA-RNA hybrid that impairs binding of the nucleoside triphosphate (NTP) substrate. NELF binds the polymerase funnel, bridges two mobile polymerase modules, and contacts the trigger loop, thereby restraining Pol II mobility that is required for pause release. NELF prevents binding of the anti-pausing factor TFIIS. Additionally, NELF possesses two flexible tentacles that can contact DSIF and exiting RNA. These results define the paused state of Pol II and provide the molecular basis for understanding NELF function during promoter-proximal gene regulation.
RNA polymerase (Pol) II transcribes eukaryotic protein-coding genes and is controlled at multiple levels. When Pol II begins to elongate the pre-mRNA chain, its activity is regulated by elongation factors with positive and negative roles1. Elongating Pol II can be blocked2,3 or paused in the promoter-proximal region4,5. Paused Pol II is stabilized by two factors, the 5,6-Dichloro-1-beta-D-ribofuranosylbenzimidazole (DRB) sensitivity inducing factor (DSIF), composed of subunits SPT4 and SPT5, and the negative elongation factor (NELF), composed of the four subunits NELF-A, -B, -C (or isoform NELF-D that lacks the first nine NELF-C residues), and -E6–8. Paused polymerase is released by the positive transcription elongation factor b (P-TEFb), which contains the kinase CDK9 and the predominant cyclin subunit CYCT19,10. P-TEFb phosphorylates Pol II, DSIF, and NELF11–13. DSIF and its homologs are conserved from bacteria to human, whereas NELF is generally conserved among metazoa8. Genes regulated by Pol II pausing often function during organism development or environmental responses14–17. Pol II pausing is also used by viruses such as the human immunodeficiency virus (HIV)-1 to recruit viral factors such as Tat and to promote transcription elongation through P-TEFb3,10.
The structural basis for RNA chain elongation by Pol II has been well studied18, but the factor-dependent mechanisms that regulate Pol II elongation are poorly understood. Our lab recently reported the structure of the mammalian Pol II elongation complex (EC) bound to DSIF19, and others reported a similar structure for yeast20. DSIF was observed to form DNA and RNA clamps around the Pol II upstream DNA and exiting RNA, respectively19. We also reported the crystal structure of a dimeric NELF subcomplex comprising the N-terminal region of NELF-A and the middle and C-terminal regions of NELF-C (NELF-AC dimer)21. Other regions of NELF are structurally uncharacterized, except for the small RNA recognition motif (RRM) domain of NELF-E22. It is unknown how NELF binds the Pol II-DSIF EC and how it stabilizes pausing.
Here we provide the cryo-EM structure of the paused Pol II EC bound to DSIF and NELF (paused EC, or ‘PEC’) at a nominal resolution of 3.2 Å. The structure was determined on a DNA-RNA scaffold that bears the sequence of a well characterized promoter-proximal pause site3,23 found in the HIV-1 provirus. Our structure indicates that NELF uses several mechanisms to interfere with nucleotide addition and polymerase progression. Complementary biochemical data and comparisons with published results provide the molecular basis for NELF-dependent promoter-proximal pausing.
Structure of paused elongation complex
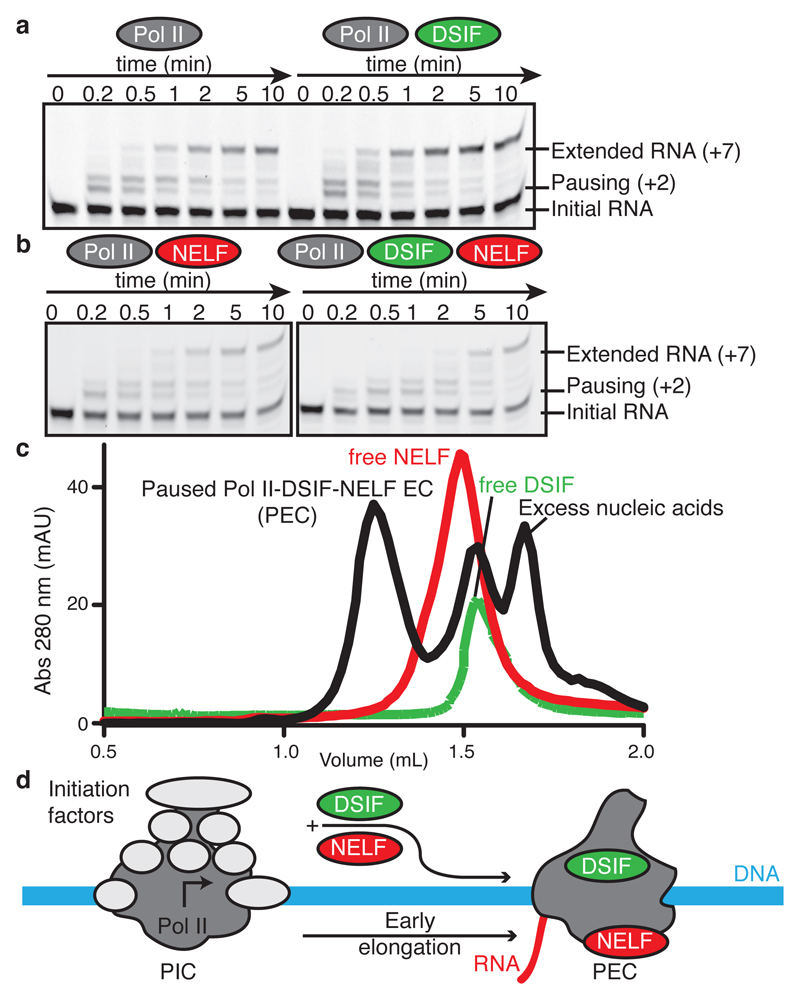
We purified endogenous porcine (S. scrofa) Pol II, which is virtually identical to human Pol II (Extended Data Table 1), and prepared recombinant human DSIF and NELF by co-expression of their subunits in bacteria and insect cells, respectively (Extended Data Fig. 1a, Methods). We then investigated transcriptional pausing in vitro with the use of a DNA template bearing a pause sequence and a short complementary RNA transcript (‘pause assay scaffold’, Extended Data Fig. 1b, Methods). The sequence is well-studied in the bacterial transcription system and is known to cause pausing of mammalian Pol II24. ECs were assembled with the RNA 3’-end two nucleotides upstream of the consensus pause site. We found that Pol II briefly paused at the consensus pause site (+2 position) in the absence of factors, as observed before24 (Fig. 1a, Extended Data Fig. 1e). Incubation with DSIF slightly suppressed pausing, whereas NELF alone had no effect on pausing or RNA elongation. In contrast, addition of both DSIF and NELF resulted in strong pausing at the +2 position and impeded further RNA extension (Fig. 1b, Extended Data Fig. 1e). These results show that our recombinant factors can stabilize Pol II in the paused state.
Figure 1. Formation of paused Pol II-DSIF-NELF elongation complex (PEC).
a. DSIF alone does not stabilize Pol II pausing. Fluorescence-monitored RNA extension (Methods) on the pause assay scaffold (50 nM) with a 5’ FAM-labelled RNA, 75 nM Pol II (left) or Pol II and 237 nM DSIF (right). Reactions were quenched at various times after GTP/CTP (10 µM) addition and RNAs were separated on TBE urea gels. ECs were assembled two nucleotides before the consensus pause site (+2). The band above the +2 band stems from a backtracked species24. The +2 site and extended RNA are marked. All experiments were performed at least 3 times. Quantification of gels in panels a and b can be found in Extended Data Fig. 1e. A fraction of the input RNA remains due to inefficient EC formation (Methods).
b. DSIF and NELF are required for stable Pol II pausing. Experiments conducted as in a but in the presence of 237 nM NELF (left) or 237 nM DSIF and NELF (right). All experiments were performed at least three times.
c. Formation of a stable paused Pol II-DSIF-NELF EC (PEC) on a Superose 6 size exclusion chromatography column. Curves show absorption at 280 nm milli absorption units (mAU) at specific elution volumes (mL). All experiments were performed three times.
d. Schematic of conversion of the Pol II pre-initiation complex (PIC) to a promoter-proximally paused Pol II-DSIF-NELF EC (PEC).
To determine the cryo-EM structure of the PEC, we assembled the PEC using a DNA-RNA scaffold that mimics the nucleic acid arrangement during human Pol II pausing on a strong HIV-1 promoter-proximal pause site23 (‘HIV-1 pause scaffold’, Extended Data Fig. 1c). This scaffold includes a hairpin in the exiting RNA known as the transactivation response element (TAR)3. A similar scaffold with a nearly identical template sequence recapitulates the effects of DSIF and NELF on Pol II pausing (‘HIV-1 transcription scaffold’, Extended Data Fig. 2). The PEC was assembled from pure components, isolated by size exclusion chromatography, and gently crosslinked with glutaraldehyde (Fig. 1c, Extended Data Fig. 1d).
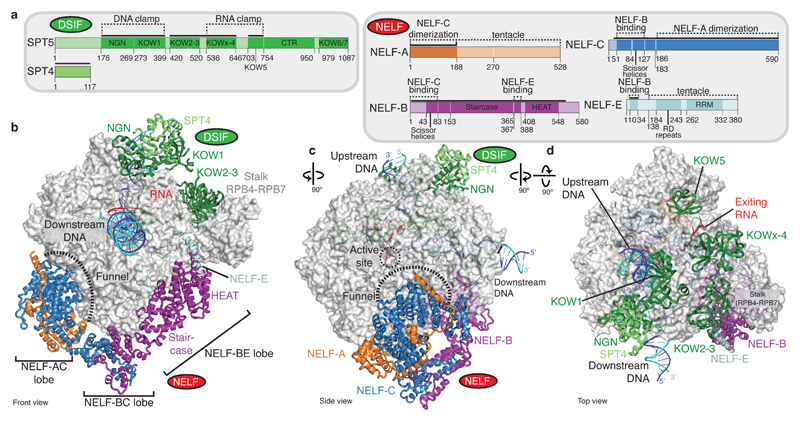
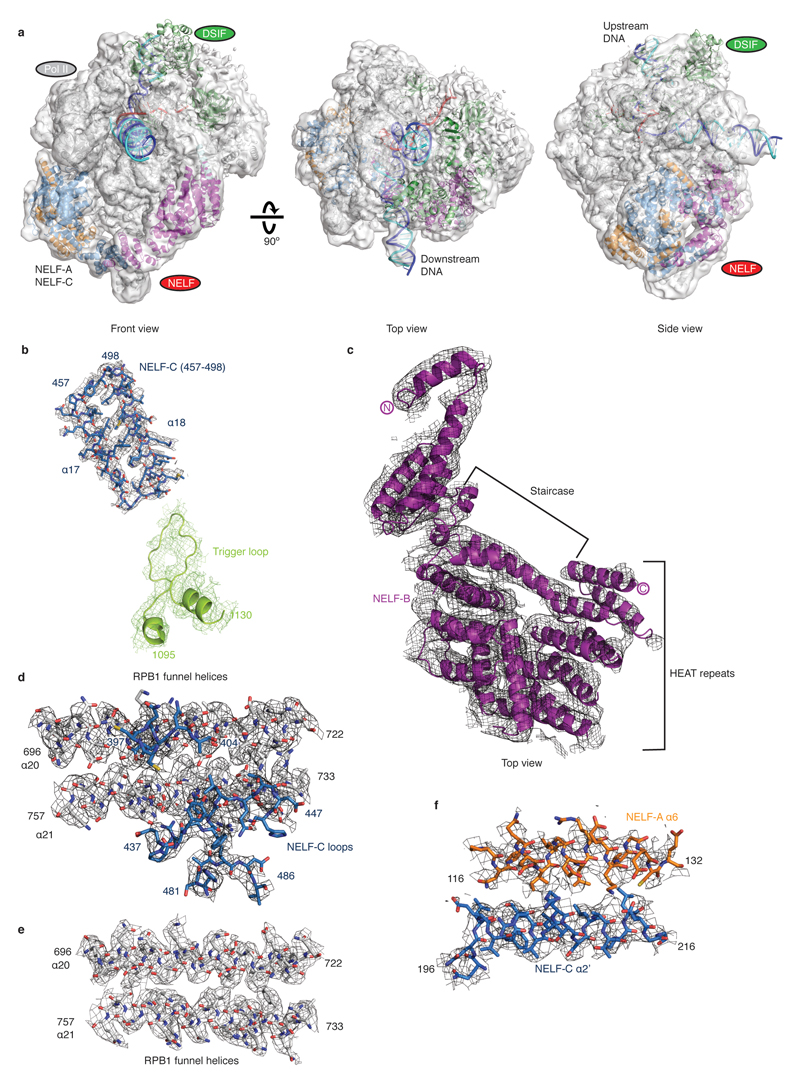
The cryo-EM structure was determined from 162,269 particles at a nominal resolution of 3.2 Å (Figure 2, Extended Data Fig. 3, Supplementary Video 1). The Pol II core extends to 3.0 Å resolution, whereas DSIF and NELF are resolved at local resolutions of ~3.5-8 Å (Extended Data Fig. 4, 5). We placed structures of Pol II, DSIF19, and the NELF-AC dimer21 into our densities and made minor adjustments (Methods). We then extended the NELF-C model by tracing into continuous density and modelled the helical subunit NELF-B into density with well-defined secondary structure (Supplementary Table 1). Density for NELF-E was largely lacking except for the N-terminal helix α1. The PEC structure was confirmed by chemical crosslinking (Methods, Extended Data Fig. 6, Supplementary Tables 2-3) and shows good stereochemistry (Extended Data Table 2).
Figure 2. Cryo-EM structure of the PEC.
a. Domain architecture of DSIF and NELF subunits. The colour code is used throughout. Solid black lines indicate modelled regions.
b-d. Cartoon model viewed from the Pol II front (b), side (c), and top (d). Pol II is shown as a silver surface, DSIF and NELF as ribbon models. The active site metal ion A is depicted as a magenta sphere. DNA template and non-template strands are in blue and cyan, respectively. RNA is red.
Tilting of the DNA-RNA hybrid
The PEC structure adopts the closed Pol II conformation that has been observed in other EC structures18 (Fig. 2). The Pol II structure is highly similar to the previous Pol II-DSIF EC structure19 with the exception of a ~10 Å movement in the flexible RPB4-RPB7 stalk and a slightly altered trajectory of upstream DNA. DSIF domains are arrayed around upstream DNA and exiting RNA, with minor movements of the KOW1 and NGN domains (Extended Data Fig. 7a). The downstream DNA and the DNA-RNA hybrid are very well defined, whereas only weak, uninterpretable density is observed for the TAR RNA hairpin.
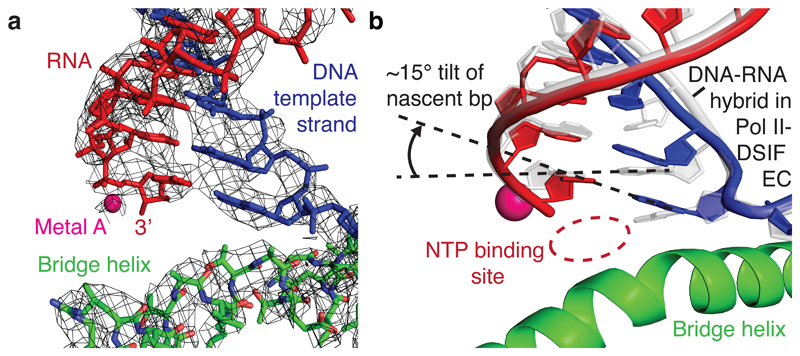
The DNA-RNA hybrid in the Pol II active site adopts a tilted conformation (Fig. 3, Supplementary Video 2). This unusual hybrid conformation has been previously observed in Pol II complexes containing backtracked RNA25 or short DNA-RNA hybrids26. The tilted conformation occurs in an off-line state that is not part of the productive nucleotide addition cycle. It may be adopted during transcription if the post-translocated state is unstable and the DNA, but not the RNA, slides backwards to the pre-translocation position while maintaining DNA-RNA base pairing. As a consequence, the RNA adopts a post-translocated position, whereas the DNA appears pre-translocated. The tilted state readily explains polymerase pausing because there is no free DNA template base in the active site that could bind the NTP by canonical base pairing (Fig. 3b). A tilted hybrid was also recently observed in paused bacterial ECs27,28 and thus likely underlies the fundamental paused state of cellular multi-subunit RNA polymerases.
Figure 3. Tilted DNA-RNA hybrid.
a. Cryo-EM density (grey mesh) for the DNA-RNA hybrid and bridge helix in the Pol II active site.
b. Comparison of tilted DNA-RNA hybrid in the PEC structure (blue/red) with the post-translocated hybrid in the previously solved Pol II-DSIF EC structure19 (grey).
NELF adopts a three-lobed structure
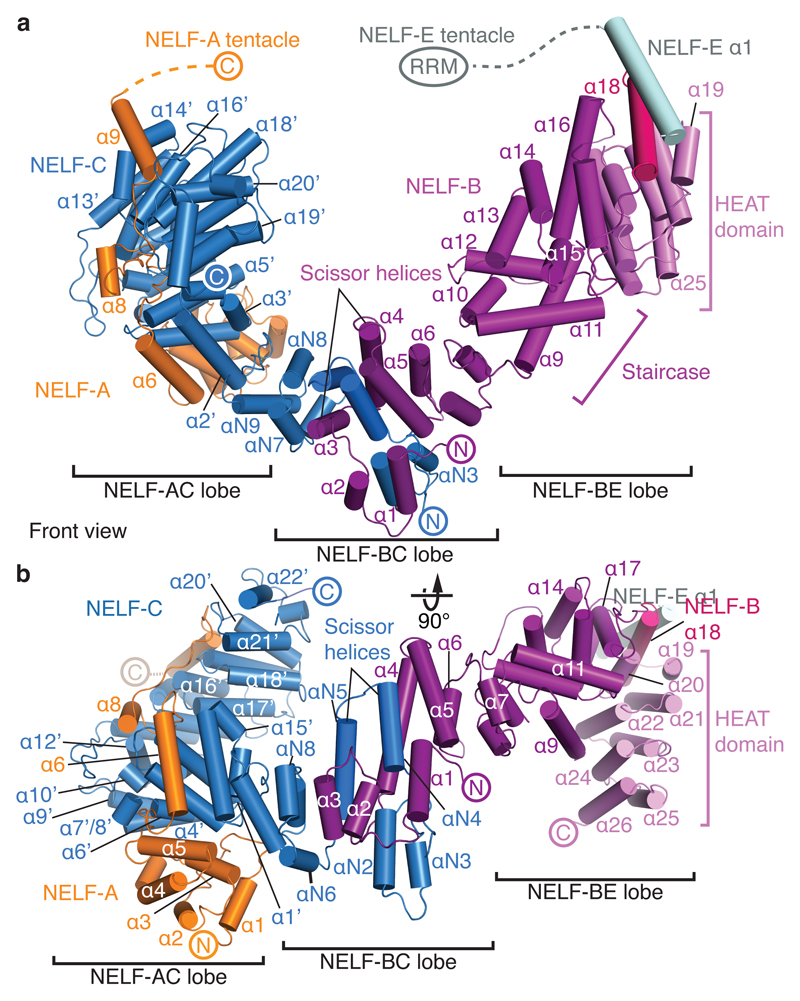
NELF forms a three-lobed structure that binds to Pol II on the face opposite of the cleft (Figs. 2, 4). One lobe is formed by the NELF-AC dimer (‘NELF-AC lobe’), which adopts a more open conformation relative to the free structure (Extended Data Fig. 7b). A second lobe (‘NELF-BC lobe’) is formed by the N-terminal regions of NELF-B (α1-α6) and NELF-C (αN1-αN9). This lobe comprises two pairs of helices formed by NELF-C (α4-α5) and NELF-B (α3-α4) that resemble open pairs of scissors (Fig. 4) and a four-helix bundle encompassing NELF-C αN2-αN3 and NELF-B α1-α2. A third lobe (‘NELF-BE lobe’) is formed by the NELF-B ‘staircase’ and ‘HEAT’ domains, and NELF-E helix α1, which lies between these NELF-B domains. The NELF-B staircase shares modest structural similarity with yeast Exportin 1 (residues 388-638) and the NELF-B HEAT domain comprises four canonical HEAT repeats (Methods).
Figure 4. NELF structure.
a. Three-lobed NELF structure adopted in the PEC. Helices are shown as cylinders. NELF domains and elements are indicated. The view corresponds to the front view in Fig. 2b.
b. The structure shown in a, but rotated by 90° around a horizontal axis.
The three lobes of NELF are well conserved21 (Supplementary Tables 4-5) from D. discoideum to human, suggesting that our structure is a good model for all NELF homologues. Most of NELF-B is nearly identical among vertebrates, whereas the HEAT domain shows some sequence divergence. The mobile C-terminal regions of NELF-A and NELF-E are less conserved21 (Supplementary Tables 4, 5). Taken together, the four NELF subunits interact extensively to form a compact three-lobed structure that is predicted to be highly stable and conserved.
NELF restrains Pol II mobility
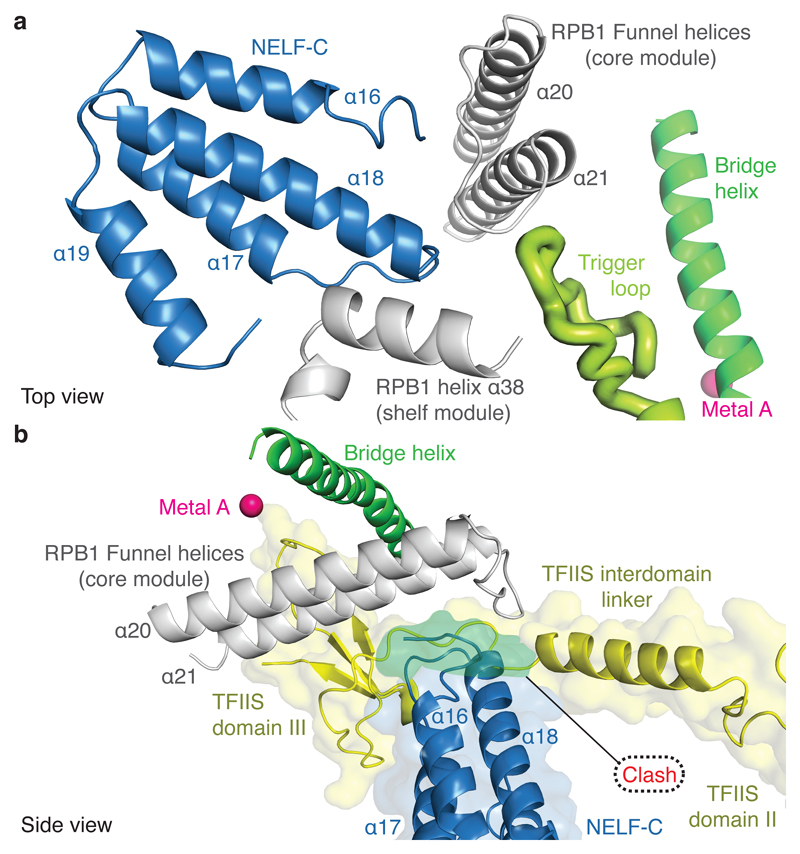
The NELF-AC lobe docks on the rim of the Pol II funnel that leads to the pore and the active site29 (Figs. 2, 5). The funnel and pore together are called the ‘secondary channel’ in bacterial polymerase30 and are suggested to provide an entry route for NTP substrates. On the rim of the funnel, NELF-A contacts RPB8, and NELF-C interacts with the RPB1 funnel helices (α20, α21) and the RPB1 cleft domain (α38) near the foot (Extended Data Fig. 8a, b). The NELF-Pol II interface is highly charged (Extended Data Table 3). The NELF-interacting polymerase regions reside in two different mobile modules of Pol II29. RPB8 and the RPB1 funnel domain reside in the core module, whereas the RPB1 cleft and foot domains reside in the shelf module. NELF binding to the funnel does not change the positions of the core and shelf modules compared to the Pol II-DSIF EC structure19. NELF binding is predicted to restrain the relative movement of these polymerase modules, which occurs during Pol II reactivation from an arrested state25,31 (Extended Data Fig. 9a).
Figure 5. NELF restricts Pol II mobility.
a. The NELF-AC dimer bridges the Pol II core and shelf modules. The loop connecting NELF-C helices 17 and 18 contacts the open trigger loop (light green).
b. NELF sterically impairs TFIIS binding. A human Pol II-TFIIS structure (PDB ID 5IYC)44 was superimposed onto the PEC structure by matching the Pol II core modules. TFIIS is shown in yellow. The clashing region is shown in green.
The NELF-AC lobe additionally contacts the open Pol II trigger loop (Fig. 5a). In particular, a loop connecting NELF-C helices α17 and α18 lies in close proximity to the tip of the open trigger loop (Extended Data Fig. 5b, 8c). The trigger loop is a highly conserved element of the polymerase active site that generally adopts an open, mobile conformation but folds and closes over the incoming NTP for catalytic RNA chain extension32,33. Although the observed contact is not extensive, it could impair trigger loop closure and catalysis.
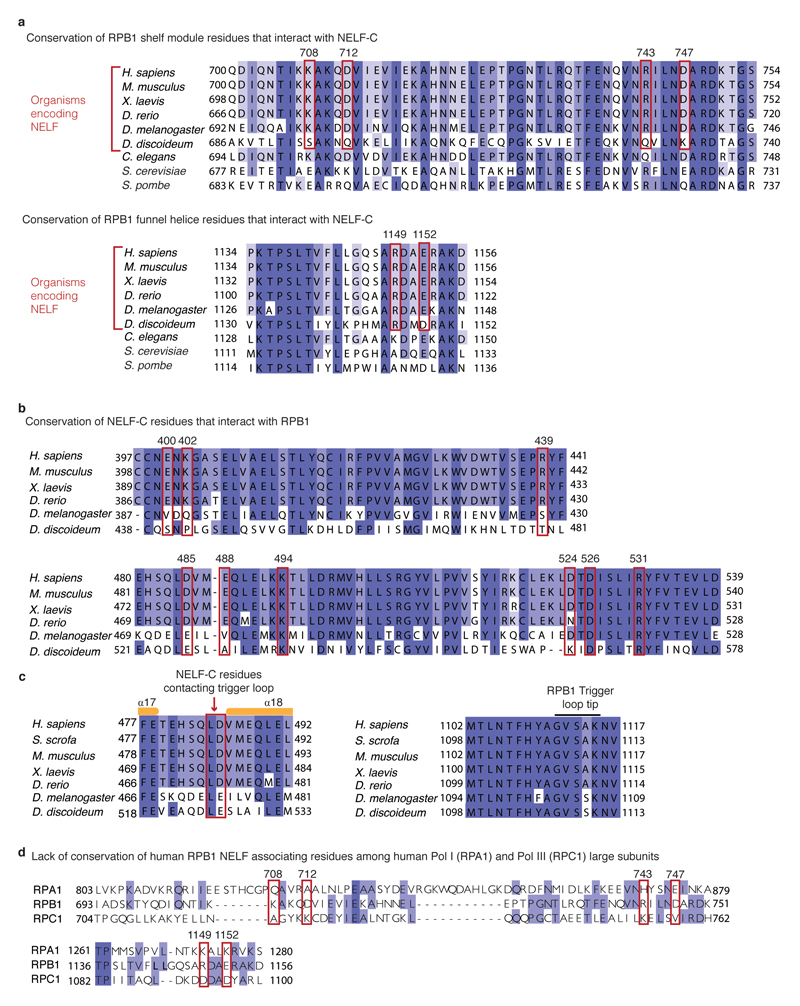
The NELF-BC lobe does not associate with Pol II, whereas the NELF-BE lobe forms a few contacts. The NELF-B staircase domain contacts Pol II subunits RPB5 and RPB6. NELF-B helix α13 interacts with a negatively charged loop in the RPB5 jaw domain (loop β1-β2). NELF-B helices α23-α26 in the HEAT domain reside near the RPB6 N-terminal region. The NELF-E helix α1 lies adjacent to the base of the outer Pol II clamp. Generally, Pol II regions contacted by NELF do not appear to be conserved in Pol I and Pol III, indicating that NELF function is specific to Pol II (Extended Fig. 8d). Taken together, NELF interacts with Pol II via two of its three lobes. The NELF-AC lobe specifically forms contacts with the Pol II funnel and trigger loop that restrain Pol II mobility and likely stabilizes the tilted conformation of the hybrid and thus the paused state.
Two NELF ‘tentacles’ reach DSIF and RNA
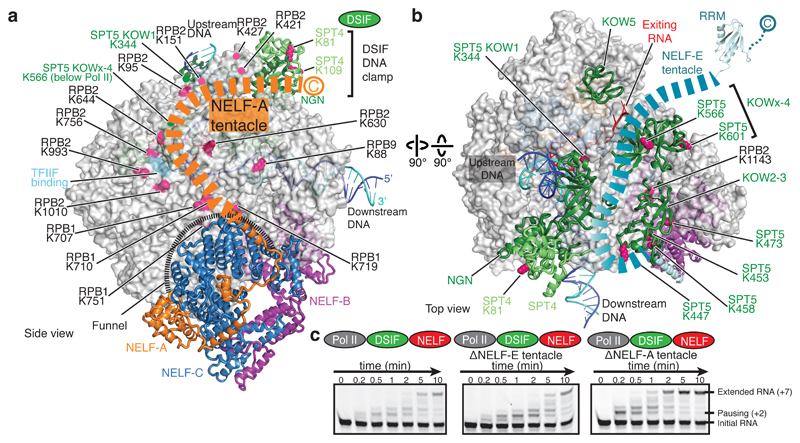
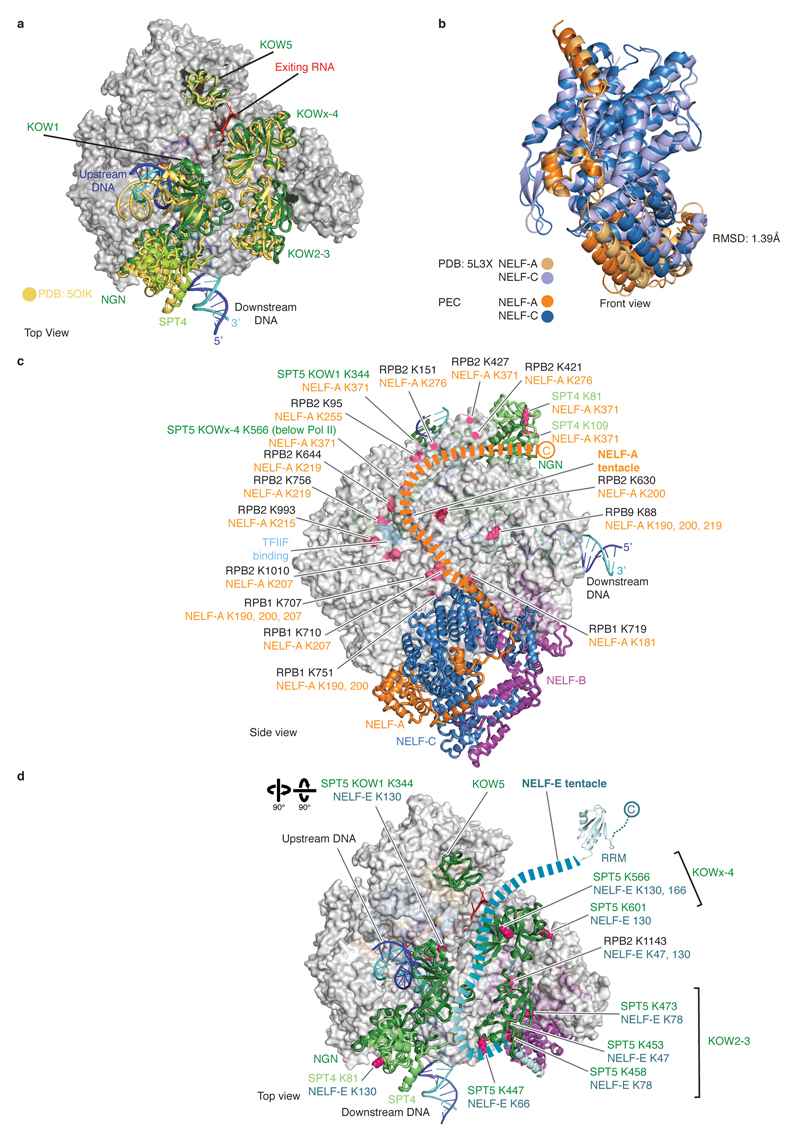
Two mobile regions extend from the NELF body and contact DSIF (Fig. 6), potentially explaining why NELF function requires DSIF7,8. We refer to these two extensions as the ‘NELF-A tentacle’ (residues 189-528) and the ‘NELF-E tentacle’ (residues 139-363). Weak density (not shown) and crosslinking data indicate that the NELF-A tentacle extends from the NELF-AC lobe along the RPB2 protrusion to reach the DSIF DNA clamp, in particular SPT4 and the SPT5 NGN domain (Fig. 6a, Extended Data Fig. 7c). The NELF-A tentacle is important for Pol II binding8 and overlaps with a region of TFIIF that binds this surface of Pol II34. Additionally, crosslinking data suggest that the NELF-E tentacle extends from helix α1 across the DSIF KOW2-3 and KOWx-4 domains towards exiting RNA (Fig. 6b, Extended Data Fig. 7d).
Figure 6. NELF tentacles reach DSIF and RNA.
a. NELF-A tentacle. Residues 189-528 of NELF-A form a flexible tentacle that binds Pol II and DSIF. Lysine crosslinking sites are marked.
b. NELF-E tentacle. Residues 139-363 of NELF-E form a flexible tentacle that extends over DSIF near exiting RNA.
c. The NELF-A tentacle, but not the NELF-E tentacle, is required for pause stabilization. RNA extension assays performed as in Fig. 1. All experiments were performed at least three times. Quantification of gels can be found in Extended Data Fig. 1f.
To test whether the NELF tentacles function in pause stabilization, we prepared truncated NELF variants and performed RNA extension assays on the pause assay scaffold and the HIV-1 transcription scaffold (Methods). A variant lacking the NELF-A tentacle could not stabilize the pause, whereas a variant lacking the NELF-E tentacle was functional (Fig. 6c, Extended Data Fig. 1f, 2d, e). Thus, the NELF-A tentacle is required for NELF function in pause stabilization, consistent with published data8, whereas the NELF-E tentacle is not. The NELF-E tentacle encompasses the RRM domain, which is not required for Pol II association35, but can bind RNA hairpins36. RNA hairpin structures are enriched at strong pause sites37, but RNA binding by NELF is not required for pausing38. Thus, the NELF-E tentacle is not required for pausing but may bind nascent RNA to help recruit NELF to pause sites.
NELF impairs TFIIS binding
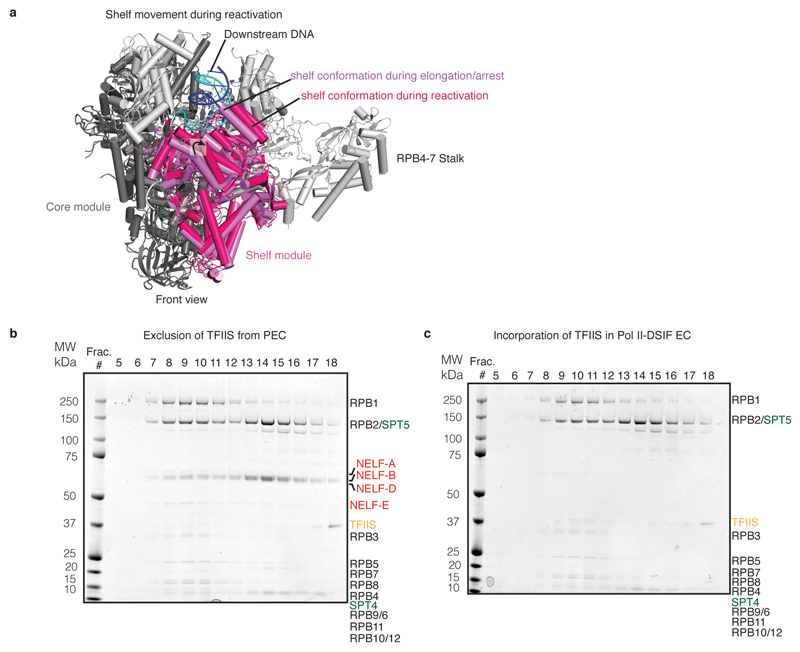
Transcriptional pausing involves polymerase stalling but can additionally involve backtracking of polymerase on DNA and RNA39. Rescue of backtracked Pol II requires TFIIS, which stimulates cleavage of the nascent RNA 3’-end40. Regions of the genome that are prone to backtracking are also susceptible to promoter-proximal pausing and require TFIIS for pause release41,42. Since DSIF and NELF were reported to inhibit TFIIS-stimulated RNA cleavage43, we compared our PEC structure with previous Pol II-TFIIS structures31,44. Superposition shows that the location of the NELF-AC lobe is incompatible with TFIIS binding to the Pol II funnel (Fig. 5b). In particular, NELF is predicted to impair entry of the TFIIS interdomain linker between the polymerase core and shelf modules. We therefore tested whether TFIIS could bind the PEC in vitro. TFIIS was unable to form a complex with the PEC, although TFIIS readily bound the Pol II-DSIF EC (Extended Data Fig. 9b, c). These data show that binding of NELF and TFIIS to the funnel is mutually exclusive and suggest that NELF impairs TFIIS-mediated reactivation of Pol II.
Discussion
Here we formed a paused Pol II-DSIF-NELF elongation complex (‘PEC’) and resolved its structure. The PEC structure contains a tilted DNA-RNA hybrid that is incompatible with binding of the NTP substrate. It also unveiled that NELF comprises three structured lobes and two flexible tentacles that approach DSIF and exiting RNA. Our results suggest five possible mechanisms that NELF may use to stabilize pausing allosterically, i.e. without reaching the Pol II active site. First, binding of NELF along the Pol II funnel restricts movements of the two major polymerase modules, core and shelf, which may stabilize the tilted state of the hybrid. Second, NELF restricts the funnel and may therefore interfere with NTP diffusion into the funnel and reduce substrate delivery to the active site. Third, NELF contacts the open trigger loop, which may hinder its closure and nucleotide addition. Fourth, NELF interferes with TFIIS binding, thus impeding reactivation of Pol II by TFIIS, which involves movement of the shelf module with respect to the core module25,31. Finally, NELF could sterically or allosterically block binding of other positive elongation factors.
Together with published results, our data suggest that the nature of the paused state is likely the same for all multi-subunit cellular RNA polymerases. Nucleic acid sequences that can lead to pausing are conserved from bacteria to human45,46, and a bacterial pause sequence can induce pausing of mammalian Pol II24. It was recently reported that paused bacterial polymerase complexes contain a tilted DNA-RNA hybrid27,28, as shown here for the mammalian PEC structure. These observations argue that the paused state is conserved. Pausing by bacterial and eukaryotic polymerases is, however, differentially influenced by flanking DNA sequences45,47,48. Some DNA sequences give rise to hairpins in nascent RNA that can be bound directly by bacterial RNA polymerase within the RNA exit tunnel27,28. In contrast, RNA hairpin binding by the Pol II exit tunnel is likely prevented by DSIF19. An RNA hairpin may however form on the Pol II surface near the RPB4-RPB7 stalk, where it could be bound by the NELF-E tentacle.
Promoter proximal pausing follows transcription initiation (Fig. 1d). Our results show that NELF can stabilize pausing only after initiation factors have been released. Modelling shows that the binding locations of DSIF and NELF on Pol II are shared with some initiation factors44. DSIF binding is incompatible with TFIIB and TFIIE, whereas NELF-A is likely mutually exclusive with TFIIF, explaining previous biochemical results49. After initiation factor dissociation, association of DSIF and NELF may not only stabilize the paused state but also prevent re-association of initiation factors. Taken together, our results establish how NELF associates with a paused Pol II-DSIF EC and how bound NELF can stabilize pausing. Understanding these interactions of NELF also help define how NELF can be dissociated when paused Pol II is activated for efficient elongation. In the accompanying paper50, we describe how NELF can be released and how an activated Pol II EC is formed.
Methods
Cloning and protein expression
DSIF was expressed in bacteria as described19. E. coli expressing DSIF were harvested by centrifugation, resuspended in Lysis 500 buffer (500 mM NaCl, 50 mM Na•HEPES pH 7.4, 10 % (v/v) glycerol, 50 mM imidazole pH 8.0, 1 mM DTT, 0.284 µg/mL leupeptin, 1.37 µg/mL pepstatin A, 0.17 mg/mL PMSF, and 0.33 mg/mL benzamidine), flash-frozen in liquid nitrogen, and stored at -80 °C until purification.
NELF was cloned and expressed as previously described21. The construct contains NELF-D, which is identical to NELF-C but lacks the first nine amino acid residues. For simplicity, NELF-C numbering is used throughout the manuscript, unless otherwise stated. The NELF tentacle variants (NELF-A 1-188 and NELF-E 1-138) were cloned by round the horn site directed mutagenesis and incorporated into a single bacculovirus expression vector containing the remaining 3 subunits by ligation independent cloning51. Sf9 (ThermoFisher), Sf21 (Expression Systems, Davis, CA, USA), and Hi5 (Expression Systems, Davis, CA, USA) cell lines were not tested for mycoplasma contamination and were not authenticated in-house. Hi5 cells expressing NELF were harvested by centrifugation, resuspended in Lysis buffer (300 mM NaCl, 20 mM Na•HEPES pH 7.4, 10% (v/v) glycerol, 30 mM imidazole pH 8.0, 1 mM DTT, 0.284 µg/mL leupeptin, 1.37 µg/mL pepstatin A, 0.17 mg/mL PMSF, and 0.33 mg/mL benzamidine), flash-frozen, and stored at –80 °C until purification.
Human TFIIS was produced as a codon optimized gBlock for E. coli expression (Integrated DNA Technologies). The gBlock was cloned into a modified pET28b vector bearing an N-terminal His6-MBP tag followed by a tobacco etch virus (TEV) protease cleavage site (1C vector, Addgene 29654). Two mutations were introduced by round the horn site directed mutagenesis to prevent stimulation of RNA cleavage by Pol II (D282A/E283A). TFIIS was overexpressed in E. coli BL21 (DE3) RIL cells (Merck) grown in LB medium. Cells were grown at 37°C until reaching OD600 ~0.6. The temperature was decreased to 18°C and protein expression was induced by adding 0.5 mM β-D-1-thiogalactopyranoside (IPTG). Cells were grown for an additional 16 h at 18°C and were harvested by centrifugation, resuspended in A800 (800 mM NaCl, 20 mM Tris-HCl pH 7.9, 10% (v/v) glycerol, 30 mM imidazole pH 8.0, 1 mM DTT, 0.284 µg/mL leupeptin, 1.37 µg/mL pepstatin A, 0.17 mg/mL PMSF, and 0.33 mg/mL benzamidine), flash-frozen in liquid nitrogen, and stored at -80 °C.
Protein purification
All protein purification steps were performed at 4 °C unless otherwise stated. Pol II was isolated from S. scrofa thymus (obtained from Eckhard Wolf, LMU, Munich) essentially as described52. A final size exclusion step was performed using a Sephacryl S-300 16/60 column (GE Healthcare Life Sciences) equilibrated in 150 mM NaCl, 10 mM Na•HEPES pH 7.25, 10 µM ZnCl2, and 10 mM DTT. Peak fractions containing Pol II were concentrated in 100 kDa MWCO Amicon Ultra Centrifugal Filters (Merck), aliquoted, flash-frozen in liquid nitrogen, and stored at -80 °C. The typical yield of Pol II from 1 kg of pig thymus was 5-7 mg.
DSIF was purified from 6-8 L of E. coli. Cell pellets were lysed by sonication, and cleared by centrifugation. The clarified lysate was filtered through a 0.8 µm syringe filter and applied to a 5 mL HisTrap HP column (GE Healthcare Life Sciences) equilibrated in Lysis 500 buffer. The column was washed with 10 CV of Lysis 500 buffer, followed by 3 CV of High salt buffer (1000 mM NaCl, 50 mM Na•HEPES pH 7.4, 10% (v/v) glycerol, 50 mM imidazole pH 8.0, and 1 mM DTT, 0.284 µg/mL leupeptin, 1.37 µg/mL pepstatin A, 0.17 mg/mL PMSF, and 0.33 mg/mL benzamidine). The column was washed with 3 CV of Lysis 500 buffer and the protein was eluted over a gradient with a buffer containing 500 mM NaCl, 50 mM Na•HEPES pH 7.4, 500 mM imidazole pH 8.0, 10% (v/v) glycerol, and 1 mM DTT, 0.284 µg/mL leupeptin, 1.37 µg/mL pepstatin A, 0.17 mg/mL PMSF, and 0.33 mg/mL benzamidine. Peak fractions containing DSIF were pooled, mixed with 3C protease and dialyzed overnight in 7 kDa MWCO SnakeSkin dialysis tubing (Thermo Scientific) against Q buffer (300 mM NaCl, 50 mM Na•HEPES pH 7.4, 10% (v/v) glycerol, 30 mM imidazole pH 8.0, and 1 mM DTT). The protein was applied to a tandem HisTrap (5 mL)/HiTrap Q (5 mL) column (GE Healthcare Life Sciences) equilibrated in Q buffer to remove the 3C protease, the His tag, uncleaved protein, and protein lacking the acidic N-terminal region of SPT5. The tandem column was then washed with 5 CV of Q buffer after which the HisTrap column was removed. The HiTrap Q column was developed over a gradient with High Salt buffer. Peak fractions were pooled and protein purity was assessed by SDS-PAGE and Coomassie staining. Pure DSIF was concentrated with 50 kDa MWCO Amicon Ultra Centrifugal Filters (Merck) and applied to a HiLoad S200 16/600pg column equilibrated in 500 mM NaCl, 20 mM Na•HEPES pH 7.4, 10% (v/v) glycerol, and 1 mM DTT. Protein purity was assessed by SDS-PAGE and Coomassie staining. Pure fractions with full-length SPT5 were concentrated with 50 kDa MWCO Amicon Ultra Centrifugal Filters (Merck). Protein concentration was determined by measuring absorption at 280 nm and using the predicted extinction coefficient for the complex. Protein was aliquoted, flash-frozen, and stored at -80 °C. NELF was purified as previously described21.
TFIIS was purified from 6 L of E. coli BL21 (DE3) RIL cells. Cell pellets were lysed by sonication and cleared by centrifugation. Clarified lysates were applied to 5 mL HisTrap columns equilibrated in A800. The column was washed with A800 and A400 (400 mM NaCl, 20 mM Tris-HCl pH 7.9, 10% (v/v) glycerol, 30 mM imidazole pH 8.0, 1 mM DTT, 0.284 µg/mL leupeptin, 1.37 µg/mL pepstatin A, 0.17 mg/mL PMSF, and 0.33 mg/mL benzamidine) until no additional absorbance was detected at 280 nm. The protein was eluted from the nickel column by a gradient over 6 columns with buffer B400 (A400 with 500 mM imidazole pH 8.0). Peak fractions were assessed by SDS-PAGE followed by Coomassie staining. Fractions corresponding to TFIIS were pooled and mixed with TEV protease, and dialyzed overnight against buffer A400 in SnakeSkin dialysis tubing (7 kDa MWCO). The protein was removed from dialysis and applied to a 5 mL HisTrap column equilibrated in A400 to remove TEV protease, uncleaved protein, and the His6-MBP tag. The flow through was collected, concentrated in a 10 kDa MWCO Amicon Ultra Centrifugal Filter (Merck), and applied to a HiLoad S75 16/1600 pg column equilibrated in 400 mM NaCl, 20 mM Tris-HCl pH 7.9, 10% (v/v) glycerol, and 1 mM DTT. Protein purity was assessed by SDS-PAGE followed by Coomassie staining. Peak fractions were concentrated in 10 kDa MWCO Amicon Ultra Centrifugal Filter (Merck). The protein was stored in buffer containing 400 mM NaCl, 20 mM Tris-HCl pH 7.9, 30% (v/v) glycerol, and 1 mM DTT. The protein was aliquoted, flash-frozen in liquid nitrogen, and stored at -80 °C.
RNA extension assays
All oligos were purchased from Integrated DNA Technologies (IDT), resuspended in water (100 µM), flash-frozen in liquid nitrogen, and stored at -80 °C. Transcription assays were performed with perfectly complementary scaffolds. A previously described pausing sequence24 ‘pause assay scaffold’ with the following sequence was used for experiments in Figures 1 and 6: template DNA 5’-Biotin-TTT TTC CAC TGG AAG ATC TGA ATT TAC GGG CGC AAC TAT GCC GGA CGT ACT GAC C-3’, non-template DNA 5’-GGT CAG TAC GTC CGG CAT AGT TGC GCC CGT AAA TTC AGA TCT TCC AGT GG-3’, RNA 5’-6-FAM-UUU UUU GGC AUA GUU-3’. The scaffold contains 13 nts of upstream DNA, 28 nts of downstream DNA, a 9-base pair (bp) DNA•RNA hybrid, and 6 nts of exiting RNA bearing a 5’-6 FAM label (Extended Data Fig. 1). RNA and template DNA were mixed in equimolar ratios and were annealed by incubating the nucleic acids at 95º for 5 min and then decreasing the temperature by 1°C/min steps to a final temperature of 30 °C in a thermocycler in a buffer containing 100 mM NaCl, 20 mM Na•HEPES pH 7.4, 3 mM MgCl2, and 10% (v/v) glycerol. All concentrations refer to the final concentrations used in the assay. S. scrofa Pol II (75 nM) and the RNA•template hybrid (50 nM) were incubated for 10 minutes at 30 °C, shaking at 300 rpm. The NT DNA (50 nM) was added and the reactions were incubated for another 10 minutes. The reactions were then diluted to achieve final assay conditions of 100 mM NaCl, 20 mM Na•HEPES pH 7.4, 3 mM MgCl2, 4% (v/v) glycerol, and 1 mM DTT and were again incubated for 10 min. Factors were diluted in protein dilution buffer (150 mM NaCl, 20 mM Na•HEPES pH 7.4, 10% (v/v) glycerol and 1 mM DTT) and added to Pol II ECs at a concentration of 237 nM. Transcription reactions were initiated by adding GTP and CTP (10 µM) to permit elongation to position +7. Reactions (10 µL) were quenched after 0-10 min in 10 µL 2x Stop buffer (6.4 M urea, 50 mM EDTA pH 8.0, 1x TBE buffer). Samples were treated with 4 µg of proteinase K for 30 min at 30 °C (New England Biolabs) and were separated by denaturing gel electrophoresis (8 µL of sample applied to an 8 M urea, 1x TBE, 20% Bis-Tris acrylamide 19:1 gel run in 0.5x TBE buffer at 300V for 90 min). Products were visualized using the 6-FAM label and a Typhoon 9500 FLA Imager (GE Healthcare Life Sciences).
RNA extension experiments performed on the HIV-1 transcription scaffold (Extended Data Fig. 2a) were essentially performed as above with minor modifications. ECs were assembled on nucleic acid scaffolds bearing the following sequences: template DNA 5’-Biotin-TTT TCG GGC ACA CAC TAC GTC GAC GCA AGC TTT ATT GAG GCT TAA GCA GTG GGT TCC CTA GTT AAA GGT ACT AGT GTA C-3’, non-template DNA 5’-GTA CAC TAG TAC CTT TAA CTA GGG AAC CCA CTG CTT AAG CCT CAA TAA AGC TTG CGT CGA CGT AGT GTG TGC CCG-3’, RNA 5’-6-FAM-ACC AGA UCU GAG CCU GGG AGC UCU CUG GCU AAC UAG GG -3’. The scaffold contains 15 bps of upstream DNA, 51 bps of downstream DNA, a 9 bp RNA•DNA hybrid, and 29 bases of exiting RNA including the TAR element. DSIF and NELF variants were added at a final concentration of 300 nM. NTPs (ATP, UTP, CTP, and GTP) were added at a final concentration of 0.5 mM. RNA products were separated by denaturing gel electrophoresis (8 µL of sample applied to an 8 M urea, 1x TBE, 15% Bis-Tris acrylamide 19:1 gel run in 0.5x TBE buffer at 300V for 60 min).
Gel images were quantified using ImageJ version 1.48v53. The integrated density of the elongated product was measured using a box size of 0.35x0.15 cm. All integrated density values were normalized by subtracting the background integrated density from each elongated product. Graphs were prepared in GraphPad Prism version 6. Each bar or point represents the mean intensity from 3 individual replicates. Error bars reflect the standard deviation between the replicates. Source data for all gel quantification can be found in Supplementary Table 6.
We observe extension from a fraction of the input RNA molecules. We attribute this to inefficient EC assembly on the perfectly complementary scaffolds. It was previously shown that only 10-50 % of yeast Pol II molecules successfully assemble on perfectly complementary scaffolds54,55,56 due to NT DNA displacement of the RNA primer56. Others have resolved the problem of displaced RNA primer by incorporating radioactive NTPs or by immobilizing NT DNA containing complexes on beads. We chose to perform RNA extension experiments in bulk with a fluorescently labelled RNA to maintain consistent Pol II concentrations across experiments and reproducibility in time course experiments.
Sample preparation for cryo-EM
ECs were formed on a bubble scaffold with the following nucleic acid sequence: template DNA 5’- GGC AAG CTT TAT TGA GGC TTA AGC AGT GGG TTC CAG GTA CTA GTG TAC-3’, non-template DNA 5’- GTA CAC TAG TAC CTA CTC GAG TGA GCT TAA GCC TCA ATA AAG CTT GCC -3’, and RNA 5’ 6-FAM- ACC AGA UCU GAG CCU GGG AGC UCU CUG GCU AAC UAG GGA ACC CAC U-3’. The scaffold contains 10 bp RNA•DNA hybrid, 36 nts of exiting RNA, 10 nt bubble, 14 nts upstream DNA and 24 nts of downstream DNA. Pol II ECs were formed as described for the transcription assays (112 pmol final Pol II, 168 pmol RNA•DNA template, 300 pmol NT DNA). DSIF and NELF were added in a 4-fold molar excess relative to Pol II in a final buffer containing 100 mM NaCl, 20 mM Na•HEPES pH 7.4, 3 mM MgCl2, 1 mM DTT, and 4% (v/v) glycerol. The sample was incubated for 30 minutes at 30 °C and applied to a Superose 6 increase 3.2/300 column equilibrated in complex buffer at 4 °C (100 mM NaCl, 20 mM Na•HEPES pH 7.4, 4% (v/v) glycerol, 3 mM MgCl2, and 1 mM DTT). Peak fractions were analysed by SDS-PAGE followed by Coomassie staining.
The peak fraction corresponding to the complex was crosslinked with 0.1% (v/v) glutaraldehyde for 10 minutes on ice and quenched with 8 mM aspartate and 2 mM lysine. The crosslinked sample was dialyzed against a buffer containing 100 mM NaCl, 20 mM Na•HEPES pH 7.4, 20 mM Tris-HCl pH 7.5, 1 mM DTT, and 3 mM MgCl2, in 20 kDa MWCO Slide-A-Lyzer MINI Dialysis Unit for 6 hrs at 4 °C. Dialyzed sample at a final concentration of 170-200 nM was applied to R2/2 gold grids (Quantifoil). The grids were glow discharged for 45 s before applying 2 µL of sample to each side of the grid (4 µL total). After incubation for 10 s and blotting for 8.5 s, the grid was vitrified by plunging it into liquid ethane with a Vitrobot Mark IV (FEI Company) operated at 4 °C and 100% humidity.
Cryo-EM data collection and data processing
Cryo-EM data of the PEC were collected on a FEI Titan Krios II transmission electron microscope operated at 300 keV. A K2 summit direct detector (Gatan) with a GIF quantum energy filter (Gatan) was operated with a slit width of 20 eV. Automated data acquisition was performed with FEI EPU software at a nominal magnification of 165,000x, corresponding to a pixel size of 0.81 Å/pixel. Image stacks of 36 frames were collected over 9 s in counting mode. The dose rate was 5.1 e- per Å2 per s for a total dose of 45.9 e- /Å2. A total of 11,740 image stacks were collected.
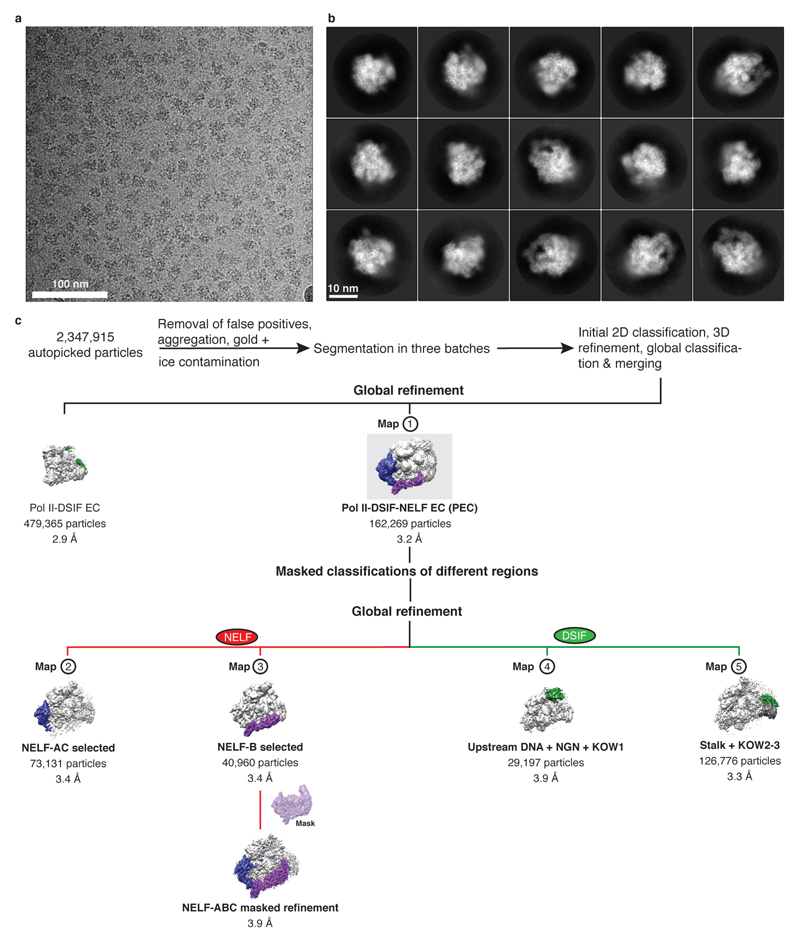
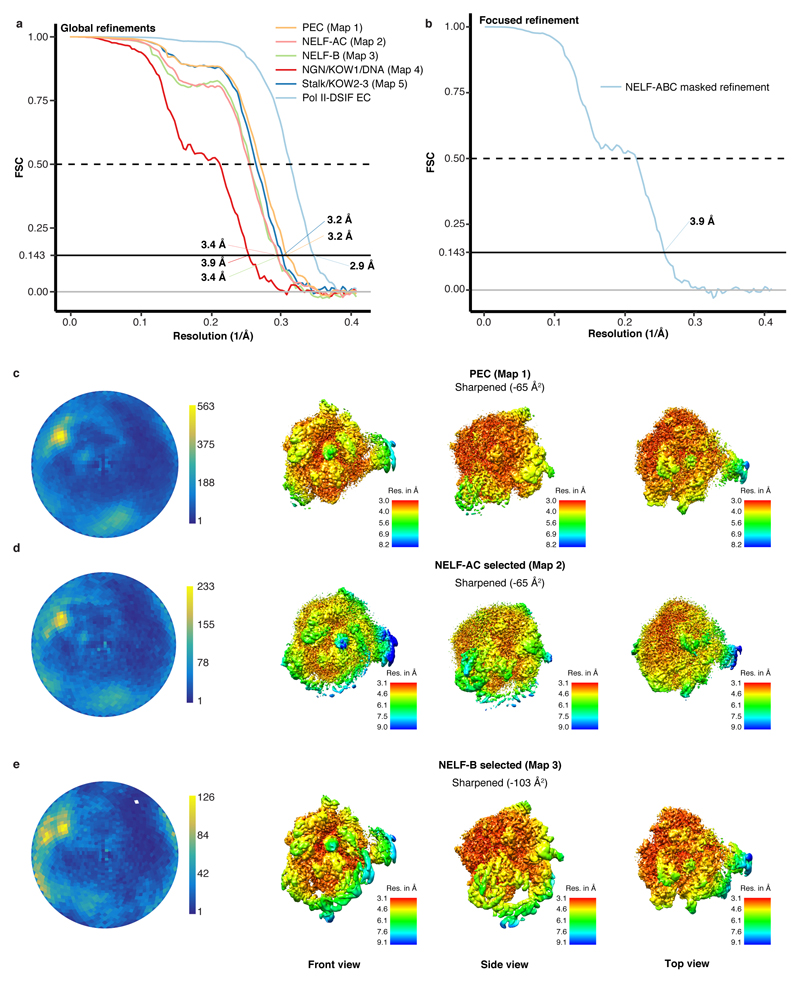
Frames were stacked, CTF corrected, and dose-weighted using an in-house solution (D. Tegunov and P. Cramer, in preparation). The data were binned to a pixel size of 1.2277 Å/pixel. Image processing was performed with RELION 2.157,58. Particles were auto-picked using 20 Å low-pass filtered projections of an initial reconstruction yielding 2,347,915 particle images. Particles were extracted using a box size of 2562 pixels, and normalized. The data set was segmented in three batches. Each batch was subsequently screened using iterative rounds of reference-free 2D classification. A cryo-EM reconstruction of the EC-DSIF complex (EMDB entry 3819)19 was low pass filtered to 50 Å, used for 3D refinement and hierarchical 3D-classification with image alignment. We obtained a EC-DSIF bound class which contained 479,365 particles and resulted in a reconstruction at 2.9 Å resolution indicating the high quality of the raw data (Extended Data Fig. 3, 4). The best resolved NELF-bound classes from each batch were selected and combined resulting in 162,269 particles. The combined particles were subjected to 3D refinement using a 30 Å low pass filtered map from a previous 3D-refinement resulting in a reconstruction with a resolution of 3.2 Å (Map 1). Some domains were not well resolved in the reconstruction, so 3D classifications without image alignment were performed around the regions of interest by applying soft masks. Masks were generated in Chimera59 and RELION 2.1 around NELF-AC (Map 2, 3.4 Å), NELF-B (Map 3, 3.4 Å), upstream DNA, NGN, and KOW1 (Map 4, 3.9 Å) subunits/domains, and the stalk and KOW2-3 (Map 5, 3.3 Å). Particles containing the desired densities were subjected to global 3D refinement. To further improve densities, a masked refinement was used for NELF-B. The masked refinement was performed by using final alignments from previous global refinements with local searches and by applying soft masks to the region of interest. The masked refinement performed on NELF-ABC resulted in a resolution of 3.9 Å with an applied B-factor of -160.984 Å2. Post-processing of refined models was performed using automatic B-factor determination in RELION and reported resolutions are based on the gold-standard FSC 0.143 criterion60 (applied B-factors (Å2): Map 1: -65, Map 2: -65, Map 3: -103, Map 4: -71, Map 5: -68). Local resolution estimates were determined using the built-in local resolution estimation tool of RELION using the previously estimated B-factors61.
Model building
The structure of the PEC was built by first placing the structure of RNA polymerase II from EC* manually into the density50. Adjustments were made to the protein sequence, DNA sequence, and positioning of the upstream DNA in Coot62. The human RPB4-7 crystal structure (PDB ID: 2C35)63 was placed into map 5 using Chimera.
Human DSIF from a previously solved cryo-EM structure (PDB ID: 5OIK)19 was subdivided into 5 regions for modeling, corresponding to the SPT5 NGN and SPT4, KOW1, KOW2-3, KOWx-4 and KOW5. KOW5 was placed into the globally refined map 1. SPT4, NGN domain, and KOW1 domain were placed in Map 4 by rigid body fitting in Chimera. The KOW2-3 and KOWx-4 were placed in Map 5 by rigid body fitting in Chimera.
Densities corresponding to each NELF subunit were observed. To generate a model for the NELF complex, the known crystal structure of the NELF-AC dimer (PDB ID: 5L3X)21 was flexibly fit into the globally refined density of Map 1 using VMD and MDFF64. The model was manually adjusted in Coot. The N-terminal part of NELF-C (51-185) was built de novo in Coot in the globally refined Map 1 using secondary structure prediction and the well-resolved helical densities that allowed placement of helices into the density.
A model for NELF-B was generated using de novo and homology modeling. Secondary structure predictions from Sable65 and Psipred66 were used to assist de novo modelling. Clear helical densities are observed for all helices predicted by Sable and Psipred. Alpha helices were generated using Coot and manually fitted into the density. Linkers between the helices were modeled where clear density was visible. A Robetta model of NELF-B (residues 438-548) was fit into Map 367. Crosslinking restraints and densities from bulky residues such as Arg and Tyr were used as additional sequence markers for NELF-B and the N-terminus of NELF-C. The Staircase domain (NELF-B 153-365) shares modest structural homology with yeast Exportin-1 alpha (RMSD 13.95Å, PDB 4HAX, Chain C, residues 388-638)68,69. NELF-B 408-548 is composed of 4 HEAT repeats68,70.
NELF-E is the least well-resolved subunit in our structure. We observe an additional helix immediately adjacent to the HEAT domain of NELF-B that cannot be assigned to NELF-B. Crosslinking data and secondary structure predictions assigned this helix to NELF-E residues 10-34. This assignment is consistent with biochemical experiments8.
The model was manually adjusted in Coot62 and refined with phenix.real_space_refine against a sharpened version of Map 3. The final model has 94.06 % of residues in most-favored regions of the Ramachandran plot according to Molprobity71. The structure has a Molprobity score of 1.79. Figures were generated in Pymol (Schrödinger LLC, version 1.8.6.0) and UCSF Chimera (version 1.10.2).
Analytical gel filtration
Pol II ECs were formed on the same scaffold as was used for cryo-EM (25 pmol final Pol II, 50 pmol RNA•DNA template, 100 pmol NT DNA). DSIF and NELF were added in a 3 molar excess relative to Pol II, whereas TFIIS was added in a 11 molar excess in a final buffer containing 100 mM NaCl, 20 mM Na•HEPES pH 7.4, 3 mM MgCl2, 1 mM DTT, and 4% (v/v) glycerol. Reactions were incubated for 30 minutes at 30 °C. Samples were applied to a Superose 6 increase 3.2/300 column equilibrated in complex buffer (100 mM NaCl, 20 mM Na•HEPES pH 7.4, 4% (v/v) glycerol, 3 mM MgCl2, and 1 mM DTT). Peak fractions were analyzed by SDS-PAGE followed by Coomassie staining.
Sample preparation for crosslinking mass spectrometry
Samples for crosslinking mass spectrometry were performed essentially in the same way as those for cryo-EM. A nucleic acid scaffold that differs by two nucleotide bases from the scaffold used for cryo-EM was used (template DNA 5’- GGC AAG CTT TAT TGA GGC TTA AGC AGT GGG TTC AAG GTA CTA GTG TAC-3’, non-template DNA 5’- GTA CAC TAG TAC CTA CTC GAG TGA CCT TAA GCC TCA ATA AAG CTT GCC-3’, RNA sequence is identical). Fractions containing the PEC were pooled and mixed with 2 mM of bis(sulfosuccinimidyl)suberate (BS3) dissolved in complex buffer (No Weigh Format, ThermoFisher Scientific). The protein was incubated for 30 min at 30 °C. The crosslinking reaction was quenched by adding 100 mM Tris-HCl pH 7.5 and 20 mM ammonium bicarbonate (final concentrations). The quenching reaction was incubated for 15 min at 30 °C. The protein was precipitated with 300 mM Na•Acetate pH 5.2 and 4 volumes of acetone and incubated overnight at -20 °C, pelleted by centrifugation, briefly dried, and resuspended in 4 M urea and 50 mM ammonium bicarbonate.
Crosslinking mass spectrometry
Crosslinked proteins were reduced with 10 mM DTT for one hour at room temperature (RT). Alkylation was performed by adding iodoacetamide to a final concentration of 40 mM, incubated 30 min in the dark at RT. After dilution to 1 M urea with 50 mM ammonium bicarbonate (pH 8.0), the cross-linked protein complex was digested with trypsin in a 1:50 enzyme-to-protein ratio at 37°C overnight. Peptides were acidified with trifluoroacetic acid (TFA) to a final concentration of 0.5% (v/v), desalted on MicroSpin columns (Harvard Apparatus) following manufacturer’s instructions and vacuum-dried. Dried peptides were dissolved in 50 µL 30% acetonitrile (ACN)/0.1% TFA and peptide size exclusion (pSEC, Superdex Peptide 3.2/300 column on an ÄKTAmicro system, GE Healthcare) was performed to enrich for cross-linked peptides at a flow rate of 50 µL/min. Fractions of 50 µL were collected. Fractions containing the cross-linked peptides (1–1.7 mL) were vacuum-dried and dissolved in 2% ACN/0.05% TFA (v/v) for LC-MS/MS analysis.
Cross-linked peptides derived from pSEC were analyzed as technical duplicates on an Orbitrap Fusion and Orbitrap Fusion Lumos Tribrid Mass Spectrometer (Thermo Scientific), respectively, coupled to a Dionex UltiMate 3000 UHPLC system (Thermo Scientific) equipped with an in house-packed C18 column (ReproSil-Pur 120 C18-AQ, 1.9 µm pore size, 75 µm inner diameter, 30 cm length, Dr. Maisch GmbH). Samples were separated applying the following 58 min gradient: mobile phase A consisted of 0.1% formic acid (FA, v/v), mobile phase B of 80% ACN/0.08% FA (v/v). The gradient started at 5% B, increasing to 8% B on Fusion and 15% on Fusion Lumos, respectively, within 3 min, followed by 8–42% B and 15–46% B within 43 min accordingly, then keeping B constant at 90% for 6 min. After each gradient the column was again equilibrated to 5% B for 6 min. The flow rate was set to 300 nL/min. MS1 spectra were acquired with a resolution of 120,000 in the orbitrap (OT) covering a mass range of 380–1580 m/z. Injection time was set to 60 ms and automatic gain control (AGC) target to 5×10⁵. Dynamic exclusion covered 10 s. Only precursors with a charge state of 3–8 were included. MS2 spectra were recorded with a resolution of 30,000 in OT, injection time was set to 128 ms, AGC target to 5×10⁴ and the isolation window to 1.6 m/z. Fragmentation was enforced by higher-energy collisional dissociation (HCD) at 30%.
Raw files were converted to mgf format using ProteomeDiscoverer 1.4 (Thermo Scientific, signal-to-noise ratio 1.5, 1000–10000 Da precursor mass). For identification of cross-linked peptides, files were analyzed by pLink (v. 1.23, pFind group72 using BS3 as cross-linker and trypsin as digestion enzyme with maximal two missed cleavage sites. Carbamidomethylation of cysteines was set as a fixed modification, oxidation of methionines as a variable modification. Searches were conducted in combinatorial mode with a precursor mass tolerance of 5 Da and a fragment ion mass tolerance of 20 ppm. The used database contained all proteins within the complex. FDR was set to 0.01. Results were filtered by applying a precursor mass accuracy of ±10 ppm. Spectra of both technical duplicates were combined. Crosslinking figures were made with XiNet73 and the Xlink Analyzer plugin in Chimera59,74. Distances between structured regions were calculated with Xlink Analyzer with a cutoff score of 5.
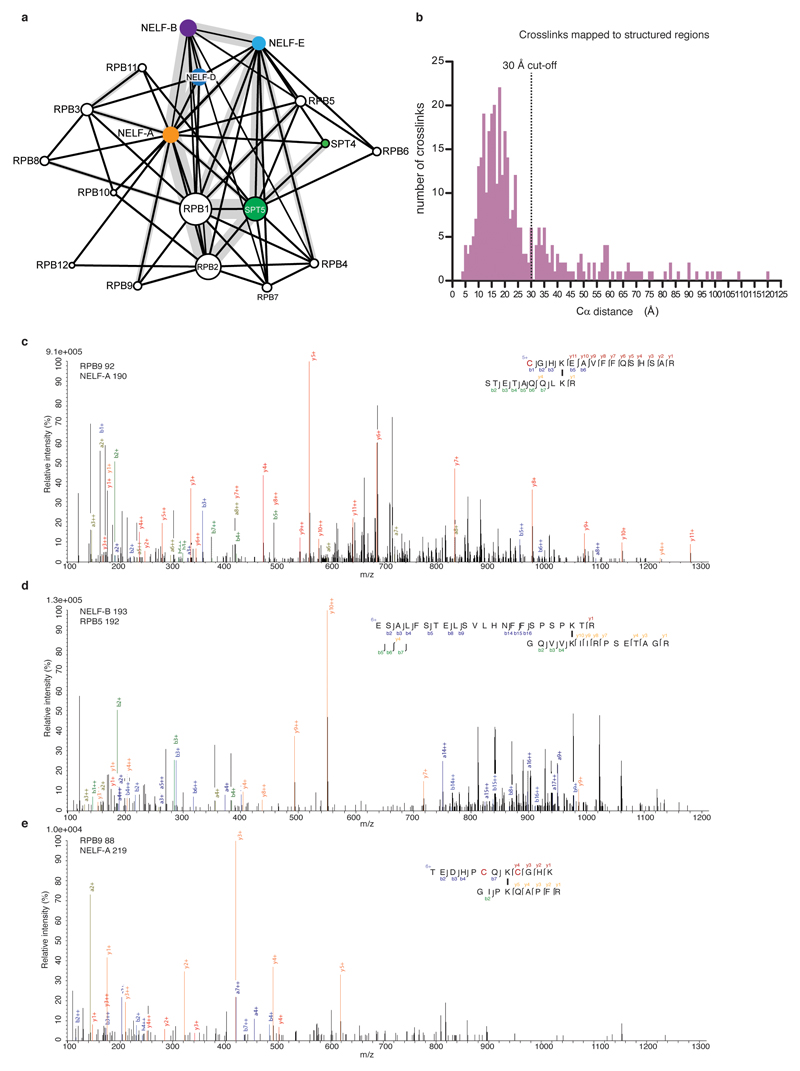
A total of 874 unique crosslinks were obtained of which 354 could be mapped onto our structure. 261 are located within the 30Å distance permitted by BS3 whereas the remaining 93 crosslinks primarily lie in flexible regions of NELF. The NELF crosslinks are highly similar to those obtained with the isolated NELF complex21.
Extended Data
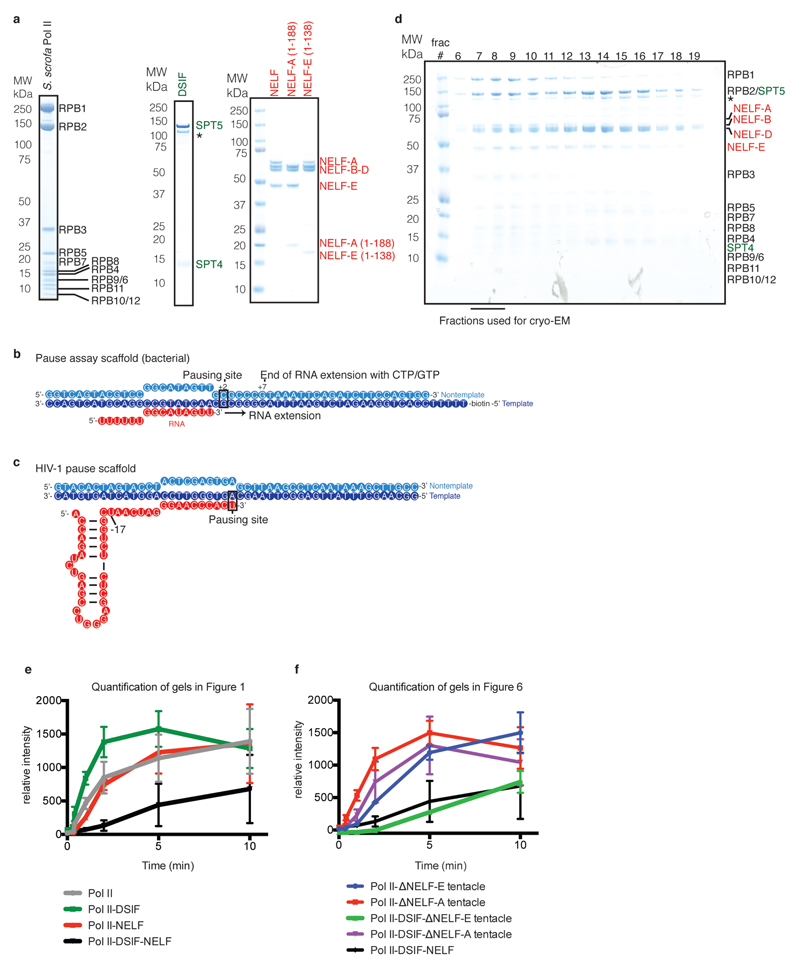
Extended Data Figure 1. Protein preparation and nucleic acid scaffold design.
a. Quality of purified proteins used in this study. Purified proteins (0.9 µg) were run on 4-12% SDS-PAGE and stained with Coomassie blue. A star demarcates SPT5 lacking an N-terminal region.
b. Nucleic acid scaffold used for RNA extension assays, ‘pause assay scaffold’. Template DNA is coloured in dark blue, non-template DNA is in light blue, and RNA is in red.
c. Nucleic acid scaffold used for binding experiments and for cryo-EM analysis, ‘HIV-1 pause scaffold’. Coloured as in b.
d. SDS-PAGE analysis of size exclusion fractions. Fractions used for cryo-EM analysis marked.
e. Quantification of RNA extension assays shown in Figure 1. The amount of elongated product was measured for each time point. Points are the mean of three independent experiments and error bars represent the standard deviation between experiments.
f. Quantification of RNA extension assays shown in Figure 6. The amount of elongated product was measured for each time point. Points are the mean of three independent experiments and error bars represent the standard deviation between experiments.
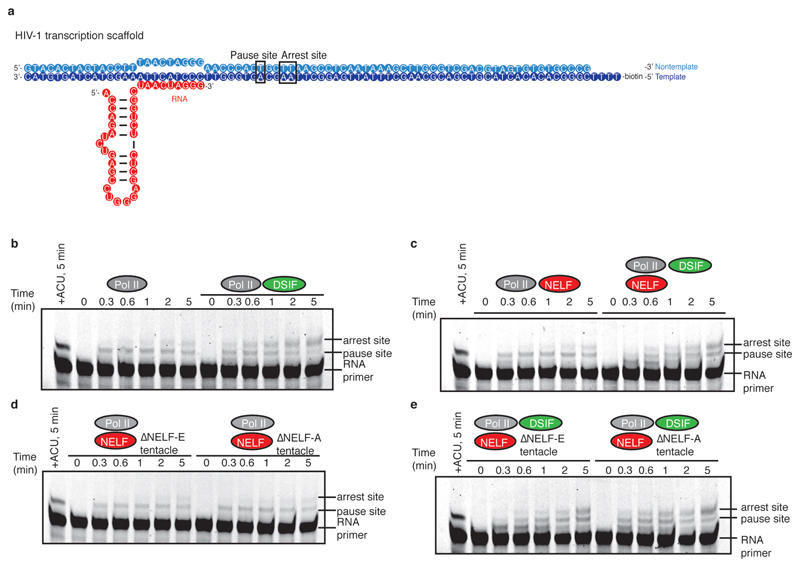
Extended Data Figure 2. RNA extension assays on HIV-1 nucleic acid scaffold.
a. HIV-1 nucleic acid scaffold used for RNA extension assays. The sequence is slightly altered from that used for cryo-EM to allow extension for 8 bases prior to pausing. Known pause and arrest sites are marked on the sequence.
b-e. Pol II ECs (75 nM) were reconstituted on the HIV-1 transcription scaffold (50 nM). A single reaction was incubated with ATP, CTP, and UTP (0.5 mM) for 5 minutes to indicate the pause site (far right lane). Buffer (b), DSIF (b), NELF (c), DSIF and NELF (c), NELF tentacle mutants (d), or DSIF and NELF tentacle mutants (e) (300 nM) were incubated with the Pol II EC. NTPs were added (0.5 mM) and aliquots were taken at specific time points. Only a fraction of the starting RNA is successfully elongated due to incomplete EC formation (see Methods for more information).
Extended Data Figure 3. Cryo-EM data collection and processing.
a. Representative micrograph of PEC data collection shown at a defocus of -2.5 µm. The micrograph is representative of 11,740 micrographs.
b. Representative 2D classes of PEC particles.
c. Classification tree for data processing. Numbers used to identify each map are shown above the corresponding map.
Extended Data Figure 4. Quality of cryo-EM data.
a-b. Estimation of average resolution. The lines indicate the Fourier shell correlation (FSC) between the half maps of the reconstruction. FSC curves are shown for each map.
c-e. Angular distribution of particles from overall refinements and local resolution of selected refinements. Shading from blue to yellow indicates the number of particles at a given orientation. Reconstructions coloured by local resolution. Shading from red to blue indicates the local resolution according to the accompanying colour gradient. Absolute values are indicated. B-factors were used as indicated.
Extended Data Figure 5. Fit of PEC structure in representative densities.
a. PEC structure fit in electron density contoured to 6 Å from Map 3. Front and Top views are shown. b-f. Electron density for various elements of the PEC structure shown as meshes. b. A loop connecting NELF-C helices 17 and 18 (Map 3, grey mesh) contacts the trigger loop (Map 2, limon mesh). c. NELF-B (Map 3) d. NELF-C contacts the RPB1 funnel helices (α20, α21). e. Funnel helices (α20, α21). f. NELF-AC interaction (A-α6, C-α2’).
Extended Data Figure 6. Crosslinking-mass spectrometry analysis.
a. Overview of PEC crosslinks obtained with BS3. Subunits coloured as in Fig. 1. Thickness of the grey line connecting subunits signifies the number of crosslinks obtained between subunits.
b. Histogram of unique crosslinks that were mapped onto our structure. Distances are measured between Cα pairs using Xlink analyzer74 for crosslinks with a score greater than 5. The number of unique crosslinks detected at each distance is indicated. A dotted black line marks the 30 Å distance cut-off for BS3.
c-e. Representative spectra from crosslinking mass spectrometry experiments. Blue, red and dark blue correspond to b-, y-, and a-ions of peptide A, respectively. Green, orange, and dark green correspond to b-, y-, and a-ions of peptide B. Black bars drawn between lysines indicate crosslinking sites. Red highlighted “C” represent carbamido-methaylated cysteine residues. Relative intensity of m/z is plotted. Spectra are representative of 1 biological and 2 technical replicates.
Extended Data Figure 7. Comparison of previous structures to PEC.
a. The PEC and Pol II-DSIF EC structures were aligned by their Pol II cores. Slight differences are observed in DSIF bound to the PEC (green) in comparison to Pol II-DSIF EC19(yellow).
b. The previously solved NELF-AC dimerization crystal structure21 (PDB ID 5L3X) and the NELF-AC dimerization domain from the PEC cryo-EM structure were aligned on the NELF-C subunit. The NELF-AC dimer widens when bound to Pol II (RMSD 1.39 Å).
c. NELF-A tentacle crosslinks mapped onto structure. NELF-A and corresponding Pol II or DSIF residues are indicated. Related to Fig. 6.
d. NELF-E tentacle crosslinks mapped onto structure. NELF-E and corresponding Pol II or DSIF residues are indicated. Related to Fig. 6.
Extended Data Figure 8. Conservation of Pol II and NELF elements.
Sequence alignments were made using MAFFT75 and were visualized in Jalview76. Sequences elements are coloured by identity. Darker shades of blue indicate higher levels of identity. Red boxes demarcate interacting residue.
a. Conservation of RPB1 funnel helix and shelf module residues that interact with NELF-C. Organisms that encode for NELF are indicated.
b. Conservation of NELF-C residues that interact with RPB1 funnel helix and shelf module residues.
c. Conservation of NELF-C region that interact with the trigger loop and the RPB1 trigger loop.
d. Conservation of Pol I (RPA1), Pol II (RPB1), and Pol III (RPC1) large subunits and putative NELF-C interaction interface.
Extended Data Figure 9. TFIIS does not interact with the PEC.
a. Shelf movement relative to Pol II core during reactivation. An arrested Pol II crystal structure (PDB ID: 3PO2) and the crystal structure of its reactivation intermediate (PDB ID: 3PO3) were aligned on their Pol II core modules25,31(dark grey). The shelf module (pink) rotates away from the core module during reactivation.
b. TFIIS does not bind the PEC. Fractions from size exclusion chromatography with Pol II, DSIF, NELF, and TFIIS. EC was incubated with DSIF, NELF, and TFIIS and applied to a Superose 6 column. The PEC is formed, but TFIIS does not migrate with the PEC. The experiment was performed twice.
c. TFIIS binds the Pol II-DSIF EC. Fractions from size exclusion chromatography with Pol II, DSIF, and TFIIS. EC was incubated with DSIF and TFIIS. A stable Pol II-DSIF-TFIIS EC is formed. The experiment was performed twice.
Extended Data Table 1. Components of PEC.
a. List of all protein and nucleic acid components of PEC. For details about complex assembly and composition, refer to the main text and Methods. aa: amino acids, nt: nucleotides, kDa: kilodalton †Construct possesses 3 or 4 residual amino acids from the TEV or 3C protease cleavage site, respectively, that are not reported in this table. ‡Bears 5’ 56 FAM label and the mass of label is reported in the molecular weight.
b. Amino acid substitutions between human and S. scrofa Pol II.
| a. | ||||
|---|---|---|---|---|
| Component | Subunit | Construct residues (aa)/scaffold length (nt) | Mass (kDa) | UniProt/Genbank identifier |
| RPB1 | 1-1970 | 217.2 | XP_020923484.1 | |
| RPB2 | 1-1174 | 133.8 | XP_003129085.4 | |
| RPB3 | 1-275 | 31.4 | XP_003355849.1 | |
| RPB4 | 1-142 | 16.3 | XP_020932152.1 | |
| RPB5 | 1-210 | 24.6 | XP_003354010.1 | |
| S. scrofa Pol II | RPB6 | 1-127 | 14.4 | XP_003481589.1 |
| RPB7 | 1-172 | 19.2 | XP_013849657.1 | |
| RPB8 | 1-150 | 17.1 | NP_001230270.1 | |
| RPB9 | 1-125 | 14.5 | NP_001192333.1 | |
| RPB10 | 1-67 | 7.6 | XP_003122432.1 | |
| RPB11 | 1-117 | 13.2 | XP_003124442.2 | |
| RPB12 | 1-58 | 7.0 | XP_003355060.1 | |
| NELF-A | 1-528 | 57.3 | Q9H3P2-1 | |
| NELF-B | 1-580 | 65.7 | Q8WX92-1 | |
| NELF | NELF-D† | 1-581 | 65.5 | Q81XH7-4 |
| NELF-E | 1-380 | 43.2 | P18615-1 | |
| SPT4† | 1-117 | 13.2 | P63272-1 | |
| DSIF | SPT5 | 1-1087 | 121.0 | O00267-1 |
| Template | 48 | 14.9 | ||
| Nucleic acid | Non-template | 48 | 14.7 | |
| RNA‡ | 46 | 15.3 | ||
| Final | 18 polypeptides, 3 nucleic acids | 7860 aa, 142 nt | 927.1 | |
| b. | |||
|---|---|---|---|
| Subunit | Position | Pig residue | Human residue |
| RPB2 | 882 | Gly | Ser |
| RPB3 | 75 | Thr | Ile |
| RPB3 | 140 | Ser | Asn |
| RPB6 | 126 | Ser | Thr |
Extended Data Table 2. Cryo-EM data collection, refinement, and validation statistics.
| Map 1 (EMDB-0038) (PDB 6GML) | Map 2 (EMDB-0039) | Map 3 (EMDB-0040) | Map 4 (EMDB-0041) | Map 5 (EMDB-0042) | |
|---|---|---|---|---|---|
| Data collection and processing | |||||
| Magnification | 165,000 | 165,000 | 165,000 | 165,000 | 165,000 |
| Voltage (kV) | 300 | 300 | 300 | 300 | 300 |
| Electron exposure (e–/Å2) | 34-47 | 34-47 | 34-47 | 34-47 | 34-47 |
| Defocus range (µm) | 0.25-4 | 0.25-4 | 0.25-4 | 0.25-4 | 0.25-4 |
| Pixel size (Å) | 1.2277 (binned from 0.81) | 1.2277 (binned from 0.81) | 1.2277 (binned from 0.81) | 1.2277 (binned from 0.81) | 1.2277 (binned from 0.81) |
| Symmetry imposed | Cl | Cl | Cl | Cl | Cl |
| Initial particle images (no.) | 2,347,915 | 2,347,915 | 2,347,915 | 2,347,915 | 2,347,915 |
| Final particle images (no.) | 162,269 | 73, 131 | 40,960 | 29,197 | 126,776 |
| Map resolution (Å) | 3.3 | 3.4 | 3.4 | 3.9 | 3.3 |
| FSC threshold | 0.143 | 0.143 | 0.143 | 0.143 | 0.143 |
| Map resolution range (Å) | 3-8.2 | 3.1-9 | 3.1-9.1 | 3.4-10.8 | 3.0-7.4 |
| Refinement | |||||
| Initial model used (PDB code) | 5OIK, 5L3X | ||||
| Model resolution (Å) | 3.7 | ||||
| FSC threshold | 0.5 | ||||
| Model resolution range (Å) | 3-8.2 | ||||
| Map sharpening B factor (Å2) | -65 | ||||
| Model composition | |||||
| Non-hydrogen atoms | 44785 | ||||
| Protein residues | 5623 | ||||
| Ligands | 10 | ||||
| B factors (Å2) | |||||
| Protein | 40.77 | ||||
| Ligand | 72.24 | ||||
| R.m.s. deviations | |||||
| Bond lengths (Å) | 0.008 | ||||
| Bond angles (°) | 1.254 | ||||
| Validation | |||||
| MolProbity score | 1.79 | ||||
| Clashscore | 7. 10 | ||||
| Poor rotamers (%) | 0.50 | ||||
| Ramachandran plot | |||||
| Favored (%) | 94. 10 | ||||
| Allowed (%) | 5.86 | ||||
| Disallowed (%) | 0.04 |
Extended Data Table 3. RNA Pol II-NELF interactions.
Selected interacting residues in Pol II and NELF and their respective domains are indicated. Note the highly polar nature of the Pol II-NELF interface.
| NELF subunit | Domain | Residue range | Pol II subunit | Domain | Residue range |
|---|---|---|---|---|---|
| NELF-A | NELF-AC dimer | D23 | RPB8 | β-barrel | D23 |
| NELF-B | Staircase | RPB5 | Jaw | D67 | |
| NELF-C | NELF-AC dimer | E400 | RPB1 | Funnel | K708 |
| NELF-AC dimer | K402 | Funnel | D712 | ||
| NELF-AC dimer | R439 | Funnel | D747 | ||
| NELF-AC dimer | D485 | Funnel | R743 | ||
| NELF-AC dimer | D488 | Funnel | R743 | ||
| NELF-AC dimer | K494 | Jaw | E1152 | ||
| NELF-AC dimer | D524 | Jaw | R1149 | ||
| NELF-AC dimer | D526 | Jaw | R1149 | ||
| NELF-AC dimer | D531 | Jaw | E1152 | ||
| NELF-AC dimer | D560 | Jaw | R1149 |
Supplementary Material
Acknowledgements
We thank E. Wolf (Gene Center, LMU, Munich) for pig thymus, F. Fischer and U. Neef for maintaining insect cell stocks, C. Oberthür and G. Kokic for assistance with protein purification, A. Linden and C.-T. Lee for help with crosslinking mass spectrometry, C. Bernecky for discussions and sharing the DSIF plasmid before publication, and D. Tegunov and C. Wigge for EM support. S.M.V. was supported by an EMBO Long-Term Fellowship (ALTF 745-2014). H.U. was supported by the Deutsche Forschungsgemeinschaft (DFG SFB860). PC was supported by the Advanced Grant TRANSREGULON (grant agreement No 693023) of the European Research Council, and the Volkswagen Foundation.
Footnotes
Data availability statement
The electron density reconstructions and final PEC model were deposited with the Electron Microscopy Data Base (EMDB) under accession codes EMD-0038 to EMD-0042, and with the Protein Data Bank (PDB) accession 6GML. Source data for Figures 1a, b and 6c, Extended Data Figs. 1a, d, e-f, 2b-e are found in Supplementary Figure 1 and Supplementary Table 6.
Author contributions S.M.V. designed and conducted all experiments, except stated otherwise. L.F. collected and processed EM data. L.F. and S.M.V. built the model. H.U. performed mass spectrometry. P.C. supervised the project. S.M.V., L.F., and P.C. wrote the manuscript with input from H.U..
The author declare that they have no competing financial interest.
Author information Reprints and permissions information is available at www.nature.com/reprints.
References
- 1.Shilatifard A, Conaway RC, Conaway JW. The RNA Polymerase II Elongation Complex. Annu Rev Biochem. 2003;72:693–715. doi: 10.1146/annurev.biochem.72.121801.161551. [DOI] [PubMed] [Google Scholar]
- 2.Bentley DL, Groudine M. A block to elongation is largely responsible for decreased transcription of c-myc in differentiated HL60 cells. Nature. 1986;321:702–706. doi: 10.1038/321702a0. [DOI] [PubMed] [Google Scholar]
- 3.Kao S-Y, Calman AF, Luciw PA, Peterlin BM. Anti-termination of transcription within the long terminal repeat of HIV-1 by tat gene product. Nature. 1987;330:489–493. doi: 10.1038/330489a0. [DOI] [PubMed] [Google Scholar]
- 4.Gilmour DS, Lis JT. RNA polymerase II interacts with the promoter region of the noninduced hsp70 gene in Drosophila melanogaster cells. Mol Cell Biol. 1986;6:3984–3989. doi: 10.1128/mcb.6.11.3984. [DOI] [PMC free article] [PubMed] [Google Scholar]
- 5.Strobl LJ, Eick D. Hold back of RNA polymerase II at the transcription start site mediates down-regulation of c-myc in vivo. EMBO J. 1992;11:3307. doi: 10.1002/j.1460-2075.1992.tb05409.x. [DOI] [PMC free article] [PubMed] [Google Scholar]
- 6.Wada T, et al. DSIF, a novel transcription elongation factor that regulates RNA polymerase II processivity, is composed of human Spt4 and Spt5 homologs. Genes Dev. 1998;12:343–356. doi: 10.1101/gad.12.3.343. [DOI] [PMC free article] [PubMed] [Google Scholar]
- 7.Yamaguchi Y, et al. NELF, a Multisubunit Complex Containing RD, Cooperates with DSIF to Repress RNA Polymerase II Elongation. Cell. 1999;97:41–51. doi: 10.1016/s0092-8674(00)80713-8. [DOI] [PubMed] [Google Scholar]
- 8.Narita T, et al. Human transcription elongation factor NELF: identification of novel subunits and reconstitution of the functionally active complex. Mol Cell Biol. 2003;23:1863–1873. doi: 10.1128/MCB.23.6.1863-1873.2003. [DOI] [PMC free article] [PubMed] [Google Scholar]
- 9.Marshall NF, Price DH. Purification of P-TEFb, a transcription factor required for the transition into productive elongation. J Biol Chem. 1995;270:12335–12338. doi: 10.1074/jbc.270.21.12335. [DOI] [PubMed] [Google Scholar]
- 10.Wei P, Garber ME, Fang SM, Fischer WH, Jones KA. A novel CDK9-associated C-type cyclin interacts directly with HIV-1 Tat and mediates its high-affinity, loop-specific binding to TAR RNA. Cell. 1998;92:451–462. doi: 10.1016/s0092-8674(00)80939-3. [DOI] [PubMed] [Google Scholar]
- 11.Fujinaga K, et al. Dynamics of human immunodeficiency virus transcription: P-TEFb phosphorylates RD and dissociates negative effectors from the transactivation response element. Mol Cell Biol. 2004;24:787–795. doi: 10.1128/MCB.24.2.787-795.2004. [DOI] [PMC free article] [PubMed] [Google Scholar]
- 12.Yamada T, et al. P-TEFb-mediated phosphorylation of hSpt5 C-terminal repeats is critical for processive transcription elongation. Mol Cell. 2006;21:227–237. doi: 10.1016/j.molcel.2005.11.024. [DOI] [PubMed] [Google Scholar]
- 13.Marshall NF, Peng J, Xie Z, Price DH. Control of RNA polymerase II elongation potential by a novel carboxyl-terminal domain kinase. J Biol Chem. 1996;271:27176–27183. doi: 10.1074/jbc.271.43.27176. [DOI] [PubMed] [Google Scholar]
- 14.Rahl PB, et al. c-Myc Regulates Transcriptional Pause Release. Cell. 2010;141:432–445. doi: 10.1016/j.cell.2010.03.030. [DOI] [PMC free article] [PubMed] [Google Scholar]
- 15.Williams LH, et al. Pausing of RNA polymerase II regulates mammalian developmental potential through control of signaling networks. Mol Cell. 2015;58:311–322. doi: 10.1016/j.molcel.2015.02.003. [DOI] [PMC free article] [PubMed] [Google Scholar]
- 16.Adelman K, et al. Immediate mediators of the inflammatory response are poised for gene activation through RNA polymerase II stalling. Proc Natl Acad Sci USA. 2009;106:18207–18212. doi: 10.1073/pnas.0910177106. [DOI] [PMC free article] [PubMed] [Google Scholar]
- 17.Wu C-H, et al. NELF and DSIF cause promoter proximal pausing on the hsp70 promoter in Drosophila. Genes Dev. 2003;17:1402–1414. doi: 10.1101/gad.1091403. [DOI] [PMC free article] [PubMed] [Google Scholar]
- 18.Martinez-Rucobo FW, Cramer P. Structural basis of transcription elongation. Biochim Biophys Acta. 2013;1829:9–19. doi: 10.1016/j.bbagrm.2012.09.002. [DOI] [PubMed] [Google Scholar]
- 19.Bernecky C, Plitzko JM, Cramer P. Structure of a transcribing RNA polymerase II-DSIF complex reveals a multidentate DNA-RNA clamp. Nat Struct Mol Biol. 2017;24:809–815. doi: 10.1038/nsmb.3465. [DOI] [PubMed] [Google Scholar]
- 20.Ehara H, et al. Structure of the complete elongation complex of RNA polymerase II with basal factors. Science. 2017;357:921–924. doi: 10.1126/science.aan8552. [DOI] [PubMed] [Google Scholar]
- 21.Vos SM, et al. Architecture and RNA binding of the human negative elongation factor. eLife. 2016;5:e14981. doi: 10.7554/eLife.14981. [DOI] [PMC free article] [PubMed] [Google Scholar]
- 22.Rao JN, et al. Structural studies on the RNA-recognition motif of NELF E, a cellular negative transcription elongation factor involved in the regulation of HIV transcription. Biochem J. 2006;400:449–456. doi: 10.1042/BJ20060421. [DOI] [PMC free article] [PubMed] [Google Scholar]
- 23.Palangat M, Meier TI, Keene RG, Landick R. Transcriptional pausing at +62 of the HIV-1 nascent RNA modulates formation of the TAR RNA structure. Mol Cell. 1998;1:1033–1042. doi: 10.1016/s1097-2765(00)80103-3. [DOI] [PubMed] [Google Scholar]
- 24.Larson MH, et al. A pause sequence enriched at translation start sites drives transcription dynamics in vivo. Science. 2014;344:1042–1047. doi: 10.1126/science.1251871. [DOI] [PMC free article] [PubMed] [Google Scholar]
- 25.Cheung ACM, Cramer P. Structural basis of RNA polymerase II backtracking, arrest and reactivation. Nature. 2011;471:249–253. doi: 10.1038/nature09785. [DOI] [PubMed] [Google Scholar]
- 26.Cheung ACM, Sainsbury S, Cramer P. Structural basis of initial RNA polymerase II transcription. EMBO J. 2011;30:4755–4763. doi: 10.1038/emboj.2011.396. [DOI] [PMC free article] [PubMed] [Google Scholar]
- 27.Kang JY, et al. RNA Polymerase Accommodates a Pause RNA Hairpin by Global Conformational Rearrangements that Prolong Pausing. Mol Cell. 2018;69:802–815.e1. doi: 10.1016/j.molcel.2018.01.018. [DOI] [PMC free article] [PubMed] [Google Scholar]
- 28.Guo X, et al. Structural Basis for NusA Stabilized Transcriptional Pausing. Mol Cell. 2018;69:816–827.e4. doi: 10.1016/j.molcel.2018.02.008. [DOI] [PMC free article] [PubMed] [Google Scholar]
- 29.Cramer P, Bushnell DA, Kornberg RD. Structural Basis of Transcription: RNA Polymerase II at 2.8 Ångstrom Resolution. Science. 2001 doi: 10.1126/science.1059493. [DOI] [PubMed] [Google Scholar]
- 30.Zhang G, et al. Crystal structure of Thermus aquaticus core RNA polymerase at 3.3 A resolution. Cell. 1999;98:811–824. doi: 10.1016/s0092-8674(00)81515-9. [DOI] [PubMed] [Google Scholar]
- 31.Kettenberger H, Armache K-J, Cramer P. Architecture of the RNA Polymerase II-TFIIS Complex and Implications for mRNA Cleavage. Cell. 2003;114:347–357. doi: 10.1016/s0092-8674(03)00598-1. [DOI] [PubMed] [Google Scholar]
- 32.Wang D, Bushnell DA, Westover KD, Kaplan CD, Kornberg RD. Structural basis of transcription: role of the trigger loop in substrate specificity and catalysis. Cell. 2006;127:941–954. doi: 10.1016/j.cell.2006.11.023. [DOI] [PMC free article] [PubMed] [Google Scholar]
- 33.Vassylyev DG, Vassylyeva MN, Perederina A, Tahirov TH, Artsimovitch I. Structural basis for transcription elongation by bacterial RNA polymerase. Nature. 2007;448:157–162. doi: 10.1038/nature05932. [DOI] [PubMed] [Google Scholar]
- 34.Plaschka C, et al. Transcription initiation complex structures elucidate DNA opening. Nature. 2016;533:353–358. doi: 10.1038/nature17990. [DOI] [PubMed] [Google Scholar]
- 35.Yamaguchi Y, Inukai N, Narita T, Wada T, Handa H. Evidence that negative elongation factor represses transcription elongation through binding to a DRB sensitivity-inducing factor/RNA polymerase II complex and RNA. Mol Cell Biol. 2002;22:2918–2927. doi: 10.1128/MCB.22.9.2918-2927.2002. [DOI] [PMC free article] [PubMed] [Google Scholar]
- 36.Pagano JM, et al. Defining NELF-E RNA Binding in HIV-1 and Promoter-Proximal Pause Regions. PLoS Genetics. 2014;10:e1004090. doi: 10.1371/journal.pgen.1004090. [DOI] [PMC free article] [PubMed] [Google Scholar]
- 37.Gressel S, et al. CDK9-dependent RNA polymerase II pausing controls transcription initiation. eLife. 2017;6:e29736. doi: 10.7554/eLife.29736. [DOI] [PMC free article] [PubMed] [Google Scholar]
- 38.Missra A, Gilmour DS. Interactions between DSIF (DRB sensitivity inducing factor), NELF (negative elongation factor), and the Drosophila RNA polymerase II transcription elongation complex. Proc Natl Acad Sci USA. 2010;107:11301–11306. doi: 10.1073/pnas.1000681107. [DOI] [PMC free article] [PubMed] [Google Scholar]
- 39.Landick R. The regulatory roles and mechanism of transcriptional pausing. Biochem Soc Trans. 2006;34:1062–1066. doi: 10.1042/BST0341062. [DOI] [PubMed] [Google Scholar]
- 40.Reines D, Ghanouni P, Li QQ, Mote J. The RNA polymerase II elongation complex. Factor-dependent transcription elongation involves nascent RNA cleavage. J Biol Chem. 1992;267:15516–15522. [PMC free article] [PubMed] [Google Scholar]
- 41.Adelman K, et al. Efficient Release from Promoter-Proximal Stall Sites Requires Transcript Cleavage Factor TFIIS. Mol Cell. 2005;17:103–112. doi: 10.1016/j.molcel.2004.11.028. [DOI] [PubMed] [Google Scholar]
- 42.Nechaev S, et al. Global Analysis of Short RNAs Reveals Widespread Promoter-Proximal Stalling and Arrest of Pol II in Drosophila. Science. 2010;327:335–338. doi: 10.1126/science.1181421. [DOI] [PMC free article] [PubMed] [Google Scholar]
- 43.Palangat M, Renner DB, Price DH, Landick R. A negative elongation factor for human RNA polymerase II inhibits the anti-arrest transcript-cleavage factor TFIIS. Proc Natl Acad Sci USA. 2005;102:15036–15041. doi: 10.1073/pnas.0409405102. [DOI] [PMC free article] [PubMed] [Google Scholar]
- 44.He Y, et al. Near-atomic resolution visualization of human transcription promoter opening. Nature. 2016;533:359–365. doi: 10.1038/nature17970. [DOI] [PMC free article] [PubMed] [Google Scholar]
- 45.Bochkareva A, Yuzenkova Y, Tadigotla VR, Zenkin N. Factor-independent transcription pausing caused by recognition of the RNA–DNA hybrid sequence. EMBO J. 2012;31:630–639. doi: 10.1038/emboj.2011.432. [DOI] [PMC free article] [PubMed] [Google Scholar]
- 46.Imashimizu M, et al. Visualizing translocation dynamics and nascent transcript errors in paused RNA polymerases in vivo. Genome Biol. 2015;16:98. doi: 10.1186/s13059-015-0666-5. [DOI] [PMC free article] [PubMed] [Google Scholar]
- 47.Kireeva ML, Kashlev M. Mechanism of sequence-specific pausing of bacterial RNA polymerase. PNAS. 2009;106:8900–8905. doi: 10.1073/pnas.0900407106. [DOI] [PMC free article] [PubMed] [Google Scholar]
- 48.Palangat M, Hittinger CT, Landick R. Downstream DNA selectively affects a paused conformation of human RNA polymerase II. J Mol Biol. 2004;341:429–442. doi: 10.1016/j.jmb.2004.06.009. [DOI] [PubMed] [Google Scholar]
- 49.Cheng B, Price DH. Properties of RNA polymerase II elongation complexes before and after the P-TEFb-mediated transition into productive elongation. J Biol Chem. 2007;282:21901–21912. doi: 10.1074/jbc.M702936200. [DOI] [PubMed] [Google Scholar]
- 50.Vos SM, et al. Structure of activated transcription complex Pol II-DSIF-PAF-SPT6. doi: 10.1038/s41586-018-0440-4. [DOI] [PubMed] [Google Scholar]
- 51.Gradia SD, et al. MacroBac: New Technologies for Robust and Efficient Large-Scale Production of Recombinant Multiprotein Complexes. Methods Enzymol. 2017;592:1–26. doi: 10.1016/bs.mie.2017.03.008. [DOI] [PMC free article] [PubMed] [Google Scholar]
- 52.Hu X, et al. A Mediator-responsive form of metazoan RNA polymerase II. Proc Natl Acad Sci USA. 2006;103:9506–9511. doi: 10.1073/pnas.0603702103. [DOI] [PMC free article] [PubMed] [Google Scholar]
- 53.Schneider CA, Rasband WS, Eliceiri KW. NIH Image to ImageJ: 25 years of image analysis. Nat Methods. 2012;9:671–675. doi: 10.1038/nmeth.2089. [DOI] [PMC free article] [PubMed] [Google Scholar]
- 54.Xu J, et al. Structural basis for the initiation of eukaryotic transcription-coupled DNA repair. Nature. 2017;13:5361. doi: 10.1038/nature24658. [DOI] [PMC free article] [PubMed] [Google Scholar]
- 55.Kireeva ML, Komissarova N, Waugh DS, Kashlev M. The 8-nucleotide-long RNA:DNA hybrid is a primary stability determinant of the RNA polymerase II elongation complex. J Biol Chem. 2000;275:6530–6536. doi: 10.1074/jbc.275.9.6530. [DOI] [PubMed] [Google Scholar]
- 56.Komissarova N, Kireeva ML, Becker J, Sidorenkov I, Kashlev M. Engineering of elongation complexes of bacterial and yeast RNA polymerases. Methods Enzymol. 2003;371:233–251. doi: 10.1016/S0076-6879(03)71017-9. [DOI] [PubMed] [Google Scholar]
- 57.Kimanius D, Forsberg BO, Scheres SH, Lindahl E. Accelerated cryo-EM structure determination with parallelisation using GPUs in RELION-2. eLife. 2016;5:e18722. doi: 10.7554/eLife.18722. [DOI] [PMC free article] [PubMed] [Google Scholar]
- 58.Scheres SHW. RELION: implementation of a Bayesian approach to cryo-EM structure determination. J Struct Biol. 2012;180:519–530. doi: 10.1016/j.jsb.2012.09.006. [DOI] [PMC free article] [PubMed] [Google Scholar]
- 59.Pettersen EF, et al. UCSF Chimera--a visualization system for exploratory research and analysis. J Comput Chem. 2004;25:1605–1612. doi: 10.1002/jcc.20084. [DOI] [PubMed] [Google Scholar]
- 60.Rosenthal PB, Henderson R. Optimal determination of particle orientation, absolute hand, and contrast loss in single-particle electron cryomicroscopy. J Mol Biol. 2003;333:721–745. doi: 10.1016/j.jmb.2003.07.013. [DOI] [PubMed] [Google Scholar]
- 61.Fernandez-Leiro R, Scheres SHW, IUCr A pipeline approach to single-particle processing in RELION. Acta Crystallogr Sect D Struct Biol. 2017;73:496–502. doi: 10.1107/S2059798316019276. [DOI] [PMC free article] [PubMed] [Google Scholar]
- 62.Emsley P, Lohkamp B, Scott WG, Cowtan K. Features and development of Coot. Acta Crystallogr D Biol Crystallogr. 2010;66:486–501. doi: 10.1107/S0907444910007493. [DOI] [PMC free article] [PubMed] [Google Scholar]
- 63.Meka H, Werner F, Cordell SC, Onesti S, Brick P. Crystal structure and RNA binding of the Rpb4/Rpb7 subunits of human RNA polymerase II. Nucleic Acids Res. 2005;33:6435–6444. doi: 10.1093/nar/gki945. [DOI] [PMC free article] [PubMed] [Google Scholar]
- 64.Trabuco LG, Villa E, Mitra K, Frank J, Schulten K. Flexible fitting of atomic structures into electron microscopy maps using molecular dynamics. Structure. 2008;16:673–683. doi: 10.1016/j.str.2008.03.005. [DOI] [PMC free article] [PubMed] [Google Scholar]
- 65.Adamczak R, Porollo A, Meller J. Combining prediction of secondary structure and solvent accessibility in proteins. Proteins. 2005;59:467–475. doi: 10.1002/prot.20441. [DOI] [PubMed] [Google Scholar]
- 66.Buchan DWA, Minneci F, Nugent TCO, Bryson K, Jones DT. Scalable web services for the PSIPRED Protein Analysis Workbench. Nucleic Acids Res. 2013;41:W349–57. doi: 10.1093/nar/gkt381. [DOI] [PMC free article] [PubMed] [Google Scholar]
- 67.Kim DE, Chivian D, Baker D. Protein structure prediction and analysis using the Robetta server. Nucleic Acids Res. 2004;32:W526–W531. doi: 10.1093/nar/gkh468. [DOI] [PMC free article] [PubMed] [Google Scholar]
- 68.Holm L, Rosenstrom P. Dali server: conservation mapping in 3D. Nucleic Acids Res. 2010;38:W545–W549. doi: 10.1093/nar/gkq366. [DOI] [PMC free article] [PubMed] [Google Scholar]
- 69.Sun Q, et al. Nuclear export inhibition through covalent conjugation and hydrolysis of Leptomycin B by CRM1. Proc Natl Acad Sci USA. 2013;110:1303–1308. doi: 10.1073/pnas.1217203110. [DOI] [PMC free article] [PubMed] [Google Scholar]
- 70.Andrade MA, Petosa C, O’Donoghue SI, Müller CW, Bork P. Comparison of ARM and HEAT protein repeats. J Mol Biol. 2001;309:1–18. doi: 10.1006/jmbi.2001.4624. [DOI] [PubMed] [Google Scholar]
- 71.Chen VB, et al. MolProbity: all-atom structure validation for macromolecular crystallography. Acta Crystallogr D Biol Crystallogr. 2010;66:12–21. doi: 10.1107/S0907444909042073. [DOI] [PMC free article] [PubMed] [Google Scholar]
- 72.Yang B, et al. Identification of cross-linked peptides from complex samples. Nat Methods. 2012;9:904–906. doi: 10.1038/nmeth.2099. [DOI] [PubMed] [Google Scholar]
- 73.Combe CW, Fischer L, Rappsilber J. xiNET: cross-link network maps with residue resolution. Mol Cell Proteomics. 2015;14:1137–1147. doi: 10.1074/mcp.O114.042259. [DOI] [PMC free article] [PubMed] [Google Scholar]
- 74.Kosinski J, et al. Xlink Analyzer: Software for analysis and visualization of cross-linking data in the context of three-dimensional structures. J Struct Biol. 2015;189:177–183. doi: 10.1016/j.jsb.2015.01.014. [DOI] [PMC free article] [PubMed] [Google Scholar]
- 75.Katoh K, Standley DM. MAFFT multiple sequence alignment software version 7: improvements in performance and usability. Mol Biol Evol. 2013;30:772–780. doi: 10.1093/molbev/mst010. [DOI] [PMC free article] [PubMed] [Google Scholar]
- 76.Waterhouse AM, Procter JB, Martin DMA, Clamp M, Barton GJ. Jalview Version 2--a multiple sequence alignment editor and analysis workbench. Bioinformatics. 2009;25:1189–1191. doi: 10.1093/bioinformatics/btp033. [DOI] [PMC free article] [PubMed] [Google Scholar]
Associated Data
This section collects any data citations, data availability statements, or supplementary materials included in this article.


