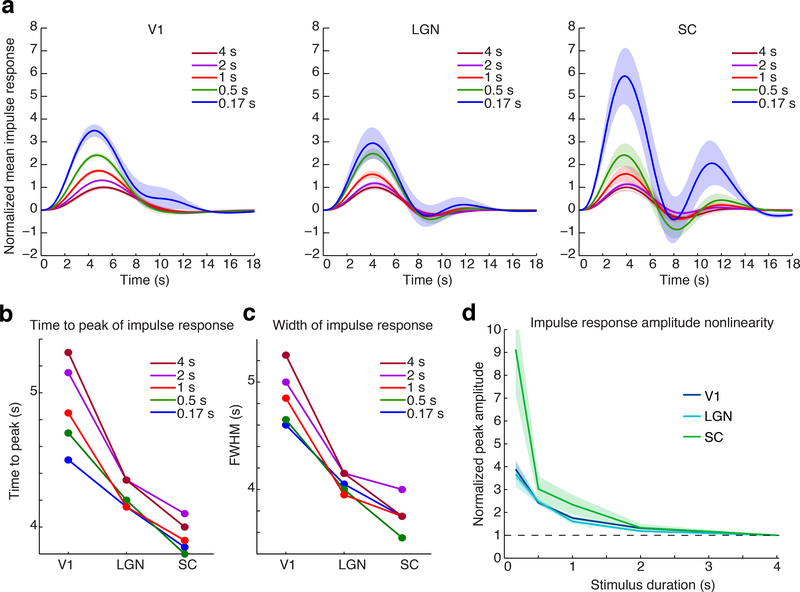
Figure 3: Deconvolved impulse response shows nonlinearity in timing and amplitude.
A) Mean impulse response across subjects for each ROI and stimulus duration, normalized to the peak amplitude of the response to the 4 second stimulus. Shaded region is standard error across subjects (n=14). B) Mean time-to-peak of the impulse response: each structure exhibits temporal nonlinearities, with faster responses to shorter stimuli. C) Mean full-width-half-maximum of the impulse response. D) Nonlinearity of the impulse response amplitude across ROIs shows similar amplitude nonlinearity in LGN and V1, and stronger nonlinearity in SC. Amplitudes are normalized to the value for the 4 s stimulus. Black dashed line indicates the linear response as a reference, shaded region is standard error across subjects (n=14).

