

Abstract
Aberrant hypermethylation of CpG islands in the promoter region of tumor suppressor genes is a promising biomarker for early cancer detection. This methylation status is reflected in the methylation pattern of ctDNA shed from the primary tumor; however, to realize the full clinical utility of ctDNA methylation detection via liquid biopsy for early cancer diagnosis, improvements in the sensitivity and multiplexability of existing technologies must be improved. Additionally, the assay must be cheap and easy to perform in a clinical setting. We report the integration of methylation specific PCR (MSP) to melt curve analysis on giant magnetoresistive (GMR) biosensors to greatly enhance the sensitivity of our DNA hybridization assay for methylation detection. Our GMR sensor is functionalized with synthetic DNA probes that target methylated or unmethylated CpG sites in the MSP amplicon, and measures the difference in melting temperature (Tm) between the two probes (ΔTm), giving an analytical limit of detection down to 0.1% methylated DNA in solution. Additionally, linear regression of ΔTm’s for serial dilutions of methylated:unmethylated mixtures allows for quantification of methylation percentage, which could have diagnostic and prognostic utility. Lastly, we performed multiplexed MSP on two different genes, and show the ability of our GMR assay to resolve this mixture, despite their amplicons’ overlapping Tm’s in standard EvaGreen melt analysis. The multiplexing ability of our assay and its enhanced sensitivity, without necessitating deep sequencing, represent important steps toward realizing an assay for the detection of methylated ctDNA in plasma for early cancer detection in a clinical setting.
Keywords: GMR sensors, PCR, methylation specific PCR, DNA melting, cancer, array
1. Introduction
The development and progression of cancer is associated with the accumulation of genetic and epigenetic alterations that disturb normal cellular function and lead to uncontrolled cellular proliferation (Hanahan and Weinberg, 2011). A common epigenetic alteration is the abnormal methylation of cytosine to 5-methylcytosine of cytosine-guanine dinucleotides (CpG) in CpG islands, >200 bp regions of significant CpG density, located in the promoter regions of tumor suppressor genes (Baylin, 2005). This hypermethylation renders the promoter region inaccessible to transcription factors and effectively silences the tumor suppressor gene (Herman and Baylin, 2003). Promoter CpG island hypermethylation represents a promising biomarker for the early detection of cancer as it is an early event in carcinogenesis (Belinsky, 2005); statistically, hypermethylation is also a more robust and prevalent marker of tumor presence as compared to mutation, of which subsets occur in significantly smaller proportions of the population (Han et al., 2017; Kim et al., 2018; Warton et al., 2016).
Solid tumors actively shed circulating tumor DNA (ctDNA) into the blood stream by necrotic and apoptotic pathways (Jahr et al., 2001), and previous studies have shown a significant correlation between methylation status of a primary tumor and its corresponding ctDNA (Chimonidou et al., 2017; Hoque et al., 2004; Warton and Samimi, 2015). Probing the methylation status of ctDNA via liquid biopsy has gained significant interest for non-invasive screening and early detection of cancer (Calapre et al., 2017), however obstacles exist that must be overcome before the full clinical utility of ctDNA can be realized (Gorgannezhad et al., 2018; Han et al., 2017). Early stage cancer patients typically have low copy numbers of methylated ctDNA amidst a much larger background of unmethylated, healthy cell-free DNA (cfDNA). Blood based diagnostic assays must be able to detect these low ratios of methylated ctDNA, which can be as small as 0.1% of total cfDNA (Qin et al., 2016). Ideally, this assay would also be multiplexable to detect the methylation status of a panel of genes for enhanced sensitivity and specificity (Ooki et al., 2017).
Of the many technologies available for probing methylation status, few fulfill the necessary requirements above while also being well suited for a screening or early detection setting, which require the methods to be cheap, fast, and utilize common laboratory equipment and reagents. Because CpG methylation status is lost during PCR amplification, most technologies incorporate bisulfite conversion of the DNA (Plongthongkum et al., 2014). This converts an epigenetic event, methylation, into a change in the actual sequence (C/T) of the DNA such that methylation status can be probed with standard techniques for DNA sequence determination, such as sequencing, methylation specific PCR (MSP), and methylation sensitive melt curve analysis (Wojdacz and Dobrovic, 2007; Worm et al., 2001). Whole genomic bisulfite sequencing (WGBS) may have the greatest sensitivity for detecting methylated DNA and is considered a “gold standard” for methylation analysis (Kernaleguen et al., 2018). WGBS employs next generation sequencing (NGS), which has reported sensitivities of detecting on the order of 0.1% variant allelic fractions (Lanman et al., 2015; Mehrotra et al., 2017), but these techniques are expensive, time consuming, and require high read depth to ensure detection of small ratios of methylated DNA (Aravanis et al., 2017; Ziller et al., 2015). Additionally, bisulfite conversion of DNA reduces overall sequence complexity as cytosines are converted to thymines, making sequence alignment more difficult (Kurdyukov and Bullock, 2016). Lastly, bisulfite conversion reduces the overall quality of the DNA and leads to fragmentation, making high quality library generation more difficult (Olova et al., 2018). Pyrosequencing is a rapid, less expensive, and less technically complex alternative, but it does not offer nearly as high sensitivity as WGBS, with a limit of detection of ~5% methylation (Kurdyukov and Bullock, 2016). MSP has been combined with pyrosequencing to achieve greater sensitivity for methylation detection, but the biased amplification prevented quantification of initial methylation density (Shaw et al., 2006). While amplification and high-resolution melting (HRM) analysis is cheaper and requires less specialized equipment and expertise, the technique is weakly sensitive to C→T substitutions. Additionally, as HRM requires a dsDNA intercalating dye such as SYBR Green or EvaGreen, these amplifications must be performed in single-plex. To probe the methylation status of more than one gene in a panel, this would require aliquoting the sample in separate MSP reactions for standard fluorescence based HRM. Due to limited patient sample volume and low copy numbers of methylated DNA in early stage patient cfDNA, this is not feasible in a clinical setting.
Performing melting curve analysis on GMR sensors is a promising technology for the simultaneous detection of multiple methylated CpG sites in ctDNA for early detection of cancer. Using this technique, we have previously measured methylation density of the promoter regions of bisulfite converted DNA from melanoma cell lines in a rapid, cheap, and multiplexed fashion (Rizzi et al., 2017a). The magnetic detection of biomolecules via GMR sensors has been applied to immunoassays, in fundamental research and clinical settings (Earhart et al., 2013; Gaster et al., 2009; Lee et al., 2016b), small molecule detection (Lee et al., 2016a), and DNA detection (Rizzi et al., 2014, 2017b; Xu et al., 2008), and is based off a change in resistance in the GMR magnetic stack structure of the biosensor when the local magnetic field is altered due to magnetic nanoparticle binding (Hall et al., 2010a). Our results demonstrated the ability to detect methylated CpG sites in the promoter regions of retinoic acid receptor β (RARB) and the receptor tyrosine kinase KIT (KIT), two genes which are hypermethylated in 20–70% and 2540% of melanomas, respectively (Dahl et al., 2015, 2013; Dahl and Guldberg, n.d.). Utilizing melt curve analysis of the GMR binding signal allowed for multiplexing melting curve analysis on a single chip, with the ability to detect down to 10% methylated RARB and KIT promoter regions in a background of their respective unmethylated genes. This 10% limit of detection appears to be the inherent sensitivity of the GMR sensor in its ability to detect a small fraction of methylated DNA. For this technique to be able to detect low copy numbers of ctDNA and be valuable for early cancer detection, its sensitivity must be improved. We have incorporated MSP to this platform, which biases amplification of methylated DNA over unmethylated DNA at high annealing temperatures due to numerous C/T mismatches between the primers and unmethylated template (Wojdacz et al., 2008). Whereas in our previous study, PCR amplification of bisulfite converted melanoma DNA was nonspecific and preserved the ratio of methylated:unmethylated DNA before and after amplification, the addition of methylation specific primers effectively increases this ratio post-PCR such that a much larger proportion of the PCR products are methylated compared to the initial ratio. Thus, while the inherent sensitivity of the GMR sensors is unchanged, we are able to detect lower ratios of methylated DNA, making this technology a promising addition to the complement of techniques for assessing methylation status of ctDNA in cancer screening and early detection.
2. Material and methods
2.1. Cell line DNA extraction and bisulphite conversion
The melanoma cell lines used in this study were obtained from The European Searchable Tumour Line Database (ESTDAB: http://www.ebi.ac.uk/ipd/estdab). The culture and DNA extraction procedures follow Rizzi et al. (2017a). Briefly, cells were cultured in RPMI-1640 medium containing 10% fetal bovine serum (FBS) and antibiotics at 37 °C and 5% CO2. Genomic DNA was isolated using the Qiagen AllPrep DNA/RNA/Protein Mini kit (Qiagen GmbH, Hilden, Germany) and quantified using a NanoDrop ND-1000 spectrophotometer (NanoDrop Technologies, Wilmington, DE). Bisulfite conversion of DNA (1 μg) was performed with the EZ DNA Methylation-Gold (Zymo Research, Irvine, CA) kit according to the manufacturer’s instructions.
2.2. MSP Primers and GMR Probe Design
MSP primers were designed utilizing PREMIER Biosoft Beacon Designer 8 MethylLight TaqMan Design feature targeting the same promoter regions as in Rizzi et al. (2017a). Forward primers were biotinylated to allow for magnetic labelling. GMR DNA probes targeting methylated CpG sites were designed by selecting interesting CpG rich sequences in the bisulphite converted MSP amplicons. The GMR probes were checked for lack of secondary structure using IDT OligoAnalyzer 3.1. GMR DNA probes targeting the unmethylated alternative sequence were designed by converting cytosine to thymines or adenines in CpG sites, then expanding the sequences such that the Tm’s of the two sequences were equivalent.
2.3. Methylation specific PCR
Primers were obtained from Integrated DNA Technologies (IDT), all sequences can be found in Supporting Information Table S1. MSP amplification was performed with BioRad Precision Melt Supermix, which contains a hot-start iTaq polymerase. MSP was performed in triplicate using 15 μL supermix, with final primer concentrations of 0.33 μM and a total volume of 30 μL. Real-time PCR was performed with the BioRad CFX96 Touch Real-Time PCR Detection System, with the following thermal cycling conditions: 95 °C for 3 minutes of activation, followed by 45 cycles of 95 °C for 10 seconds, annealing (Ta = 59 °C, 62 °C, or 64 °C) for 30 seconds, and 72 °C for 30 seconds followed by a plate read. A melt curve was performed from 65 °C to 95 °C at 0.5 °C increments, and data analysis was performed with BioRad CFX Maestro.
Serial dilutions of methylated RARB DNA (MRARB) from EST164 cell line into unmethylated RARB DNA (uMRARB) from EST094 cell line were prepared by mixing 50 ng → 50 pg of EST164 bisulfite converted gDNA with a constant amount of 50 ng of EST094 bisulfite converted gDNA prior to MSP with RARB primers.
Multiplexed PCR was performed with both RARB and KIT primers in a single tube on EST045 (methylated RARB and methylated KIT promoters) at Ta = 59 °C.
2.4. GMR biosensors
GMR biosensors consist of a multilayer spin valve structure fabricated in an 8 × 10 array, as described previously (Gaster et al., 2009). GMR sensors were functionalized with ssDNSA hybridization probes complementary to the methylated and unmethylated sequences of RARB and KIT genes after bisulfite conversion (sequences in Supplementary Information Table S2). The 5’ amine modified probes where covalently bound to the sensor surface via a silanization process described previously (Rizzi et al., 2014). Briefly, the sensor surface was activated with a bath of 10% v/v 3-Aminopropyltriethoxysilane (APTES) in acetone for 30 min followed with by immersion in 5% v/v solution of Glutaraldehyde (GA) in distilled water for 30 min. The probes were spotted on each GMR sensor in the biosensor array using an automatic spotter (sciFlexarrayer, Scienion). Six sensors were functionalized with each RARB probe. A biotinylated DNA and an unspecific sequence were used as positive and negative references on four sensors each. Before use, the GMR chips were mounted in a temperature-controlled cartridge (Fig. 1b) and blocked with 1% w/w bovine serum albumin (BSA) in phosphate buffered saline (PBS). The temperature-controlled cartridge comprised of a Peltier element and a Pt1000 resistive thermometer. The Peltier element was controlled via a PID loop using PTC 5 K- CH (Wavelength Electronics, Bozeman, MT). A custom LabView interface allowed for temperature setting and temperature ramping.
Figure 1:
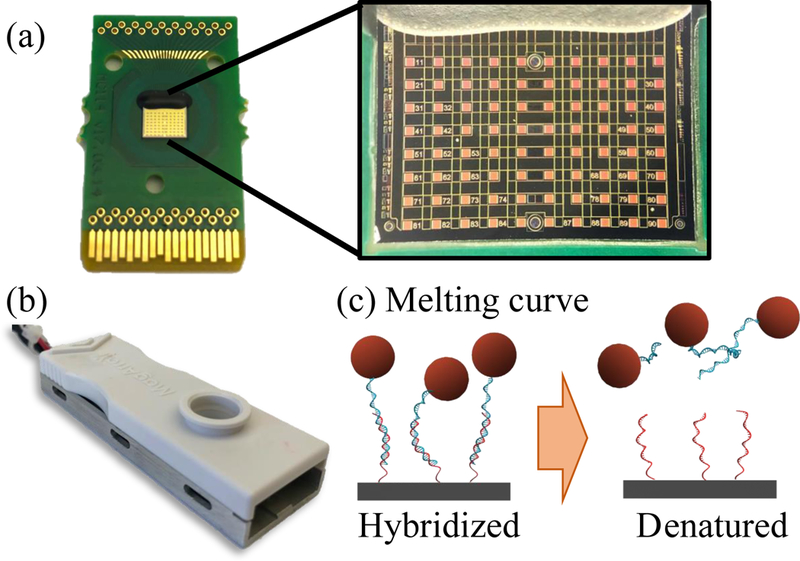
(a) GMR sensors manufactured by MagArray, with enhanced image of the 80-sensor array. (b) GMR chip mounted on custom-made temperature controlled cartridge for melt analysis. (c) Schematic of melt analysis on GMR sensors: ramping the temperature causes DNA denaturation and attenuation of GMR signal due to loss of bound MNPs.
Each PCR amplification product was measured on a separate GMR chip. Prior to hybridization to the sensor surface, 5 μL of biotinylated PCR product was diluted in 145 μL of hybridization buffer (400 mM NaCl in Tris EDTA buffer from Thermofisher, USA). The diluted product was denatured at 95 °C for 10 min and shock cooled in ice for 5 min. The denatured products were hybridized on the sensor surface for 1h at 37 °C. After hybridization, unbound products were removed by rinsing the sensor with denaturation buffer (10 mM NaCl in Tris EDTA buffer) at 5 °C. The denaturation buffer was used at low temperature to prevent DNA denaturation during rinsing.
Streptavidin MACS (Miltenyi) magnetic nanoparticles (MNPs) were used as labels to bind to biotinylated PCR products. The stock suspension buffer was exchanged with denaturation buffer using a MACS μColumn (Miltenyi) as described previously (Rizzi et al., 2017b).
Each sensor was mounted in a GMR reading station and a baseline signal was recorded at room temperature for 1 min. Afterwards, 50 μL of MNPs were added to the sensor surface and DNA hybridization signal was measured through the biotin-streptavidin labelling of surface bound PCR products. To prevent sample evaporation, 100 μL of mineral oil was used to seal the sample well over the GMR chip. After labelling (30 min), the temperature of the cartridge was regulated to 20 °C and then ramped to 85 °C at a rate of 0.05 °C/s. During temperature ramping, loss of GMR signal was measured. Afterwards, a second identical ramp was measured as reference to correct temperature dependency of the sensor as described previously (Hall et al., 2010b). Briefly, the signal AMR measured during melting temperature was corrected using the reference ramp and was normalized by the signal ΔMR0 measured at the beginning of the temperature ramp (20 °C). The melting curves were binned in 1 °C intervals to align melting from sensors with the same functionalization. The melting temperature Tm was defined as the temperature at which the normalized signal ΔMR/ΔMR0 crossed the value 0.5 and it was obtained by fitting a 4th order polynomial to a 10-point region of the melting curve of each sensor near the crossing point.
3. Results
3.1. Methylation sensitive melting curve analysis
Serial dilutions of 50 ng → 50 pg of bisulfite converted EST164 DNA (MRARB) into a constant amount of 50 ng of bisulfite converted EST094 DNA (uMRARB) were performed to achieve mixtures of 100%, 10%, 1%, and 0.1% MRARB, in addition to a sample of 0% MRARB. These DNA mixtures were then amplified with methylation specific primers at three different annealing temperatures, 59 °C, 62 °C, and 64 °C, which were chosen following a temperature gradient of the RARB primers from 56 °C → 64 °C, followed by melt analysis of the amplicon. Across all three annealing temperatures (Fig. 2), the 100% methylated RARB showed a single peak in dF/dT indicating a Tm = 81 °C, and the 0% methylated RARB had a Tm = 77.5 °C. Melting curve analysis of the intermediate 10% and 1% mixtures shows a broad peak, which we resolve to two peaks with Tm = 77.5 °C and Tm = 81 °C, indicating a mixture of methylated and unmethylated RARB. Melting curve analysis of the 0.1% mixture gives a narrower peak at Tm = 77.5 °C, with a small shoulder at Tm = 81 °C for the highest annealing temperature.
Figure 2:
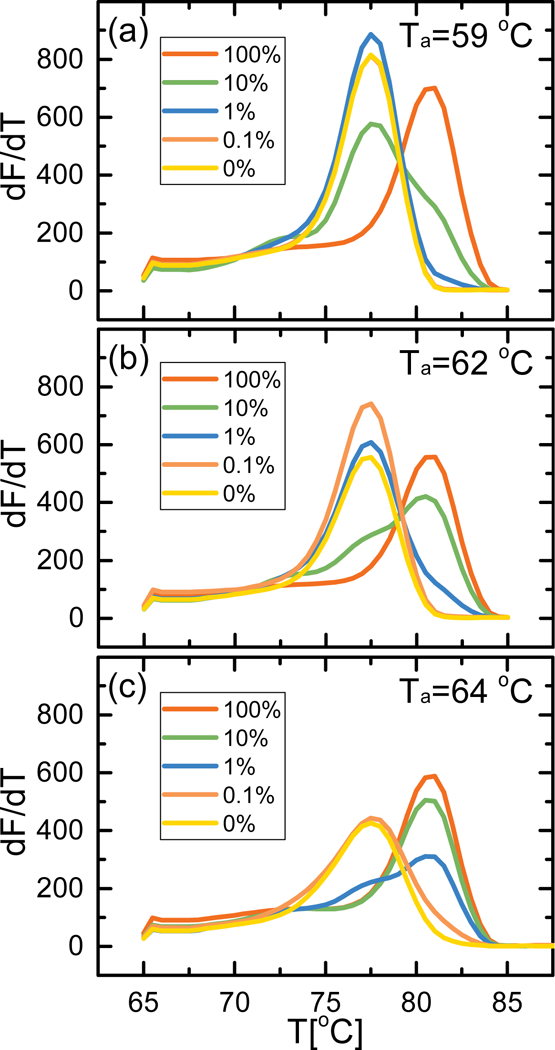
EvaGreen melt analysis of single-plex RARB methylation specific PCR for EST164/EST094 dilution series at annealing temperatures Ta = 59 °C (a), 62 °C (b), and 64 °C (c). The peak at Tm = 81 °C corresponds to MRARB, the peak at Tm = 77.5 °C corresponds to uMRARB.
For intermediate mixtures, we can estimate how the ratio of MRARB:uMRARB is affected by annealing temperature based upon the relative heights of the two resolved peaks in the melting curve analysis. At the lowest annealing temperature (Fig. 2a), starting with 10% methylated RARB gave a small peak at 81 °C with a higher peak at 77.5 °C, indicating a larger proportion of unmethylated DNA in the final product. At 1% methylated RARB the Tm of the amplicon was equivalent to that of 0% methylated RARB, while 0.1% methylated RARB almost completely overlapped the melt curve of 0% methylated RARB, making them all essentially indiscernible from each other. At an intermediate annealing temperature of 62 °C (Fig. 2b), the 10% methylated RARB sample still presented two peaks with their relative magnitude indicating a larger proportion of methylated DNA post-MSP. The 1% methylated RARB sample had a prominent peak at 77.5 °C and only a small shoulder at 81 °C, but we cannot definitively say it is indicative of the presence of methylated RARB. The highest annealing temperature (Fig. 2c) showed prominent peaks at 81 °C for both the 10% methylated and 1% methylated samples; mixtures with lower ratios of methylated RARB are indistinguishable from the unmethylated sample.
3.2. GMR melting curves
The MSP products from the serial dilutions described in section 3.1 were analyzed on the GMR sensor as depicted in Figure 1. A volume of 5 μL of each product was denatured and hybridized to the methylation specific probes tethered to the GMR sensor surface. Two probes, complementary to the Methylated (M) and unMethylated (uM) sequences were used. After magnetic labelling of the biotinylated target amplicons, we measured the DNA melting curve by ramping the temperature of the sensor from 20 °C to 85 °C. Figure 3 reports the measured melting curves for MSP reactions run at the intermediate annealing temperature of 62 °C for samples with 100%, 1% and 0% methylated RARB in unmethylated background (melting curves for 10% and 0.1% methylated RARB samples are omitted for space, but values of ΔTm can be found in Figure 4). Because hybridization of the biotinylated amplicon to the GMR probes occurs at high salt concentrations and moderate temperature, these conditions are not stringent enough to prevent nonspecific hybridization between the methylated GMR probe and the unmethylated MSP product and vice versa. During melting, these C/T mismatches manifest in large differences in Tm between the two GMR probes. Therefore, for a fully methylated sample (Fig. 3a), the perfect complementarity between the MSP product and the methylated probe results in a high Tm for the M probe; numerous C/T mismatches between the methylated sample and the unmethylated GMR probe lead to a reduced Tm for the uM probe.
Figure 3:
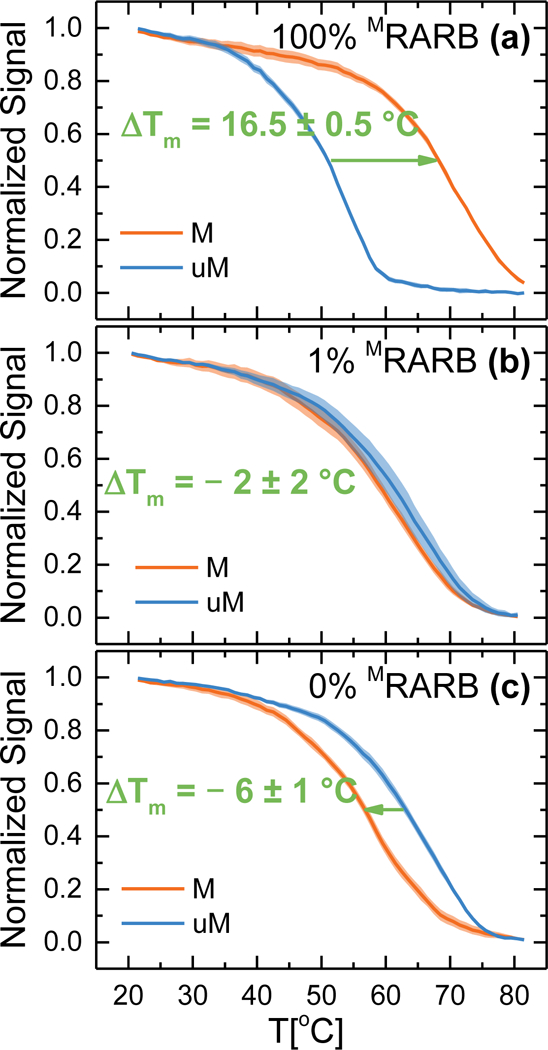
DNA melting curves measured on GMR sensors. Target DNA hybridized to surface tethered probes was denatured with a temperature ramp from 20 to 85 °C. Curves measured for (a) 100% mRARB (b) 1% mRARB and (c) 0% mRARB. ΔTm is defined as the difference between melting curve of the DNA hybridized to the M and uM probes. ΔTm varies with the content of methylated target. Melt curves for 10% and 0.1% methylated RARB are not pictured, values of ΔTm can be found in Figure 4.The colored regions represent one standard deviation interval from the mean for n = 6 sensors.
Figure 4:
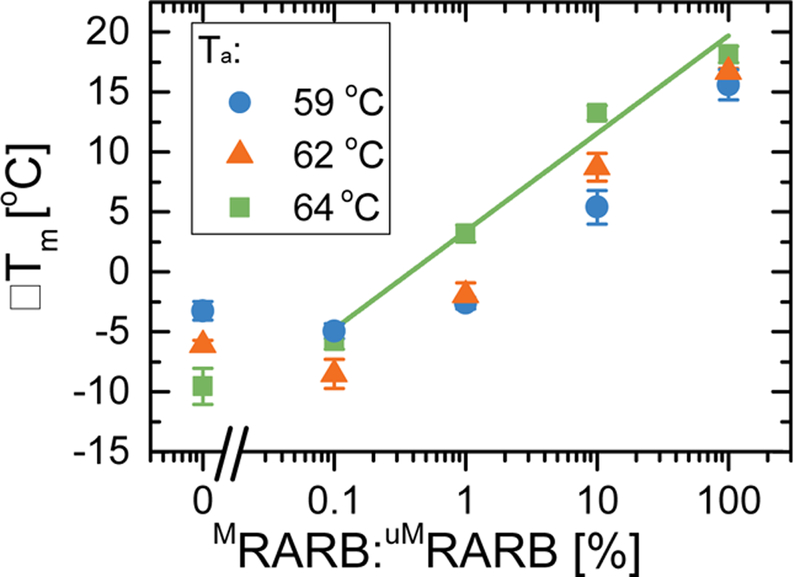
Plot of ΔTm versus semi-logarithmic percentage of initial methylated DNA prior to MSP for annealing temperatures Ta = 59 °C, 62 °C, and 64 °C. Error bars are given as standard error of the mean for n = 6 sensors. Linear regression of these results is shown for Ta = 64 °C.
Following the procedure of Rizzi et al. (2017a), we define the melting temperature (Tm) for each probe as the temperature at which the GMR signal is half the initial value, and ΔTm = TmM probe - TmuM probe, such that a positive ΔTm as in Figure 3a (ΔTm = 16.5 ± 0.5 °C ) indicates a larger proportion of methylated DNA in the sample. When a pure unmethylated sample was measured (Fig. 3c), melting curves for M and uM probes were inverted, with ΔTm = - 6 ± 1 °C thus indicating an unmethylated sample. When a mixture of 1% MRARB in uMRARB was used (Fig. 3b), the distance between the two curves was reduced (ΔTm = - 2 ± 2°C) but still significantly different from the unmethylated sample. In the following paragraph this analysis is repeated to take into consideration a broader number of MRARB ratios and different annealing conditions during MSP.
3.3. ΔTm vs methylation ratio
The same biotinylated MSP mixtures from section 3.1 (Fig. 2) were analyzed on the GMR platform via melt analysis for RARB following the same procedure outlined in section 3.2. The obtained ΔTm values are shown in Figure 4, error bars are standard errors from n = 6 identical sensors measured for each data point. We measured ratios of MRARB in uMRARB from 100% to 0%. Three different amplification conditions were tested, with annealing temperatures Ta=59 °C, 62 °C, and 64 °C. The ΔTm values showed a linear trend with the logarithmic ratio of MRARB for all the tested values of Ta. A linear regression of the semi-logarithmic data gave R = 0.78, 0.99 and 0.96 for Ta =59 °C, 62 °C, and 64 °C, respectively (fitting parameters in Supplementary Information Table S3). The line of best fit is shown only for Ta = 64 °C (fits for Ta = 59 °C and Ta = 62 °C are shown in Figure S1). The highest annealing temperature gave higher ΔTm at all tested ratios, indicating that the MSP amplification was more sensitive towards methylation. The values of ΔTm for Ta = 59 °C and 62 °C settled at about ΔTm = −5 °C for the smallest measured ratios (<0.1%). We consider two samples “distinguishable” if the ΔTm’s are significantly different, thus only for Ta = 64 °C can we distinguish 0.1% and 0% methylated samples. As Figure 4 shows, this is not possible for Ta = 62 °C, as the 0.1% methylation and 0% methylation samples have ATm that are within error of each other, for Ta = 59 °C, this occurs for both 1% and 0.1% methylation. These samples are considered “false negatives” as the increased amplification of the unmethylated target during MSP masks the minute presence of methylated target, rendering the GMR melt analysis indistinguishable from 0% methylation. The highest annealing temperature offered the lowest limit of detection of 0.1% methylation while maintaining the full dynamic range for methylation density quantitation.
3.4. Multiplexing methylation specific PCR and GMR melt analysis
Figure 5a and 5b show the results of multiplexed MSP binding curves on the GMR sensor and melt analysis, respectively. Multiplex MSP was performed on 50 ng of EST045, which is doubly methylated in both RARB and KIT, in a single tube. Based on single-plex standard melt analysis, mRARB and MKIT both have a Tm = 81 °C (Supplementary Information Figure S1). Melt analysis of the multiplexed MSP (Fig. 5b, inset) showed a single peak in dF/dT with Tm = 81°C, but these data alone do not indicate whether the final product is MRARB, MKIT, or a mixture of the two. The binding curves on a multiplexed GMR chip show signal for both RARB and KIT (Fig. 5a), confirming the presence of both genes. Additionally, melt analysis of the two probes (Fig. 5b) gives a ATm = 15.5 ± 0.5 °C for RARB and a ΔTm = 11.6 ± 4 °C for KIT, indicative of methylated RARB and KIT based upon the positive value of ΔTm. The higher standard deviation for the uM KIT probe is likely due to weak binding with methylated KIT MSP amplicon, leading to a larger spread in melting temperatures.
Figure 5:
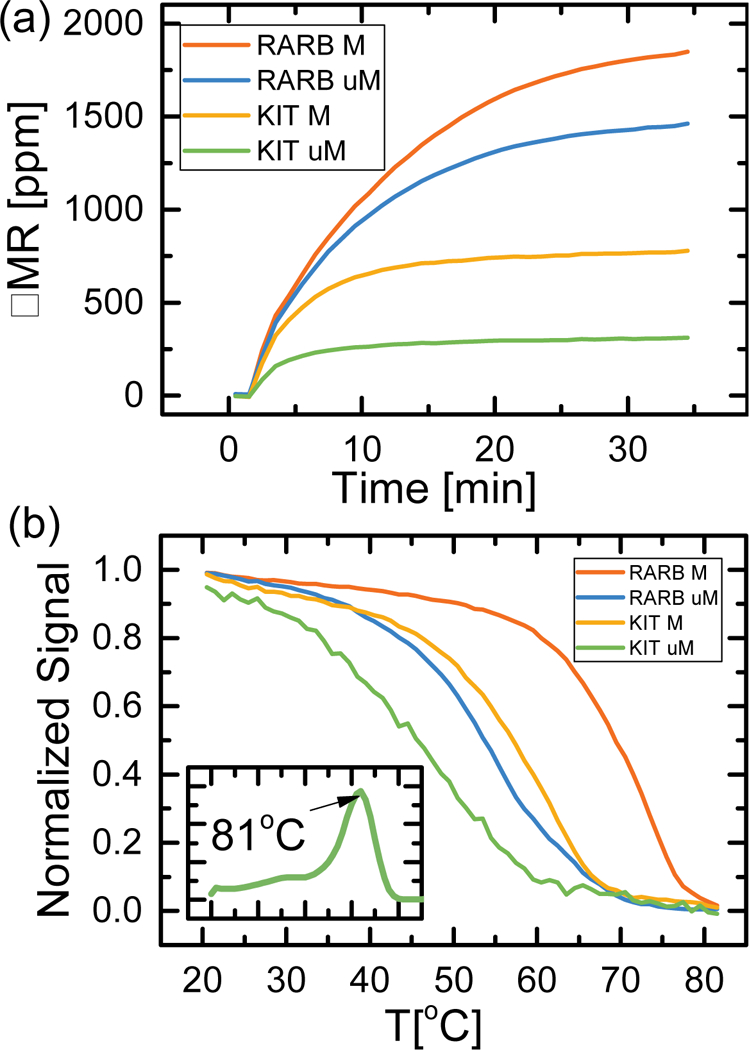
(a) GMR binding curves for multiplexed RARB/KIT methylation specific PCR on 50 ng EST045 (MRARB/MKIT) at Ta = 59 °C. Synthetic DNA probes corresponding to methylated and unmethylated RARB/KIT were spotted on one GMR chip. (b) Normalized GMR signal from the binding curves of 5a was measured while ramping temperature from 20 °C to 85 °C. Inset: EvaGreen melt analysis of the multiplexed RARB/KIT methylation specific PCR gives one peak at Tm = 81 °C. The colored regions represent one standard deviation interval from the mean for n = 6 sensors.
4. Discussion
From these results, there is a clear trend that higher annealing temperatures selectively amplify methylated RARB over unmethylated RARB and considerably change the ratio of methylated:unmethylated RARB compared to pre-MSP. This allows for more sensitive probing of methylation status - by standard EvaGreen melt analysis at 59 °C and 62 °C annealing temperatures, we can only detect methylated RARB if it is more than 10% of the initial sample, but at a higher annealing temperature more selective conditions enhance this sensitivity to detect methylated RARB in 1% of the initial sample. Methylation detection by GMR melt analysis further enhances this sensitivity by an order of magnitude, allowing us to detect methylation in 0.1% of a sample. Compared to other commonly used methods for methylation analysis, our technology is an order-of-magnitude more sensitive than pyrosequencing, and on-par with WGBS. In early cancer patients, methylated ctDNA can comprise as little as 0.1% of total cfDNA, thus integrating MSP to our GMR platform makes our technology sensitive enough to detect ctDNA for early cancer diagnosis in clinical plasma samples. Additionally, our GMR technology can quantify the initial ratio of hypermethylated DNA in a sample, even when using biased MSP amplification for enhanced sensitivity, which can have important applications in diagnosis and prognosis of patients (Phallen et al., 2017; Xu et al., 2017).
We believe achieving sensitivity of 0.1% methylation is possible due to the multiple differentially methylated CpG sites in the promoter region that allow us to bias our PCR with methylation specific primers without losing information of methylation status. Our forward and reverse methylation specific primers contain multiple CpG sites to allow for greater specificity during amplification. Additionally, the region of the amplicon between the forward and reverse primers contains additional CpG sites to probe with our GMR sensor for enhanced sensitivity.
Functionalizing our GMR sensors with probes for RARB and KIT allows multiplexing ability for MSP. While standard melt analysis using SYBR Green or EvaGreen is traditionally performed in single-plex due to the nonspecificity of the intercalating fluorophore, this is not feasible in clinical settings when testing a panel of markers due to low copy numbers of ctDNA and restrictive patient sample volumes. The ability of our platform to distinguish individual species in a mixture of PCR products, despite their overlapping Tm’s by EvaGreen melt analysis, is an important improvement in our technology. This finding is also very promising toward applying this technology in a clinical setting for testing panels of genes for cancer diagnosis, without the need for sequencing.
5. Conclusion
Integrating methylation specific PCR to our GMR platform for DNA hybridization allows for detection down to 0.1% methylated DNA in solution, which represents a 100-fold improvement in sensitivity compared to the previous results (Rizzi et al., 2017a) of GMR detection of MRARB. Our technology has achieved the analytical sensitivity necessary for detecting low copy numbers of ctDNA in early stage cancer patients. With the addition of multiplexing capabilities, we also have the ability to test multiple methylated plasma biomarkers for validation studies in a clinical setting. Future efforts to pursue include enhancing sensitivity to detect lower amounts of methylated target, increasing the number of targets in our multiplexed panel to five or more, and validating our assay in clinical patient samples.
Supplementary Material
Highlights:
-
−
GMR biosensors for detecting low fractions of methylated DNA
-
−
Detection of 0.1% methylated allelic fraction with methylation specific PCR
-
−
Multiplexed analysis without bisulfite deep sequencing
Acknowledgments
The authors are grateful towards Prof. Per Guldberg and the Danish Cancer Society Research Center for providing the melanoma cell line genomic DNA. We are also grateful to Prof. Jung- Rok Lee of Ewha Womans University in Seoul for designing the temperature controller system.
This work was supported by National Cancer Institute through Center for Cancer Nanotechnology Excellence on Translational Diagnostics (CCNE-TD, U54CA199075), NIAID (R01AI125197), and the Autoimmunity Center of Excellence (U19AI110491).
Footnotes
Conflict of Interest
The authors declare the following competing financial interest(s): S.X.W. have related patents or patent applications assigned to Stanford University and out-licensed for potential commercialization. S.X.W. has stock or stock options in MagArray, Inc., which has licensed relevant patents from Stanford University for commercialization of GMR nanosensor chips.
Publisher's Disclaimer: This is a PDF file of an unedited manuscript that has been accepted for publication. As a service to our customers we are providing this early version of the manuscript. The manuscript will undergo copyediting, typesetting, and review of the resulting proof before it is published in its final citable form. Please note that during the production process errors may be discovered which could affect the content, and all legal disclaimers that apply to the journal pertain.
References
- Aravanis AM, Lee M, Klausner RD, 2017. Next-Generation Sequencing of Circulating Tumor DNA for Early Cancer Detection. Cell 168, 571–574. https://doi.org/10.10167j.cell.2017.01.030 [DOI] [PubMed] [Google Scholar]
- Baylin SB, 2005. DNA methylation and gene silencing in cancer. Nat. Rev. Clin. Oncol. 2, S4–S11. https://doi.org/10.1038/ncponc0354 [DOI] [PubMed] [Google Scholar]
- Belinsky SA, 2005. Silencing of genes by promoter hypermethylation: key event in rodent and human lung cancer. Carcinogenesis 26, 1481–1487. https://doi.org/10.1093/carcin/bgi020 [DOI] [PubMed] [Google Scholar]
- Calapre L, Warburton L, Millward M, Ziman M, Gray ES, 2017. Circulating tumour DNA (ctDNA) as a liquid biopsy for melanoma. Cancer Lett. 404, 62–69. https://doi.org/10.1016/j.canlet.2017.06.030 [DOI] [PubMed] [Google Scholar]
- Chimonidou M, Strati A, Malamos N, Kouneli S, Georgoulias V, Lianidou E, Chimonidou M, Strati A, Malamos N, Kouneli S, Georgoulias V, Lianidou E, 2017. Direct comparison study of DNA methylation markers in EpCAM-positive circulating tumour cells, corresponding circulating tumour DNA, and paired primary tumours in breast cancer. Oncotarget 8, 72054–72068. https://doi.org/10.18632/oncotarget.18679 [DOI] [PMC free article] [PubMed] [Google Scholar]
- Dahl C, Abildgaard C, Riber-Hansen R, Steiniche T, Lade-Keller J, Guldberg P, 2015. KIT Is a Frequent Target for Epigenetic Silencing in Cutaneous Melanoma. J. Invest. Dermatol. 135, 516–524. https://doi.org/10.1038/jid.2014.372 [DOI] [PubMed] [Google Scholar]
- Dahl C, Christensen C, Jönsson G, Lorentzen A, Skjødt ML, Borg Å, Pawelec G, Guldberg P, 2013. Mutual Exclusivity Analysis of Genetic and Epigenetic Drivers in Melanoma Identifies a Link Between p14ARF and RARp Signaling. Mol. Cancer Res. 11, 1166–1178. https://doi.org/10.1158/1541-7786.MCR-13-0006 [DOI] [PubMed] [Google Scholar]
- Dahl C, Guldberg P, n.d. The genome and epigenome of malignant melanoma. APMIS 115, 1161–1176. https://doi.org/10.1111/j.1600-0463.2007.apm_855.xml.x [DOI] [PubMed] [Google Scholar]
- Earhart CM, Hughes CE, Gaster RS, Ooi CC, Wilson RJ, Zhou LY, Humke EW, Xu L, Wong DJ, Willingham SB, Schwartz EJ, Weissman IL, Jeffrey SS, Neal JW, Rohatgi R, Wakelee HA, Wang SX, 2013. Isolation and mutational analysis of circulating tumor cells from lung cancer patients with magnetic sifters and biochips. Lab. Chip 14, 78–88. https://doi.org/10.1039/C3LC50580D [DOI] [PMC free article] [PubMed] [Google Scholar]
- Gaster RS, Hall DA, Nielsen CH, Osterfeld SJ, Yu H, Mach KE, Wilson RJ, Murmann B, Liao JC, Gambhir SS, Wang SX, 2009. Matrix-insensitive protein assays push the limits of biosensors in medicine. Nat. Med. 15, 1327–1332. https://doi.org/10.1038/nm.2032 [DOI] [PMC free article] [PubMed] [Google Scholar]
- Gorgannezhad L, Umer M, Nazmul Islam M, Nguyen N-T, Shiddiky A, M. J, 2018. Circulating tumor DNA and liquid biopsy: opportunities, challenges, and recent advances in detection technologies. Lab. Chip 18, 1174–1196. https://doi.org/10.1039/C8LC00100F [DOI] [PubMed] [Google Scholar]
- Hall DA, Gaster RS, Lin T, Osterfeld SJ, Han S, Murmann B, Wang SX, 2010a.. GMR biosensor arrays: A system perspective. Biosens. Bioelectron. 25, 2051–2057. https://doi.org/10.1016Zj.bios.2010.01.038 [DOI] [PMC free article] [PubMed] [Google Scholar]
- Hall DA, Gaster RS, Osterfeld SJ, Murmann B, Wang SX, 2010b. GMR biosensor arrays: Correction techniques for reproducibility and enhanced sensitivity. Biosens. Bioelectron. 25, 2177–2181. https://doi.org/10.10167j.bios.2010.01.039 [DOI] [PMC free article] [PubMed] [Google Scholar]
- Han X, Wang J, Sun Y, 2017. Circulating Tumor DNA as Biomarkers for Cancer Detection. Genomics Proteomics Bioinformatics, Biomarkers for Human Diseases and Translational Medicine 15, 59–72. https://doi.org/10.1016/_j.gpb.2016.12.004 [DOI] [PMC free article] [PubMed] [Google Scholar]
- Hanahan D, Weinberg RA, 2011. Hallmarks of Cancer: The Next Generation. Cell 144, 646–674. https://doi.org/10.1016/_j.cell.2011.02.013 [DOI] [PubMed] [Google Scholar]
- Herman JG, Baylin SB, 2003. Gene Silencing in Cancer in Association with Promoter Hypermethylation. N. Engl. J. Med. 349, 2042–2054. https://doi.org/10.1056/NEJMra023075 [DOI] [PubMed] [Google Scholar]
- Hoque MO, Begum S, Topaloglu O, Jeronimo C, Mambo E, Westra WH, Califano JA, Sidransky D, 2004. Quantitative Detection of Promoter Hypermethylation of Multiple Genes in the Tumor, Urine, and Serum DNA of Patients with Renal Cancer. Cancer Res. 64, 5511–5517. https://doi.org/10.1158/0008-5472.CAN-04-0799 [DOI] [PubMed] [Google Scholar]
- Jahr S, Hentze H, Englisch S, Hardt D, Fackelmayer FO, Hesch R-D, Knippers R, 2001. DNA Fragments in the Blood Plasma of Cancer Patients: Quantitations and Evidence for Their Origin from Apoptotic and Necrotic Cells. Cancer Res. 61, 1659–1665. [PubMed] [Google Scholar]
- Kernaleguen M, Daviaud C, Shen Y, Bonnet E, Renault V, Deleuze J-F, Mauger F, Tost J, 2018. Whole-Genome Bisulfite Sequencing for the Analysis of Genome-Wide DNA Methylation and Hydroxymethylation Patterns at Single-Nucleotide Resolution, in: Editing Epigenome, Methods in Molecular Biology. Humana Press, New York, NY, pp. 311–349. https://doi.org/10.1007/978-1-4939-7774-1_18 [DOI] [PubMed] [Google Scholar]
- Kim H, Wang X, Jin P, 2018. Developing DNA methylation-based diagnostic biomarkers. J. Genet. Genomics 45, 87–97. https://doi.org/10.1016/jjgg.2018.02.003 [DOI] [PMC free article] [PubMed] [Google Scholar]
- Kurdyukov S, Bullock M, 2016. DNA Methylation Analysis: Choosing the Right Method. Biology 5, 3 https://doi.org/10.3390/biology5010003 [DOI] [PMC free article] [PubMed] [Google Scholar]
- Lanman RB, Mortimer SA, Zill OA, Sebisanovic D, Lopez R, Blau S, Collisson EA, Divers SG, Hoon DSB, Kopetz ES, Lee J, Nikolinakos PG, Baca AM, Kermani BG, Eltoukhy H, Talasaz A, 2015. Analytical and Clinical Validation of a Digital Sequencing Panel for Quantitative, Highly Accurate Evaluation of Cell-Free Circulating Tumor DNA. PLOS ONE 10, e0140712 https://doi.org/10.1371/journal.pone.0140712 [DOI] [PMC free article] [PubMed] [Google Scholar]
- Lee J-R, Choi J, Shultz TO, Wang SX, 2016a. Small Molecule Detection in Saliva Facilitates Portable Tests of Marijuana Abuse. Anal. Chem. 88, 7457–7461. https://doi.org/10.1021/acs.analchem.6b01688 [DOI] [PubMed] [Google Scholar]
- Lee J-R, Haddon DJ, Wand HE., Price JV, Diep VK, Hall DA, Petri M, Baechler EC, Balboni IM, Utz PJ, Wang SX, 2016b. Multiplex giant magnetoresistive biosensor microarrays identify interferon-associated autoantibodies in systemic lupus erythematosus. Sci. Rep. 6, 27623 https://doi.org/10.1038/srep27623 [DOI] [PMC free article] [PubMed] [Google Scholar]
- Mehrotra M, Singh RR, Loghavi S, Duose DY, Barkoh BA, Behrens C, Patel KP, Routbort MJ, Kopetz S, Broaddus RR, Medeiros LJ, Wistuba II, Luthra R, Mehrotra M, Singh RR, Loghavi S, Duose DY, Barkoh BA, Behrens C, Patel KP, Routbort MJ, Kopetz S, Broaddus RR, Medeiros LJ, Wistuba II, Luthra R, 2017. Detection of somatic mutations in cell-free DNA in plasma and correlation with overall survival in patients with solid tumors. Oncotarget 9, 10259–10271. https://doi.org/10.18632/oncotarget.21982 [DOI] [PMC free article] [PubMed] [Google Scholar]
- Olova N, Krueger F, Andrews S, Oxley D, Berrens RV, Branco MR, Reik W, 2018. Comparison of whole-genome bisulfite sequencing library preparation strategies identifies sources of biases affecting DNA methylation data. Genome Biol. 19, 33 https://doi.org/10.1186/s13059-018-1408-2 [DOI] [PMC free article] [PubMed] [Google Scholar]
- Ooki A, Maleki Z, Tsay J-CJ, Goparaju C, Brait M, Turaga N, Nam H-S, Rom WN, Pass HI, Sidransky D, Guerrero-Preston R, Hoque MO, 2017. A Panel of Novel Detection and Prognostic Methylated DNA Markers in Primary Non-Small Cell Lung Cancer and Serum DNA. Clin. Cancer Res. 23, 7141–7152. https://doi.org/10.1158/1078-0432.CCR-17-1222 [DOI] [PubMed] [Google Scholar]
- Phallen J, Sausen M, Adleff V, Leal A, Hruban C, White J, Anagnostou V, Fiksel J, Cristiano S, Papp E, Speir S, Reinert T, Orntoft M-BW, Woodward BD, Murphy D, Parpart-Li S, Riley D, Nesselbush M, Sengamalay N, Georgiadis A, Li QK, Madsen MR, Mortensen FV, Huiskens J, Punt C, Grieken N van, Fijneman R Meijer G, Husain H, Scharpf RB, Diaz LA, Jones S, Angiuoli S, 0rntoft T, Nielsen HJ, Andersen CL, Velculescu VE, 2017. Direct detection of early-stage cancers using circulating tumor DNA. Sci. Transl. Med. 9, eaan2415 https://doiorg/10.1126/scitranslmed.aan2415 [DOI] [PMC free article] [PubMed] [Google Scholar]
- Plongthongkum N, Diep DH, Zhang K, 2014. Advances in the profiling of DNA modifications: cytosine methylation and beyond. Nat. Rev. Genet. 15, 647–661. https://doi.org/10.1038/nrg3772 [DOI] [PubMed] [Google Scholar]
- Qin Z, Ljubimov VA, Zhou C, Tong Y, Liang J, 2016. Cell-free circulating tumor DNA in cancer. Chin. J. Cancer 35, 36 https://doi.org/10.1186/s40880-016-0092-4 [DOI] [PMC free article] [PubMed] [Google Scholar]
- Rizzi G, Lee J-R, Dahl C, Guldberg P, Dufva M, Wang SX, Hansen MF, 2017a. Simultaneous Profiling of DNA Mutation and Methylation by Melting Analysis Using Magnetoresistive Biosensor Array. ACS Nano 11, 8864–8870. https://doi.org/10.1021/acsnano.7b03053 [DOI] [PMC free article] [PubMed] [Google Scholar]
- Rizzi G, Lee J-R, Guldberg P, Dufva M, Wang SX, Hansen MF, 2017b. Denaturation strategies for detection of double stranded PCR products on GMR magnetic biosensor array. Biosens. Bioelectron., Special Issue Selected papers from the 26th Anniversary World Congress on Biosensors (Part II) 93, 155–160. https://doi.org/10.1016Zj.bios.2016.09.031 [DOI] [PubMed] [Google Scholar]
- Rizzi G, Westergaard Østerberg F, Dufva M, Fougt Hansen M, 2014. Magnetoresistive sensor for real-time single nucleotide polymorphism genotyping. Biosens. Bioelectron. 52, 445–451. https://doi.org/10.1016/j.bios.2013.09.026 [DOI] [PubMed] [Google Scholar]
- Shaw RJ, Akufo-Tetteh EK, Risk JM, Field JK, Liloglou T, 2006. Methylation enrichment pyrosequencing: combining the specificity of MSP with validation by pyrosequencing. Nucleic Acids Res. 34, e78–e78. https://doi.org/10.1093/nar/gkl424 [DOI] [PMC free article] [PubMed] [Google Scholar]
- Warton K, Mahon KL, Samimi G, 2016. Methylated circulating tumor DNA in blood: power in cancer prognosis and response. Endocr. Relat. Cancer 23, R157–R171. https://doi.org/10.1530/ERC-15-0369 [DOI] [PMC free article] [PubMed] [Google Scholar]
- Warton K, Samimi G, 2015. Methylation of cell-free circulating DNA in the diagnosis of cancer. Front. Mol. Biosci. 2 https://doi.org/10.3389/fmolb.2015.00013 [DOI] [PMC free article] [PubMed] [Google Scholar]
- Wojdacz TK, Dobrovic A, 2007. Methylation-sensitive high resolution melting (MS-HRM): a new approach for sensitive and high-throughput assessment of methylation. Nucleic Acids Res. 35, e41 https://doi.org/10.1093/nar/gkm013 [DOI] [PMC free article] [PubMed] [Google Scholar]
- Wojdacz TK, Hansen LL, Dobrovic A, 2008. A new approach to primer design for the control of PCR bias in methylation studies. BMC Res. Notes 1, 54 https://doi.org/10.1186/1756-0500-1-54 [DOI] [PMC free article] [PubMed] [Google Scholar]
- Worm J, Aggerholm A, Guldberg P, 2001. In-Tube DNA Methylation Profiling by Fluorescence Melting Curve Analysis. Clin. Chem. 47, 1183–1189. [PubMed] [Google Scholar]
- Xu L, Yu H, Akhras MS, Han S-J, Osterfeld S, White RL, Pourmand N, Wang SX, 2008. Giant magnetoresistive biochip for DNA detection and HPV genotyping. Biosens. Bioelectron. 24, 99–103. https://doi.org/10.1016Zj.bios.2008.03.030 [DOI] [PMC free article] [PubMed] [Google Scholar]
- Xu R, Wei W, Krawczyk M, Wang W, Luo H, Flagg K, Yi S, Shi W, Quan Q, Li K, Zheng L, Zhang H, Caughey BA, Zhao Q, Hou J, Zhang R, Xu Y, Cai H, Li G, Hou R, Zhong Z, Lin D, Fu X,Zhu Jie, Duan Y, Yu M, Ying B, Zhang W, Wang J, Zhang E, Zhang C, Li O, Guo R, Carter H, Zhu Jian-kang, Hao X, Zhang K, 2017. Circulating tumour DNA methylation markers for diagnosis and prognosis of hepatocellular carcinoma. Nat. Mater. 16, 1155–1161. https://doi.org/10.1038/nmat4997 [DOI] [PubMed] [Google Scholar]
- Ziller MJ, Hansen KD, Meissner A, Aryee MJ, 2015. Coverage recommendations for methylation analysis by whole-genome bisulfite sequencing. Nat. Methods 12, 230–232. https://doi.org/10.1038/nmeth.3152 [DOI] [PMC free article] [PubMed] [Google Scholar]
Associated Data
This section collects any data citations, data availability statements, or supplementary materials included in this article.