

Summary
Fatty acid synthase (FASN) predominantly generates straight-chain fatty acids using acetyl-CoA as the initiating substrate. However, monomethyl branched-chain fatty acids (mmBCFAs) are also present in mammals but thought to be primarily diet-derived. Here we demonstrate that mmBCFAs are de novo synthesized via mitochondrial BCAA catabolism, exported to the cytosol by adipose-specific expression of carnitine acetyltransferase (CrAT), and elongated by FASN. Brown fat exhibits the highest BCAA catabolic and mmBCFA synthesis fluxes, whereas these lipids are largely absent from liver and brain. mmBCFA synthesis is also sustained in the absence of microbiota. We identify hypoxia as a potent suppressor of BCAA catabolism that decreases mmBCFA synthesis in obese adipose tissue, such that mmBCFAs are significantly decreased in obese animals. These results identify adipose tissue mmBCFA synthesis as a novel link between BCAA metabolism and lipogenesis, highlighting roles for CrAT and FASN promiscuity that influence acyl-chain diversity in the lipidome.
Keywords: Branched-chain amino acids, de novo lipogenesis, brown adipocytes, white adipocytes, metabolic flux analysis, branched-chain fatty acids, odd-chain fatty acids, fatty acid synthase, obesity, liver, adipose tissue, short-chain fatty acids, hypoxia, carnitine acetyl transferase
Introduction
The branched-chain amino acids (BCAAs) leucine, isoleucine, and valine are essential amino acids important for protein synthesis, signaling, and bioenergetics. BCAA catabolism is emerging as a prominently dysregulated pathway in metabolic syndrome1,2 and cancer3; as such, a greater and more quantitative understanding of this pathway in mammalian physiology is needed. BCAA catabolism is initiated by de-amination via branched chain amino acid transferases (BCATs), and these branched-chain keto acids are subsequently metabolized in mitochondria to generate various acyl-CoA species downstream of the branched-chain keto-acid dehydrogenase (BCKDH) complex. This pathway is active in both energetically demanding tissues such as heart and muscle as well as lipogenic tissues4. Indeed, studies indicate that adipose BCAA catabolism can compensate for whole-body genetic deficiencies in the pathway5. Furthermore, carbon from leucine and isoleucine contribute significantly to de novo lipogenesis in differentiated adipocytes6,7, suggesting adipose tissue BCAA catabolism may be important for adipocyte function.
The predominant product of de novo lipogenesis in mammals is the saturated 16-carbon fatty acid (FA) palmitate, which is further elongated and/or desaturated in a tissue-specific manner. Both odd-chain (OCFAs) and monomethyl branched-chain (mmBCFAs) FAs are also present in mammals, but these species are considered to be predominantly diet-derived outside of the skin8,9. In lower organisms mmBCFAs are important for controlling membrane fluidity10 and contribute to neural development11. In mammals, mmBCFAs are found in milk12, sebum13, and vernix14, and mmBCFA levels differ in obese and insulin resistant patients15,16. However, little is known about the metabolism of BCFAs in mammals. Here we demonstrate that mmBCFAs are endogenous products of fatty acid synthase (FASN) and their in vivo synthesis is influenced by mitochondrial BCAA catabolism, tissue-specific expression of carnitine acetyltransferase (Crat), the microbiome, hypoxia, and diet. mmBCFAs are primarily synthesized in adipose depots and decreased in the context of diet-induced obesity, where adipose-specific hypoxia potently suppresses BCAA catabolism and lipogenesis. These results identify a metabolic pathway in mammals connecting BCAA metabolism and lipid biosynthesis to acyl-chain diversity that is coordinated across distinct tissues and potently regulated by hypoxia.
Results
Mammalian adipocytes synthesize mmBCFAs via FASN
Adipocytes undergo substantial mitochondrial and cytosolic metabolic reprogramming upon differentiation. We and others have previously shown that a distinct feature of this metabolic reprogramming is upregulation of BCAA catabolism, which becomes a significant source of carbon for both TCA cycle metabolism and lipogenic acetyl-CoA6,7,17. In cultured adipocytes, odd-chain FAs (C15:0 and C17:0) synthesized from valine and isoleucine-derived propionyl-CoA can also accumulate due to vitamin B12 deficiency and decreased activity of the B12-dependent enzyme methylmalonyl-CoA mutase6,7. In addition to the increased BCAA catabolism and OCFA synthesis observed in differentiated 3T3L1 adipocytes, we detected accumulation of several mass isomers of the FAs C16:0 (palmitate) and C17:0 (heptadecanoate), which eluted before the predominant straight-chain isomers in our gas chromatography-mass spectrometry (GC-MS) analysis. As compromised B12 metabolism can lead to accumulation of monomethyl branched-chain FAs (mmBCFAs) in the brain18, we hypothesized that these alternate mass isomers were mmBCFAs and subsequently used analytical standards to confirm their identities. We detected increases in 14-methylpentadecanoate (iso-C16:0), 14-methylhexadecanoate (anteiso-C17:0) and 15-methylhexadecanoate (iso-C17:0) during differentiation of 3T3L1 adipocytes, with iso-C16:0 occurring at the highest abundance (Fig 1a). These FAs have a single branch at either the penultimate or antepenultimate carbon of the acyl chain (Supplementary Figure 1a), with the position impacting elution times (Supplementary Table 1). Interestingly, the relative abundance of anteiso-C17:0 was impacted by B12 availability in this culture system (Fig 1b), suggesting that these species were actively metabolized by adipocytes.
Figure 1. Mammalian adipocytes synthesize mmBCFAs via fatty acid synthase.

a. mmBCFA abundance in differentiating 3T3L1 adipocytes. b. mmBCFA abundance in 3T3L1 adipocytes differentiated for 7 days +/− 500 nM B12. Two-tailed students t-test was performed on three cellular replicates (p=0.000019) with no adjustment for multiple comparisons. c. Atom-transition map demonstrating isotope incorporation into de novo synthesized fatty acids from [U-13C6]glucose. Closed circles indicate 13C carbon. d. Isotopologue distribution of iso-C16:0 from [U-13C6]glucose traced 3T3L1 cells. e. % enrichment from [U-13C6]isoleucine-derived acetyl-CoA (M1-M2 only) in 3T3L1 adipocytes +/− 100 nM ND646 for 24 hours. f. Atom-transition map depicting transfer of isotope [3-2H]glucose through glycolysis, the pentose phosphate pathway and reductive biosynthesis. Open circles indicate carbon and small red circles indicate deuterium label from [3-2H]glucose. g. Contribution from [3-2H]glucose labelled NADPH to fatty acid de novo synthesis determined via ISA. 3T3L1 adipocytes cultured in tracer for 72 hours. h, Iso-C16:0 levels as % total FA in pooled CRISPR/Cas9 FASN KO 3T3L1 adipocytes following addition of isobutyrate for 24 hours. i. Relative abundances of mmBCFAs and C16:0 in differentiated 3T3L1s following addition of isobutyrate for 24 hours. Two-tailed students t-test was performed on three cellular replicates for each comparison with no adjustment for multiple comparisons. All data are presented as means ± SEM with dot plots overlaid except for g, where 95% confidence intervals from ISA model are shown. All data are representative of three cellular replicates, and each experiment was repeated 3 independent times with the exception of h, where two separate infections were carried out. The same result was obtained in each independent experiment. *p<0.05, **p<0.01, ***p<0.001.
To determine whether mmBCFAs were synthesized de novo, we cultured 3T3L1 adipocytes with [U-13C6]glucose, which generates 13C fully labeled acetyl-CoA units and a distinct M+2 isotopologue pattern in newly synthesized FAs (Fig 1c, Supplementary Figure 1b). We detected significant enrichment in mmBCFAs (Fig 1d, Supplementary Figure 1c-d), demonstrating that these FAs are synthesized in a similar manner to palmitate via acetyl-CoA incorporation. Additionally, treatment with the ACC inhibitor ND64619 led to a significant decrease in 13C enrichment of both straight-chain and mmBCFAs, indicating their synthesis is dependent on malonyl-CoA from ACC (Fig 1e).
While cytosolic FASN is the predominant enzyme used for de novo lipogenesis in mammalian cells, mitochondrial FAS II has been proposed as a hypothetical route for mmBCFA synthesis in eukaryotes20. To determine whether the cellular location of mmBCFA synthesis differed from that of palmitate we traced adipocytes with [3-2H]glucose. Deuterium labeling on the third carbon of glucose specifically labels cytosolic NADPH via the oxidative pentose phosphate pathway but is lost in glycolysis and does not label citrate, acetyl-CoA or mitochondrial NADPH (Fig 1f)21. If a significant portion of mmBCFAs were synthesized within mitochondria, decreased 2H enrichment relative to palmitate would be expected. We found cytosolic NADPH effectively labelled both mmBCFAs and palmitate, suggesting these FAs were primarily synthesized in the cytosol by FASN (Fig 1g), albeit at slower rates than palmitate (Supplementary Figure 1e-f). Next, we generated pooled cultures of 3T3L1 adipocytes with CRISPR/Cas9 mediated FASN knockout (KO) prior to differentiation (Supplementary Figure 2a-b). While the abundance of all FAs decreased, mmBCFAs were undetectable in all FASN KO cells but abundant in sgNT cells (Fig 1h). However, differentiation was significantly impaired (Supplementary Figure 2c). To further confirm that FASN deficiency rather than impaired differentiation and lack of substrate decreased BCFA synthesis, we supplemented cultures with the short-branched chain FAs isobutyrate, isovalerate, 2-methyl-butyrate, and propionate. Addition of these substrates increased mmBCFA and OCFA abundances in a dose-dependent manner (Fig 1i, Supplementary Figure 1d-f). While iso-C16:0 levels significantly increased in control adipocytes and non-differentiated pre-adipocytes upon addition of isobutyrate, iso-C16:0 levels were still undetectable in FASN KO cells (Supplementary Figure 2g), indicating that lack of FASN rather than impaired differentiation was the primary reason for the absence of BCFA synthesis. Furthermore, treatment with the FASN inhibitor TVB3166 significantly decreased synthesis of both iso-C16:0 and palmitate (Supplementary Figure 2h). While the mitochondrial FAS II system may also contribute to mmBCFA synthesis, our results demonstrate that cytosolic de novo lipogenesis via FASN promiscuity is the primary driver of mmBCFA production in adipocytes22.
BCAA catabolic intermediates drive mmBCFA synthesis
The minor impact of B12 availability on iso-C16:0 and iso-C17:0 suggests that these FAs are not synthesized via elongation of methylmalonyl-CoA. Administration of radioisotopes to rats has indicated that BCAAs are precursors for mmBCFAs in skin23. In addition, provision of isovaleryl-CoA, isobutyryl-CoA or 2-methylbutyryl-CoA to enzyme extracts from rat epididymal tissue results in the production of mmBCFAs22. To confirm this pathway architecture exists within intact adipocytes we cultured adipocytes with uniformly 13C-labeled BCAAs and quantified labeling via GC-MS. This resulted in distinct labeling patterns for each of their respective mmBCFAs (Fig 2a-d). Carbon from [U-13C5]valine was only incorporated into iso-C16:0 and resulted in a prominent M+4 peak in the isotopologue distribution, indicating the valine catabolic intermediate isobutyryl-CoA was used to synthesize iso-C16:0 (Fig 2a-b). Similarly, iso-C17:0 from [U-13C6]leucine and anteiso-C17:0 from [U-13C6]isoleucine exhibited distinct M+5 shifts, indicating that isovaleryl-CoA and 2-methylbutyryl-CoA were used for mmBCFA synthesis (Fig 2a, c-d). Notably, we detected no FA isotopologues of M+8 or M+10, indicating that only a single incorporation of these branched intermediates into the acyl chain was occurring in these cells. This result, combined with the observation that only mmBCFAs with a branch at the penultimate or antepenultimate end were detected, supports a mechanism whereby FASN is promiscuous and can use short acyl-CoAs to initiate synthesis of long chain FAs.
Figure 2. BCAA catabolic intermediates drive mmBCFA synthesis.

a. Pathway depicting BCAA catabolism and mmBCFA synthesis. b-d. Isotopologue distributions of b, iso-C16:0 from [U-13C5]valine c, iso-C17:0 from [U-13C6]leucine and d, anteiso-C17:0 from [U-13C6]isoleucine. Representative data from three cell replicates in b-d. e-g. Relative abundance of e, iso-C16:0 f, iso-C17:0 and g, anteiso-C17:0 following knock down of ACAD enzymes. Representative data from six cell replicates in e-g. h. Relative mRNA expression. Representative data shown from three cell replicates. All experiments are carried out in 3T3L1 adipocytes. All experiments were repeated 3 independent times with similar results. Data are presented as means ± SEM with dot plots overlaid (b-d, h) or box (25th to 75th percentile with median line) and whiskers (min to max values) (e-g).
Multiple acyl-CoA dehydrogenases (ACAD) are annotated to carry out the dehydrogenations of isovaleryl-CoA, 2-methylbutyryl-CoA and isobutyryl-CoA. To evaluate the specific roles of these enzymes in BCAA catabolism and mmBCFA synthesis, we targeted various ACAD enzymes via shRNA-mediated knockdown and quantified FA abundances after adipocyte differentiation (Supplementary Figure 3a-c). Knockdown of ACAD8, IVD and ACADSB specifically and significantly increased levels of iso-C16:0, iso-C17:0 and anteiso-C17:0, respectively (Fig 2e-g, Supplementary Figure 3d-f). Targeting of ACADM and ACADS did not impact mmBCFA levels appreciably. Each mmBCFA accumulated differently, with valine-derived iso-C16:0 having the highest abundance (Fig 1a, Supplementary Figure 3d), inversely consistent with the relative expression of each dehydrogenase (Fig 2h). These findings indicate that ACAD enzyme expression influences the metabolic fate of BCAAs and mmBCFA production.
mmBCFAs are incorporated into distinct lipid species
The above data are representative of total hydrolyzed FA pools in the cell. To further characterize the metabolic fate of mmBCFAs, we next sought to determine whether mmBCFAs were incorporated into distinct lipid species. Distinguishing lipids containing different acyl chain isomers such as iso-C16:0 and C16:0 (palmitate) is challenging with liquid chromatography due to decreased isomer resolution compared to gas chromatography, and there have been limited reports of mmBCFAs in specific, intact lipids11,24. To circumvent this issue we utilized [U-13C5]valine tracing to differentiate lipids containing C16:0 versus iso-C16:0 acyl-chains, since lipids synthesized with the latter would contain distinct M+4 peaks (Supplementary Figure 4a-c). We quantified M+0 and M+4 isotopologue abundances using targeted LC-MS/MS in 46 lipid species containing 16-carbon acyl chains in adipocytes cultured with [U-13C5]valine or [12C]valine. Of those measured species, 11 lipids had significant enrichment of M+4 ions in [U13C5]valine-traced cells over [12C]valine-traced cells (Supplementary Figure 4d-e). The highest % total enrichments were observed in species containing alkyl chains, suggesting iso-C16:0 may be selectively incorporated into ether lipids. Notably, some BCFAs (e.g. phytanic acid) must be trafficked to the peroxisome for α-oxidation, and peroxisomes are the site for ether lipid synthesis due to the presence of alkyl DHAP synthase and DHAPAT. As such, mmBCFAs may be similarly directed to the peroxisome, leading to the observed high enrichment in abundant alkyl-lipids. Other significantly enriched lipids included sphingomyelin, phosphatidylserine, phosphatidylcholine, phosphatidylinositol and triacylglycerols (TAGs). In fact, induction of lipolysis via isoproterenol treatment resulted in significant mmBCFA secretion into culture medium indicating these FAs are present in lipid droplets (Supplementary Figure 4f).
mmBCFAs are de novo synthesized in vivo
To determine whether mmBCFA synthesis occurs in vivo, we quantified the abundances of each mmBCFA across various tissues in male and female C57BL/6J mice. Consistent with our observation of mmBCFA synthesis in adipocytes, white and brown adipose tissues (WAT and BAT) exhibited the highest abundances of all mmBCFAs, including iso-C18:0, an elongated derivative of iso-C16:0 that was not detectable in 3T3L1 cultures (Fig 3a-b, Supplementary Figure 5a-b). Liver and brain exhibited the lowest abundances of mmBCFAs, suggesting FA composition is regulated in a tissue-specific manner. In addition, iso-C17:0 abundance differed between males and females, potentially due to hormonal effects on BCAA catabolism25. With the exception of anteiso-C17:0, total mmBCFAs (free and lipid bound) were present in plasma at μM concentrations (Supplementary Figure 5c), and their abundances increased 2–3 fold in plasma upon prolonged fasting (Fig 3c, Supplementary Figure 5d). Although these measurements are of total rather than free FAs, these data suggest that iso-BCFAs are released from adipose tissue via lipolysis along with other FAs.
Figure 3. mmBCFAs are de novo synthesized in vivo a-b.
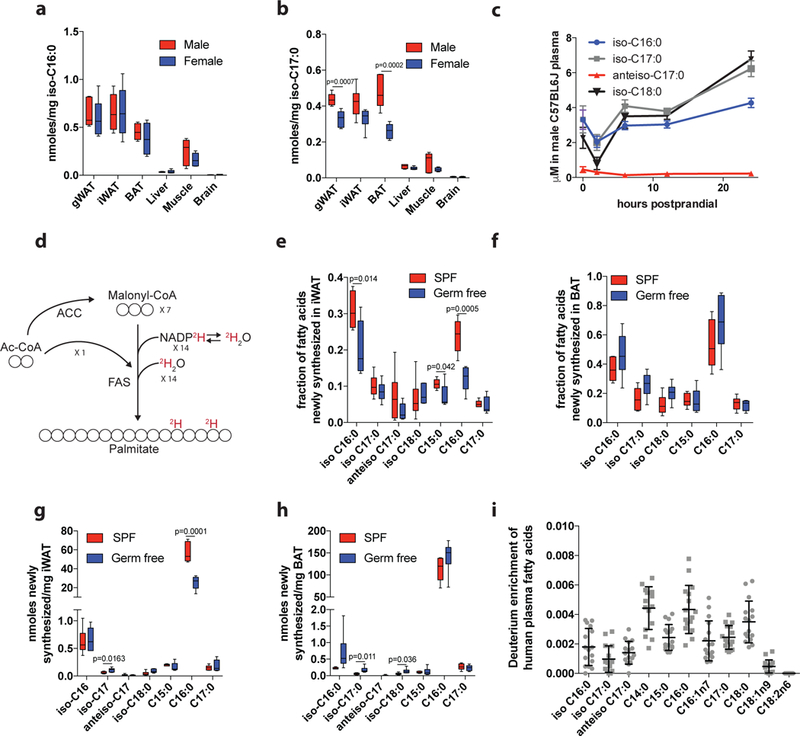
Abundance of a, iso-C16:0, and b, iso-C17:0, in various tissues from C57BL/6J male (n=6) and female mice (n=6). c. Plasma concentration of total hydrolyzed mmBCFAs from C57BL/6J male mice (n=8) following removal of food at time 0 (7 am) and sampled at 2hrs, 6hrs, 12hrs and 24hrs. d. Incorporation of 2H2O into newly synthesized fatty acids. e-f. Fractional synthesis of fatty acids in e, iWAT, and f, BAT of germ free (n=6) and SPF mice (n=6). g-h. Amount of newly synthesized fatty acids present in g, iWAT and h, BAT of germ free (n=6) and SPF mice (n=6). i. Deuterium enrichment of plasma FAs in NAFLD patients (n=16) normalized to the area under the curve of plasma 2H2O levels from day 0 to day 21 for each patient. Two-tailed students t-test was performed for each comparison in this figure with no adjustment for multiple comparisons. Data are presented as means ± SEM (c), means ± SD with dot plots overlaid (i), or box (25th to 75th percentile with median line) and whiskers (min to max values) (a-b,e-h).
As microbial metabolism is a source of both long and short BCFAs26,27 (Supplementary Figure 6a), the gut microbiome could be a significant source of mmBCFAs in animals. In addition, mmBCFAs are present in chow (Supplementary Figure 6b) and thus diet will also contribute to mmBCFA levels in vivo. To determine the relative contribution of de novo synthesis versus diet and the impact of microbiota on mmBCFA levels, we administered 2H2O to germ free and specific pathogen free (SPF) control mice for 8 days and measured enrichment of FAs in lipogenic tissues28 (Fig 3d). A significant fraction of the mmBCFAs present were newly synthesized in both germ free and SPF mice (Fig 3e-f, Supplementary Figure 6c-d). Valine-derived iso-C16:0 was the most abundantly synthesized mmBCFA (Fig 3g-h, Supplementary Figure 6e-f), and the fraction of newly synthesized iso-C16:0 was similar to that for palmitate (C16:0) in eWAT, iWAT and BAT (Fig 3e-f, Supplementary Figure 6c). Overall, these data indicate that de novo synthesis is a significant source of mmBCFAs in vivo, and their production can occur in the absence of microbiota. However, both levels (Supplementary Figure 6g-j) and synthesis of mmBCFAs and other FAs differed significantly in the adipose tissues of germ free and SPF mice, indicating that microbiota impacts lipogenesis and FA diversity.
To confirm that de novo synthesis of mmBCFAs occurs in humans, we analyzed plasma from NAFLD patients administered 2H2O (Supplementary Table 2 and Supplementary Figure 6k-l). Analysis of deuterium enrichment of FAs demonstrated that both OCFAs and mmBCFAs were synthesized de novo in humans (Fig 3i). Plasma mmBCFAs were present in the range of 1 – 20 μM in these patients (Supplementary Figure 6m), which is comparable to that of other long and very long chain FAs such as C20:0 and C24:029.
BCAA flux to mmBCFAs is decreased by diet-induced obesity
Clinical studies have indicated that BCAA metabolism is dysregulated in the context of metabolic syndrome, as plasma BCAAs and some catabolites are elevated in insulin resistant patients1,2. Additionally, BCAA catabolic enzyme expression is decreased in rodents fed a high-fat diet (HFD)17. Conversely, plasma mmBCFAs are decreased in morbidly obese patients15. To determine if mmBCFA levels change in mouse models of obesity, we quantified total FAs in plasma and WAT of mice fed a HFD or low-fat diet (LFD) for 15 weeks. Although intake of all FAs (including mmBCFAs) was increased in the HFD cohort (Supplementary Figure 7a), iso-BCFA abundances were significantly lower (Fig 4a-b, Supplementary Figure 7b-c). In terms of fold changes, valine-derived iso-C16:0 and iso-C18:0 were the most differentially abundant FAs in these tissues. Relative abundances of straight-chain FAs increased or remained unchanged, with the exceptions of C16:1 (palmitoleate) and C15:0 (Fig 4a). Similar results were observed in ob/ob mice, where mmBCFAs were significantly decreased in iWAT relative to control mice (Supplementary Figure 7d). Notably, anteiso-C17:0 levels increase in the plasma of HFD mice (Figure 4b). Given that synthesis of anteiso-C17:0 was nearly undetectable in 2H2O traced mice (Fig 3g-h), this FA is primarily diet-derived and synthesis from isoleucine is not significant in vivo. These results demonstrate that individual FAs change distinctly with the onset of obesity depending on their origin and metabolism.
Figure 4. BCAA flux to mmBCFAs is decreased by diet-induced obesity.

a. Relative abundances of FAs in iWAT from C57BL/6J mice fed HFD (n=4) or LFD (n=5) for 15 weeks. b. Total FAs abundances in plasma from C57BL/6J mice fed HFD (n=8) or LFD (n=8) for 15 weeks. c-f, 13C enrichment in specified metabolite from HFD or LFD with 25% of valine and leucine supplied as [U13C,15N]isotope.c. Citrate % 13C enrichment. N=8 for all comparisons except LFD iWAT (n=7), eWAT (n=7), BAT (n=7), heart (n=5) and HFD iWAT (n=4), BAT (n=7), heart (n=4). d. 13C molar enrichment of C16:0. N=8 for all comparisons except LFD eWAT (n=7), heart (n=5) and HFD iWAT (n=7). e. Isotopologue distribution of iso-C16:0 from [U-13C5]valine (HFD n=8, LFD n=8). f. 13C molar enrichment of iso-C16:0. N=8 for all comparisons except HFD iWAT (n=7), liver (n=5) and brain (n=6). Two-tailed students t-test was performed for each comparison in this figure with no adjustment for multiple comparisons. Data are presented as means ± SEM with dot plot overlaid (a-d, f) or box (25th to 75th percentile with median line) and whiskers (min to max values) (e).
To directly investigate altered BCAA catabolism in the context of metabolic syndrome, we fed C57BL/6J mice a HFD or LFD for 12 weeks followed by 3 weeks of feeding with identical diets formulated with 25% enriched [U-13C5,15N]valine and [U-13C6,15N]leucine (Supplementary Figure 8a). Although fasting plasma glucose levels were elevated (Supplementary Figure 8b), plasma BCAA levels were unchanged (Supplementary Figure 8c), consistent with recent studies in C57BL/6J mice,30 and we observed no differences in plasma leucine and valine enrichment (Supplementary Figure 8d). Significant differences were present within tissues, however (Supplementary Figure 8e-f). We detected significant 13C enrichment of citrate and palmitate in all tissues measured (Fig 4c-d), indicating leucine catabolism is a significant source of acetyl-CoA in vivo. In the HFD cohort, 13C enrichment and molar abundance in citrate and palmitate, respectively, were significantly decreased in all tissues, with BAT being the most impacted, demonstrating that diet-induced obesity decreases BCAA catabolism (Fig 4c-d). The leucine and valine-derived mmBCFAs had characteristic M+4 and M+5 mass shifts indicating these FAs were synthesized de novo from BCAAs in vivo (Fig 4e, Supplementary Figure 8g-h). Importantly, molar enrichment of iso-BCFAs from valine and leucine were decreased in total FA pools from almost all tissues analyzed (Fig 4f, Supplementary Figure 8i-j). The highest abundances of newly synthesized, long chain iso-BCFAs were present in brown adipose tissue, although cross-tissue transport is likely significant given the high FA enrichments detected in muscle and heart. Collectively, these data indicate that diet-induced obesity significantly decreases BCAA catabolic flux, and a downstream result of this regulation is lower mmBCFA synthesis and abundance throughout the body.
In contrast to mmBCFAs, we did not detect a pronounced M+3 shift in OCFAs (Supplementary Figure 8k), consistent with the abundance of other propionate sources in animals (e.g. gut microbes, OCFA oxidation, and cholesterol breakdown) or their production via α-oxidation31. While valine is a source of propionate in cultured adipocytes, this pathway is not a major source of OCFAs in vivo under normal physiological conditions6,7. However, we did note some incorporation of BCAA-derived carbon into OCFAs via acetyl-CoA (Supplementary Figure 8l-m) indicating that OCFAs are also de novo synthesized to some extent in vivo.
Adipose tissue mmBCFA synthesis is facilitated by CrAT
The above results demonstrate that BCAA catabolic flux contributes significantly to de novo lipogenesis in vivo, and mmBCFAs are abundant products of this pathway. The large (~10-fold) differences in abundance within liver and adipose tissues (Fig 3a-b) suggest that mmBCFA synthesis is regulated distinctly in these tissues. To assess the impact of diet on tissue-specific mmBCFA synthesis and enable comparison to synthesis of other FAs, we administered 2H2O to HFD and LFD mice and measured enrichment in lipogenic tissues. Newly synthesized iso-C16:0 and iso-C18:0 were decreased in livers of HFD mice more than any other FA in terms of fold-change (Fig 5a). In contrast, straight-chain and monounsaturated FA synthesis in the liver was increased or remained the same (Fig 5a, Supplementary Figure 9a). Within adipose tissues, HFD feeding decreased lipogenesis of all FAs, indicating pathway activity is generally suppressed (Fig 5b, Supplementary Figure 9b-d) as previously observed32,33. We next estimated FA synthesis/turnover occurring in each tissue based on the molar abundance of each FA, fraction synthesized, and length of time tracer was administered. mmBCFA turnover was highest in white and brown adipose tissues but substantially lower in liver (Fig 5c, Supplementary Figure 9e-g). While brown adipose tissue exhibited the highest synthesis/turnover for all FAs, these measurements are likely a lower estimate since they do not account for β-oxidation and futile FA cycling, which are likely quite high in brown adipocytes34. HFD suppressed the synthesis of all FAs in adipose tissues but increased palmitate synthesis/turnover in liver (Fig 5d). These results suggest that subcutaneous and brown adipocytes exhibit a high capacity for mmBCFA synthesis when lipogenesis is active in these depots (i.e. LFD). Indeed, mmBCFA synthesis in brown adipose tissue is significantly increased in cold-exposed mice (Fig 5e), similar to the increased de novo lipogenesis of other FAs34.
Figure 5. Adipose tissue mmBCFA synthesis is facilitated by CrAT a-b.
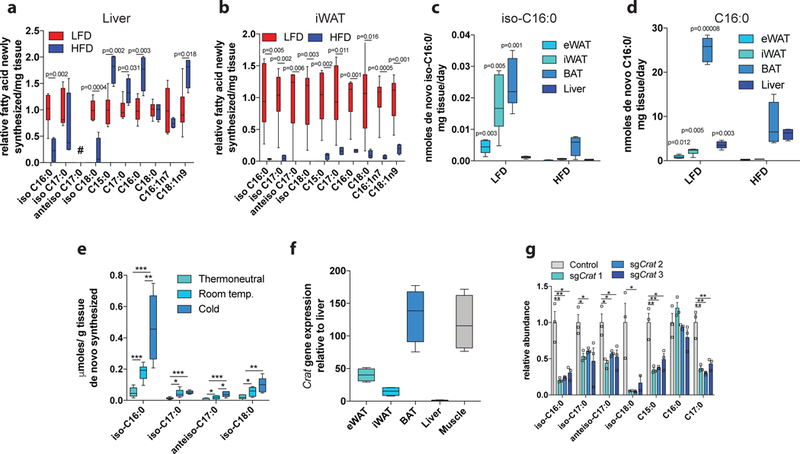
Fold difference in the levels of newly synthesized FAs present in a, liver and b, iWAT. LFD (n=6) and HFD (n=4) for all comparisons in a-b. c. De novo lipogenic turnover of iso-C16:0 across the primary lipogenic tissues. d. De novo lipogenic turnover of C16:0 across the primary lipogenic tissues. LFD (n=6) and HFD (n=4) for all comparisons in c-d except LFD BAT iso C16:0. P values indicate intra-tissue comparison between HFD and LFD. e. Amount of newly synthesized FAs in BAT of mice exposed to thermoneutral (30°C), room temperature (22°C), or acclimatized to severe cold (6°C) over 1 month, (n=6 per group). f. Crat expression relative to liver in tissues from male C57BL/6J mice (n=4). g. relative abundance of total FAs in pooled CRISPR/Cas9 Crat KO 3T3L1 adipocytes. Representative data from three cell replicates. Three independent infections have been carried out with the same result. Data is presented as box (25th to 75th percentile with median line) and whiskers (min to max values) (a-f) or means ± SEM with dot plots overlaid (g). Two-tailed students t-test was performed for each comparison in this figure with no adjustment for multiple comparisons. *p<0.05, **p<0.01, ***p<0.001.
Liver exhibited relatively low abundances of newly synthesized mmBCFAs compared to other lipogenic tissues, and these levels decreased further in response to HFD, which contrasts the changes observed for other FAs in the liver. Importantly, this tracing method does not account for lipid efflux and inter-tissue FA transport and thus likely underestimates absolute FA synthesis in liver. Nevertheless, our collective data on abundance and synthesis of all FAs strongly indicates that mmBCFAs are synthesized in adipose tissues but not liver.
BCAA catabolism and lipogenesis are highly active in liver, so we next attempted to address why mmBCFA synthesis is specific to adipose tissues. mmBCFA synthesis requires BCAA catabolic intermediates to be exported from the mitochondria into the cytosol for elongation by FASN. Prior studies have demonstrated that carnitine acetyltransferase (CrAT) but not carnitine palmitoyltransferase 2 (CPT2) exhibits enzyme activity towards BCAA-derived, short branched-chain CoAs35. Therefore, we hypothesized that CrAT facilitates mmBCFA synthesis in adipose tissues. Crat mRNA is expressed at low levels in liver but exhibits high expression in muscle and adipose tissues (Fig 5f). Additionally, quantitative proteomics indicates that CrAT is expressed at higher levels in white and brown adipose tissue compared to liver and brain (Supplementary Figure 10a)36. Thus, tissue-specific CrAT expression may be a driver of the observed differences in mmBCFA abundance and synthesis between liver, brain, and adipose tissues.
To more directly determine how CrAT influences mmBCFA synthesis we generated CrAT KO 3T3L1 cells using CRISPR/Cas9 (Supplementary Figure 10b). In contrast to results with FASN KO, CrAT KO did not appreciably impact adipogenesis (Supplementary Figure 10c-d). However, CrAT KO adipocytes had significantly decreased levels of both mmBCFAs and OCFAs (Fig 5g), with minimal differences in the levels of other FAs (Supplementary Figure 10e). These data indicate that CrAT is an important component of the mmBCFA synthesis pathway, facilitating cytosolic export of precursor acyl-CoAs (Supplementary Figure 10f). Differential expression of this enzyme in liver versus BAT and WAT likely contributes to the tissue specificity of mmBCFA synthesis and abundance.
Hypoxia suppresses BCAA catabolism and mmBCFA synthesis
Our data indicate that mmBCFAs are predominantly synthesized in adipose depots, decrease in the context of diet-induced obesity, and increase in plasma during prolonged fasting. Given the adipose origin of mmBCFAs, we sought to determine the physiological factors that drive decreased BCAA catabolism and mmBCFA synthesis in obesity in vivo. Hypoxia has been proposed as a key contributory factor to adipose tissue dysfunction in obesity37, and increasing adipose vascularization improves insulin sensitivity38. To test the impact of hypoxia on BCAA metabolism in adipocytes, we incubated differentiated 3T3L1 adipocytes in 1% oxygen for 24 hours before switching to hypoxia-equilibrated media containing uniformly 13C labeled amino acids or glucose for an additional 24 hours. Intracellular BCAAs and α-ketoisocaproate accumulated significantly in hypoxic cultures, along with lactate and 2-hydroxyglutarate (Fig 6a). Media analysis demonstrated that glycolytic flux increased along with net glutamine consumption, while BCAA uptake decreased approximately 3–4 fold (Fig 6b). Consistent with these flux changes, TCA intermediate enrichment from [U-13C]BCAAs was decreased under hypoxia (Fig 6c). Isotopomer spectral analysis (ISA) demonstrated that the relative contribution of leucine to lipogenic acetyl-CoA decreased significantly, whereas the glutamine contribution to FAs increased (Fig 6d). Notably, hypoxia generally decreased the synthesis of FAs, including OCFAs and mmBCFAs (Fig 6e). Collectively these data indicate that hypoxia strongly decreases BCAA catabolism. These results were recapitulated in primary cells derived from various tissues, including murine brown adipocytes and human skeletal myotubes and white adipocytes (Supplementary Figure 11a).
Figure 6. Hypoxia suppresses BCAA catabolism and mmBCFA synthesis in adipocytes.

a. Volcano plot of changes in metabolite abundance in 3T3L1 cells exposed to hypoxia (1% O2) or normoxia for 48 hours. 12 cell replicates. b. Glucose and amino acid uptake by 3T3L1 cells in hypoxia (1%) or normoxia. 14 cell replicates for lactate and glucose, 6 cell replicates for glutamine and glutamate, 3 cell replicates for leucine, isoleucine and valine. Two-tailed students t-test was performed for each comparison in a and b with no adjustment for multiple comparisons. c. Mole percent enrichment (MPE) of TCA intermediates from [U-13C] BCAAs in 3T3L1s following 24 hours of tracing in hypoxia (1%) or normoxia. d. Relative contribution of different substrates to lipogenic acetyl-CoA in 3T3L1s as determined by ISA following 24 hours of tracing in hypoxia (1%) or normoxia. e. % of each FA newly synthesized over 24 hours in hypoxia (1%) or normoxia. Three cell replicates are shown in c-e. All experiments in figure have been repeated 3 independent times with the same results. Data are presented as means ± SEM with dot plots overlaid with exception of b where data is presented as box (25th to 75th percentile with median line) and whiskers (min to max values) and d-e, mean +/− 95% confidence interval.
Bckdha and Bcat2 mRNA and protein product were decreased under hypoxia in 3T3L1 adipocytes (Supplementary Figure 11b-d). Additionally, we observed that adipose tissue oxygen tension and arterial blood flow were specifically decreased in HFD mice along with BCKDHA protein levels (Supplementary Figure 11e-g), corroborating previous findings in obese adipose tissue17,39. Overall, these data indicate that adipose tissue in obese animals exhibits lower oxygen tension, which may contribute to the observed decreases in BCAA catabolism and BCKDHA levels we observed in adipose tissue from HFD mice. In turn, decreased flux through this pathway decreases local and circulating iso-mmBCFA levels in obesity.
Discussion
Here, using in vitro and in vivo metabolic tracing, we define a cross-tissue metabolic pathway where BCAA catabolic flux and the promiscuity of FASN and CrAT within brown and white adipose tissues support mmBCFA synthesis. Additionally, we demonstrate that mmBCFA turnover is suppressed by HFD and obesity-induced adipose hypoxia. Collectively, these results demonstrate that mmBCFAs are endogenous FAs produced by adipocytes that link mitochondrial BCAA catabolism, lipogenesis, and diet to metabolic disease.
To date, the primary metabolic role of BCAA catabolism has been attributed to its importance as a nitrogen donor40, production of HIBA to modulate FA uptake41, and the generation of branched acyl intermediates that can modulate enzyme function via post-translational modifications42. Our data adds to this knowledge, linking BCAA catabolism to modulation of FA diversity via enzyme promiscuity. Interestingly, mmBCFAs are synthesized and present at low levels in liver, despite the high abundance of BCKDH and rate of lipogenesis43,44. We provide evidence this difference is driven by differential expression of Crat, an enzyme that has predominantly been studied in muscle, where it is thought to mitigate fatigue by facilitating acetyl-CoA consumption during exercise and preventing acetyl-CoA accumulation during rest45, thus decreasing macronutrient induced lysine acetylation of mitochondrial proteins46. However, its relevance in brown and white adipose tissues has not been explored, despite the high level of expression observed in brown adipose tissue36. Given recent evidence that branched acyl lysine modifications also alter mitochondrial enzyme function42, it is possible that diversion of branched CoA intermediates to long chain FAs via CrAT is beneficial for maintaining healthy mitochondrial function.
We also highlight an underappreciated aspect of de novo lipogenesis, whereby the de novo FA composition reflects the balance of acyl-CoAs within the body. Thus, FASN promiscuity integrates changes in amino acid metabolism and short chain FAs into the lipidome. Therefore, alterations in SCFA and acyl-CoA abundance driven by the gut microbiome, diet, or inborn errors of metabolism can influence FA diversity and must be considered when studying the pathophysiology of associated diseases. Indeed, elevated levels of mmBCFAs have been detected in the brains of patients with defects in cobalamin metabolism18. Supraphysiological levels of mmBCFAs could impact neuronal function and play a role in the neurological defects that occur in patients with certain organic acidemias or B12 deficiency. This work also highlights the limited resolution of most lipidomics platforms for resolving mmBCFA-containing lipids. We found that mmBCFAs are incorporated into diverse lipid species by cultured adipocytes, including ether lipids, TAGs, and phospholipids. However, more extensive and focused approaches are needed to fully characterize their fates within different tissues.
Using 13C labeled leucine and valine chow, we observed that HFD feeding suppressed BCAA catabolism, resulting in decreased mmBCFA synthesis. This result is consistent with transcriptional and other flux-based measurements that indicate downregulation of this pathway in mouse models of obesity and diabetic patients17,47. In fact, mmBCFAs correlate negatively with metabolic disease biomarkers such as C-reactive protein and insulin resistance in patients15,16. This contrasts with levels of BCAAs and their downstream catabolic intermediates, which increase in the plasma of insulin resistant patients1,41. However, BCAA levels did not increase in our model of diet-induced obesity, and thus mmBCFA levels did not correlate with BCAA levels as might be expected. This is presumably due to the adipose specific origin of these FAs, as BCAAs are widely catabolized in energetically demanding tissues such as muscle, liver, heart and brain which are not significant sources of mmBCFAs. Furthermore, BCAA turnover and abundance is much greater than that of mmBCFAs. Therefore, while mmBCFA synthesis is impacted by BCAA catabolic flux, differential mmBCFA production is unlikely to be a primary driver of BCAA accumulation in T2D patients. Nevertheless, mmBCFAs may be a strong biomarker of adipose tissue lipogenesis and BCAA catabolism, and in contrast to circulating BCAA levels, are not overtly influenced by changes in protein turnover and muscle insulin resistance.
The functional consequences of decreased mmBCFA levels are unknown. Despite their abundance in tissues and presence at μM levels in plasma, mmBCFAs have been studied minimally in the context of mammalian biology. mmBCFA-containing lipids play critical roles in the postembryonic growth, neuronal development and foraging behavior of C. elegans11,48. In prokaryotes BCFAs influence membrane fluidity, and their abundances change in response to certain stresses10,26. In mammalian biology, previous studies have suggested they influence colon epithelial cell inflammation49 and protect against necrotizing enterocolitis50. Our insights into the metabolic origins and fates of mmBCFAs suggest other potential functions. Since mmBCFAs are primarily synthesized in adipose tissue, incorporated into TAGs, and increase in plasma during fasting, these lipids may be involved in nutrient sensing and signal to other tissues in the body. However, given the relatively low abundance of mmBCFAs, these FAs are unlikely to contribute significantly to energy storage or substrate oxidation and are more likely to play a role in signaling or membrane structure. Ultimately, understanding the factors that regulate mmBCFA physiology is an essential step in elucidating their function and contribution to the biological importance of the BCAA catabolic pathway.
Materials and Methods
Materials and reagents
Media and sera were purchased from Life Technologies. Glucose and amino acid isotope tracers were purchased from Cambridge Isotopes Inc. Fatty acid standards were purchased from Larodan. All other reagents were purchased form Sigma-Aldrich unless otherwise noted.
Cell culture
3T3L1 pre-adipocytes were purchased from the American Type Culture Collection and cultured in high glucose Dulbecco’s modified Eagle medium (DMEM) (Life Technologies) supplemented with 10% bovine calf serum (BCS) below 70% confluence. For differentiation, cells were allowed to reach confluence (Day −2), 2 days post confluence (Day 0) differentiation was induced with 0.5 mM 3-isobutyl-1-methylxanthine (IBMX), 0.25 μM dexamethasone, 1 μg/ml insulin in DMEM containing 10% fetal bovine serum (FBS). Media was changed on Day 2 to DMEM + 10% FBS with 1 μg/ml insulin. Day 4, and thereafter DMEM + 10% FBS was used. Cobalamin (500 nM) was supplemented to cultures when noted. Isotope tracing was carried out 7 days post induction of differentiation unless otherwise noted. Cells were incubated in custom DMEM where the metabolite specified was replaced with the 13C or 2H labeled version for 24 hours unless otherwise specified. For short chain fatty acid addition experiments, individual short chain fatty acids were added to the media at the indicated concentration for 24 hours after which total fatty acids were extracted as described below. Fatty acids were then calculated as % total fatty acids and normalized to control conditions. For LCMS analysis of [U-13C5] valine incorporation into lipids, 3T3L1 cells were incubated in tracer media for 4 days.
BAT depots were isolated from the interscapular area of neonate mice as previously described51. Once cells reached confluency, differentiation was induced by addition of DMEM containing 10% FBS, 20nM insulin, 1nM triiodothyronine, 0.5mM 3-isobutyl-1-methylxanthine, 2-μg/mL dexamethasone, and 0.25mM indomethacin for 2 days and then switched to differentiation media containing 20nM insulin, and 1nM triiodothyronine for 5–6 days. Isotope tracing was carried out 7 days post induction of differentiation.
Primary human white pre-adipocytes and muscle satellite cells were isolated, propagated and differentiated and then cultured for 24 hours in tracer media as previously described7,52. Weight stable obese subjects undergoing elective laparoscopic gastric bypass via Roux-en-Y for the treatment of obesity were recruited for the study to provide material for pre-adipocyte isolation. Both human skeletal muscle biopsies and material for pre-adipocyte isolation were obtained with approval from the University of California San Diego’s Committee on Human Investigation and VA San Diego Medical Center’s Institutional Review Board. All donors provided informed written consent after listening to an explanation of the protocol and the study complied with all relevant regulations.
All hypoxia experiments were carried out in a Coy hypoxia chamber which allows media changes under hypoxic conditions. ND-646 (1,4-dihydro-1-[(2R)-2-(2-methoxyphenyl)-2-[(tetrahydro-2H-pyran-4-yl)oxy]ethyl]-a,a,5-trimethyl-6-(2-oxazolyl)-2,4-dioxothieno[2,3-d]pyrimidine-3(2H)-acetamide) was solubilized in DMSO and added to cells at a final concentration of 100 nM for 24 hours in the presence of tracer.
Lipolysis Assay
Differentiated 3T3-L1 adipocytes were washed twice with PBS and incubated with serum-free DMEM containing P/S, 2% FA-free BSA, and 10 μM isoproterenol for 1hr. 100μL was extracted for GC-MS analysis.
Oil Red O staining
A 0.35% (w/v) Oil Red O stock was prepared in isopropanol and filtered through a 0.22 μm filter. Cells were washed with PBS, fixed with 4% paraformaldehyde for 30 minutes at room temperature, washed 2X in milli-Q water, washed once with 60% isopropanol, and finally stained with 3:2 (stock:water) Oil Red O solution for 30 minutes. Stain solution was removed from cells and cells were washed 4X with milli-Q water before imaging.
Lentiviral production and shRNA KD of Acyl CoA Dehydrogenases
Glycerol stocks of TRC2-pLKO.1-puro shRNA (methods table 1), and a non-targeting control construct were purchased from Sigma Aldrich, packaged in HEK293FT cells using the transfection agent Fugene 6 and required packaging plasmids VSV-G, gag/pol, and rev. HEK293FT medium containing lentiviral constructs was collected two days later and filtered (0.45 μm). Polybrene was added to a final concentration of 6 μg/mL. 3T3L1 pre-adipocytes were infected with 0.5 mL of virus-containing medium in a 6-well plate for 4 hours before addition of 2 mL of virus-free medium. After 24 hours of recovery, transduced cells were selected with 3 μg/mL puromycin. Cells were then plated to 12-well plates for differentiation as described above. Puromycin was removed from the medium beginning on Day 0 of differentiation.
Pooled CRISPR/Cas9 KO of Crat and Fasn in 3T3L1 adipocytes.
Fasn, NT and CrAT target sequences (methods table 2) were cloned into the lentiCRISPRv2 plasmid, a gift from Feng Zhang (Addgene plasmid # 52961). For lentivirus production, 2 – 2.5 million HEK293FT cells were placed in 10-cm tissue culture plates in 10 ml of DMEM (containing 1% penicillin/streptomycin, 10% FBS). 24 hours later, transfection was performed using Lipofectamine 3000 (Invitrogen) with 1.3 μg VSV.G/PMD2.G, 5.3 μg of lenti-gag/pol/PCMVR8.2 and 4 μg of lentiviral vector. Lentivirus-containing supernatants were harvested 48 and 72 hours later and concentrated using Amicon Ultra-15 centrifugal filters, 100,000 NMWL (Millipore) following manufacturer’s protocol. 3T3-L1 pre-adipocytes were infected with 10 μL of virus, in 1 ml of medium containing 7.5 μgs of polybrene in a 6-well plate for 4 hours before addition of an extra 1 mL of virus-free medium. After 24 hours of recovery, transduced cells were selected with 3 μg/mL puromycin. Cells were then plated to 12-well plates for differentiation as described above. Puromycin was removed from the medium beginning on Day 0 of differentiation.
RNA isolation and quantitative RT-PCR
Total RNA was purified from cultured cells using Trizol Reagent (Life Technologies) per manufacturer’s instructions. First-strand cDNA was synthesized from 1 μg of total RNA using iScript Reverse Transcription Supermix for RT-PCR (BioRad Laboratories) according to the manufacturer’s instructions. Individual 10 μL SYBR Green real-time PCR reactions consisted of 2 μL of diluted cDNA, 5 μL of SYBR Green Supermix (BioRad), and 1 μL of each 5μM forward and reverse primers. For standardization of quantification, 18S was amplified simultaneously. The PCR was carried out on 96 well plates on a CFX Connect Real time System (Bio-Rad), using a three-stage program provided by the manufacturer: 95°C for 3 min, 40 cycles of 95°C for 10 sec and 60°C for 30 sec. Gene-specific primers used are listed in methods table 3. PCR data for inter-gene comparison was corrected for primer efficiency.
Western blots
3T3L1 adipocytes or 100–150 mgs of ground eWAT were lysed in ice-cold RIPA buffer with 1× protease inhibitor (Sigma-Aldrich). 30 μg of total protein was separated on a 12% SDS-PAGE gel for BCKDH blots or 20 ugs of total protein was separated on a 4–20% SDS-PAGE gel (mini-protean TGX gels, Bio-Rad) for CrAT and FASN blots. The proteins were transferred to a nitrocellulose membrane and immunoblotted with anti-Bckdha (Novus Biologicals NBP1–79616) (1:1,000 dilution), anti-Beta-Actin (Cell Signaling 4970S) (1:5,000), anti-GAPDH (Cell signaling 5174S), anti-CrAT (Novus NBP2–15999), anti-FASN (Proteintech 10624–2-AP). Specific signal was detected with horseradish peroxidase-conjugated secondary antibody goat anti-rabbit (1:2,500 – 1:10,000) using SuperSignal West Pico Chemiluminescent Substrate (Thermo Scientific) and developed using Blue Devil Autoradiography film (Genesee Scientific) or BioRad Chemidoc XRS+.
Animal studies
Animal handling and care followed the NIH Guide for Care and Use of Laboratory Animals. The experimental protocols were approved by either the UCSD, Salk or UMMS Institutional Animal Care and Use Committee. C57BL/6J and ob/ob(B6.Cg-Lepob/J) were obtained from Jackson Laboratories.
Mouse fasting study
Food was removed from cages containing 12 week old male or female C57BL/6J mice (3–4 mice per cage) at 7:00 am. Blood was collected via tail bleed at baseline, 2, 6 12 and 24 hours post removal of food. Mice remained in their original cage with original bedding (non-synthetic shavings) for the duration of the experiment.
2H2O administration to animals
For the comparison of germ free and specific pathogen free mice, male Swiss Webster mice were bred and maintained in sterile semi-flexible isolators and screened for bacterial, viral, and fungal contamination. Age-matched male specific pathogen free mice were used for comparison and obtained from Charles River at 5 weeks of age. Mice were maintained under a 12 hr light/dark cycle and given a standard chow diet ad libitum. At 6 weeks of age, mice were subcutaneously injected with 0.035 mls/g body weight 0.9% NaCl 2H2O and drinking water was replaced with 8% 2H2O enriched water. 8 days later, mice were fasted for 6 hours (9 am – 3pm) and tissues collected and snap frozen in liquid N2.
For high fat study, 5-week-old C57BL/6J mice were obtained from Jackson Laboratories and ad lib fed a 45% high fat diet (D12451) or a 10% low fat diet (D12450K) for 15 weeks from 6 weeks of age. Diets were obtained from Research Diets, Inc. 7 – 21 days prior to termination, mice were I.P injected with 0.035 mls/g body weight 0.9% NaCl 2H2O and drinking water was replaced with 8% 2H2O enriched water. Mice were fasted for 6 hours prior to plasma and tissue collection and samples were immediately snap frozen in liquid N2.
Thermo-variation experiments were carried out as previously described34. Briefly, 10-week-old C57BL/6J mice were simultaneously housed in two rodent incubators (RIT33SD, Powers Scientific) within the Animal Medicine facilities of the UMMS for 4 weeks. One of them had the temperature adjusted to 30°C (thermoneutrality group). Another incubator had its temperature decreased by four degrees weekly until reaching 6°C at which temperature the mice stayed for a week (severe cold group). Room temperature group mice were in a clean room set at 22°C co-housed in the same facility as the mice in rodent incubators. Mouse cages were changed weekly using components pre-adjusted to temperature. Three days prior to termination, mice were intraperitoneally injected with 0.035 mL/g body weight 0.9% NaCl 2H2O (Sigma, 151882) and drinking water was replaced with 8% 2H2O enriched water.
Isotope labeled chow study
5-week-old C57BL/6J mice were obtained from Jackson Laboratories and ad lib fed a custom 60% kcal high fat diet (TD.160092) or a 20% kcal fat diet (TD. 160091) for 15 weeks from 6 weeks of age. Diets and incorporated isotopes were obtained from Envigo Teklad Diets and Cambridge isotopes respectively. For the final 3 weeks, 25% of the total valine and leucine in the diet was replaced with [U-13C5-15N]valine and [U-13C6-15N]leucine so that there was 3 g [U-13C5-15N]valine /100 grams protein and 4 g [U-13C6-15N]leucine/100 grams protein in both diets. Mice were fasted overnight prior to plasma and tissue collection and samples were immediately snap frozen in liquid N2.
Tissue pO2 and organ blood flow in HFD/LFD mice
To determine the impact of obesity on tissue pO2, blood flow and BCKDHA levels in eWAT, 5-week-old C57BL/6J mice were obtained from Jackson Laboratories and ad lib fed a 60% kcal high fat diet (D12492) or a 10% kcal fat diet (D12450K) from research diets for 8 weeks from 6 weeks of age.
Electrodes for oxygen measurements
The oxygen partial pressure was measured using carbon fiber electrodes (Carbostar-1, Kation Scientific; Minneapolis, MN) where the tip of the electrode was coated with 5% Nafion (Sigma; St. Louis, MO) to increase oxygen specificity. The process consisted of three individual Nafion coats. The microelectrodes were polarized at −0.8 V relative to a silver-silver chloride reference electrode (Cypress Systems; Lawrence, KS). Oxygen measurements were performed using the two electrodes system (working and reference electrode), and the current generated was measured with a potentiostat and electrometer (Keithley model 610C; Cleveland, OH). The microelectrodes were calibrated at 37°C with 0, 5, 10 and 21% oxygen gases (Airgas; Los Angeles, CA). Tissues were superfused (0.1 mL/min) with physiological Krebs salt solution and the tissue was maintained at 35–37°C by the heated Krebs solution. The solution was spread on the tissue as a thin film, drained into a platter, and drawn off by suction. The solution was equilibrated with 95% N2 and 5% CO2, which maintained the superfusate at a pH of 7.4 and minimized O2 delivery to the tissue from the atmosphere. Oxygen measurements were made by penetrating the tissue with the microelectrode tip. The reference electrode was placed in the bath, and the microelectrode was placed in a shielded holder and advanced towards the measurement site with a micromanipulator. A long-working distance X10 Leitz objective was used to direct the electrode to the measurement site. Before measurements, the electrode tip was immersed in the supernatant suffusion solution and the current was registered. The supernatant suffusion solution was set as 0 mmHg reference point. Upon introduction into the tissue, the microelectrodes responded with a time constant that is estimated to be of the order of 10 sec. A stable reading is obtained within 30 seconds, and upon reaching the current plateau value, the electrode is extracted from the tissue and the tip maintained within the suffusing saline solution.
Organ Blood Flow Distribution
The fluorescent-labeled microsphere (FLM) method was used to determine organ blood flow. Briefly, fluorescent microspheres (Molecular Probes, Eugene, OR), 15 μm in diameter with a single color (green, yellow, red or scarlet) were suspended in saline and injected over a short 10 second period (100 μL) at the time point of interest. At the end of the protocol, animals were euthanized with a lethal dose of sodium pentobarbital, and eight vital tissues were harvested. The tissues were digested in 1N KOH in separate containers for 24 hrs and then filtered. Fluorescent dye extraction was accomplished using Cellosolve (Fisher Scientific Co., Pittsburg, PA), and the number of FLMs was quantified as a function of the florescent signal at each specific FluoSphere wavelength (LS50B, Perkin-Elmer Corp., Norwalk, CT) 53.
NAFL/NASH patient sample collection
16 subjects undergoing diagnostic liver biopsy for suspected NAFLD were recruited by the NAFLD Research Center at the University of California–San Diego. Subjects were carefully screened and excluded for liver diseases other than NAFLD and secondary causes of hepatic steatosis54. Subjects drank 50 mL of 70% 2H2O three times per day for 4 days, followed by twice a day until the date of liver biopsy, for a total period of 3–5 weeks. Plasma was collected weekly from the start of heavy water labeling until the time of biopsy. All procedures used in this study were approved by the University of California–San Diego Human Research Protections Program. Subjects provided written informed consent, and Declaration of Helsinki protocols were followed.
GC/MS analysis of fatty acids and polar metabolites
For cell culture, polar metabolites and fatty acids were extracted using methanol/water/chloroform and analyzed as previously described7. For tissue and plasma, metabolites and total fatty acids were extracted from tissues and plasma using a Folch-based methanol/chloroform/saline extraction at a ratio of 1:2:1 with inclusion of [2H31] palmitate and norvaline as lipid and polar internal standards respectively. Briefly, 250 μl MeOH, 500 μls CHCL3, 250 μls saline and fatty acid isotope internal standards were added to weighed pre-ground tissue. This was vortexed for 10 minutes followed by centrifugation at 10,000 g for 5 minutes. Polar metabolites were derivatized in 2% (w/v) methoxyamine hydrochloride (Thermo Scientific) in pyridine and incubated at 37°C for 60 minutes. Samples were then silylated with N-tertbutyldimethylsilyl-N-methyltrifluoroacetamide (MTBSTFA) with 1% tert-butyldimethylchlorosilane (tBDMS) (Regis Technologies) at 37°C for 30–45 minutes. Polar derivatives were analyzed by GC-MS using a DB-35MS column (30m x 0.25 mm i.d. x 0.25 μm, Agilent J&W Scientific) installed in an Agilent 7890A gas chromatograph (GC) interfaced with an Agilent 5975C mass spectrometer (MS). The lower chloroform phase was dried and then derivitised to form fatty acid methyl esters(FAMES) via addition of 500 μls 2% H2SO4 in MeOH and incubation at 50°C for 2 hours. FAMES were extracted via addition of 100 μl saturated salt solution and 500 μl hexane and these were analyzed using a Select FAME column (100m x 0.25mm i.d.) installed in an Aglient 7890A GC interfaced with an Agilent 5975C MS using the following temperature program: 80 °C initial, increase by 20 °C/min to 170 °C, increase by 1 °C/min to 204 °C, then 20 °C/min to 250 °C and hold for 10 min. The % isotopologue distribution of each fatty acid and polar metabolite was determined and corrected for natural abundance using in-house algorithms adapted from Fernandez et al55. The metabolite ion fragments used are summarized in methods table 4. Mole percent enrichment (MPE) was calculated via the following equation:
where n is the number of carbon atoms in the metabolite and Mi is the relative abundance of the ith mass isotopologue. Molar enrichment was determined by multiplying the MPE by the abundance.
YSI (yellow springs instrument) was used to quantify glucose, lactate, glutamine and glutamate in cell culture media.
Isotopomer spectral analysis.
The contribution of oxPPP derived NADPH to lipogenesis using the [3-2H] glucose tracer was determined via isotopomer spectral analysis (ISA) using INCA as previously described7. The ISA compares a measured fatty acid isotopomer distribution (determined by integrating metabolite ion fragments of fatty acids summarized in methods table 3) to one that is simulated using a reaction network for palmitate synthesis whereby 14 NADPH molecules are consumed to form one palmitate molecule. Models were also generated for mmBCFA and OCFA synthesis whereby 12 NADPH molecules are consumed to form one branched or odd chain fatty acid(methods table 5 and 6). Parameters for the relative enrichment of the lipogenic NADPH pool from a given [2H] tracer and the percentage of fatty acids that are de novo synthesized are extracted from a best fit model using INCA 4.6 metabolic flux analysis software package56. The 95% confidence intervals for both parameters were estimated by evaluating the sensitivity of the sum of squared residuals between measured and simulated fatty acid mass isotopomer distributions to small flux variations.
GC/MS analysis of short chain fatty acids.
Cecal content was weighed, and 2μl of water was added per mg of cecum. The sample was vortexed for 5 minutes followed by centrifugation at 18,000 g for 5 minutes at 10°C. The resultant cecal water was used for SCFA analysis, and the cecal pellet was dried overnight at 60°C to obtain the dry weight.
For cecal SCFA quantification, 50 μl of cecal water was added to a 2 ml eppendorf microcentrifuge tube, followed by 150 μl water, 10 μl 5 mM 2-ethylbutyrate, 30 μl 10 mM sodium acetate-d3, 50 μl 1-propanol and 50 μl pyridine. The tube was placed on ice for 5 minutes followed by addition of 100 μl 1M NaOH and 30 μl methylchloroformate. The sample was then vortexed for 20 seconds followed by addition of 300 μl MTBE and vortexed for another 20 seconds followed by centrifugation at 10,000 g for 5 minutes at 4°C. 100 μl of the upper phase was then transferred in duplicate to GC vials for analysis. Samples were analyzed by GC-MS using a DB-35MS column (30m × 0.25 mm i.d. × 0.25 μm, Agilent J&W Scientific) installed in an Agilent 7890B gas chromatograph (GC) interfaced with an Agilent 5977B mass spectrometer (MS) using the following temperature program: 50 °C initial with a hold time of 0.8 minutes, followed by an increase of 25 °C/min to 120 °C and then an increase of 100 °C/min to 280 °C. Samples were injected using split mode(25 ml/min split flow) and the mass spectrometer was operated in scan mode between 50 – 150 AMU. Acetate was quantified from the internal acetate isotope standard and all other SCFAs were quantified from a standard curve extracted in parallel.
The isotopologue distributions of acetate and isovalerate were obtained via diethyl ether extraction and TBDMS derivatization of cecal water. Briefly, 10 μl concentrated HCL (37%) and 1ml Et2O was added to 100 μl cecal water followed by 10 minutes of vortexing and centrifugation at 18,000g at 15°C for 5 minutes. The upper phase was added to a new tube and the Et2O extraction step was repeated. 250 μl of the extract was aliquoted in triplicate to GC vials and 25 μls MTBSTFA + 1% tBDMS was added followed by incubation at room temperature for 1 hour prior to GCMS analysis with the following temperature program: 80 °C initial with a hold time of 0.8 minutes, followed by an increase of 15 °C/min to 150 °C with a hold time of 2 minutes, then an increase by 50 °C/min to 280 °C. Samples were injected using split mode (25 ml/min split flow) and the mass spectrometer was operated in scan mode between 50 – 500 AMU.
Plasma 2H2O enrichment analysis
The 2H labeling of water from samples or standards was determined via deuterium acetone exchange. 5 μl of sample or standard was reacted with 4 μl of 10N NaOH and 4 μl of a 5% (v/v) solution of acetone in acetonitrile for 24 hours. Acetone was extracted by the addition of 600 ul chloroform and 0.5 g Na2SO4 followed by vigorous mixing. 100 μl of the chloroform was then transferred to a GC/MS vial. Acetone was measured using an Agilent DB-35MS column (30 m 3 0.25 mm i.d. x 0.25 μm, Agilent J&W Scientific) installed in an Agilent 7890A gas chromatograph (GC) interfaced with an Agilent 5975C mass spectrometer (MS) with the following temperature program: 60 °C initial, increase by 20 °C/min to 100 °C, increase by 50 °C/min to 220 °C, and hold for 1 min. The split ratio was 40:1 with a helium flow of 1 ml/min. Acetone eluted at approximately 1.5 min. The mass spectrometer was operated in the electron impact mode (70 eV). The mass ions 58 and 59 were integrated and the % M1 (m/z 59) calculated. Known standards were used to generate a standard curve and plasma % enrichment was determined from this. All samples were analyzed in triplicate.
In vivo de novo lipogenesis calculations.
Calculation of the fraction of newly synthesized fatty acids (FNS) was based on the method described by Lee et al.57, where FNS is described by the following equation:
Where ME is the average number of deuterium atoms incorporated per molecule (ME =1 × m1 + 2 × m2 +3 x m3 … ), p is the deuterium enrichment in water and n is the maximum number of hydrogen atoms from water incorporated per molecule. N was determined using the equation:
As describd by Lee et al 57 where q is the fraction of hydrogen atoms and p + q = 1. The molar amount of newly synthesized fatty acids (MNS) was determined by: MNS = FNS x total fatty acid amount (nmoles/mg tissue).
LC/MS lipidomic analysis
Lipid extraction was carried out using a Folch-based methanol/chloroform/saline extraction at a ratio of 1:2:1 with the inclusion of C12:0 dodecylglycerol and hexadecanoic acid-d31 as internal standards. The methanol phase was washed a second time with chloroform after addition of 1 μl formic acid. Metabolite separation was achieved with a Luna reverse-phase C5 column (50 × 4.6 mm, with 5-μm-diameter particles; Phenomenex). Mobile phase A was composed of a 95:5 ratio of water:methanol, and mobile phase B consisted of isopropanol, methanol, and water in a 60:35:5 ratio. Solvent modifiers 0.1% formic acid with 5 mM ammonium formate and 0.1% ammonium hydroxide were used to assist ion formation and to improve the LC resolution in both positive and negative ionization modes, respectively. The flow rate for each run started at 0.1 mL/min for 5 min to alleviate backpressure associated with injecting chloroform. The gradient started at 0% B and increased linearly to 100% B over the course of 45 min with a flow rate of 0.4 mL/min, followed by an isocratic gradient of 100% B for 17 min at 0.5 mL/min, before equilibrating for 8 min at 0% B with a flow rate of 0.5 mL/min. MS analysis was performed with an electrospray ionization (ESI) source on an Agilent 6430 QQQ LC-MS/MS. The capillary voltage was set to 3.0 kV, and the fragmentor voltage was set to 100 V. The drying gas temperature was 350 °C, the drying gas flow rate was 10 L/min, and the nebulizer pressure was 35 psi. Representative lipids were quantified by SRM of the transition from precursor to product ions at associated optimized collision energies as previously described58. Briefly, for the SRM transitions where the transition of parent masses to the loss of the headgroup (e.g. loss of phosphocholine from phosphatidylcholine) is monitored, the acyl chain specificities were determined from previously described procedures58. For phospholipids such as PCs and PEs, the fatty acid acyl chain composition was determined from phospholipids using a mobile phase containing both ammonium hydroxide and formic acid and monitored the fatty acid fragmentations from [M-H+HCO2H] m/z at 40 V collision energy in negative ionization mode. For other phospholipids such as PAs and PIs, the fatty acid fragmentations from [M-H] m/z at 40 V collision energy in negative ionization mode in mobile phase containing just ammonium hydroxide were monitored. The identifying ion and the M+4(mass increment of 4) ion of each lipid was monitored and relative abundance was determined by integrating the area under the curve followed by normalization to internal standard values. Significant incorporation of U13C valine into lipids was determined by comparing the relative abundance of the M+4 ion of each lipid species targeted in [U13C5]valine traced cells versus cells that had no tracer added (no trace) via fold change differences and students t-test. Percentage enrichment of each lipid species was determined via:
Where M4 is the M+4 abundance of each lipid, M0 is the identifying ion abundance and 13C and 12C denote cells cultured in [U13C5]valine and 12C valine respectively.
Statistical analysis
All results shown as mean ± SEM. P values were calculated using Student two-tailed t test unless otherwise specified; *, P value between 0.01 and 0.05; **, P value between 0.001 and 0.01; ***, P value <0.001. T-tests were carried out in GraphPad Prism, version 7. Errors associated with ISA of lipogenesis are 95% confidence intervals determined via sensitivity analysis. All cell culture experiments were replicated at least 3 independent times.
Data Availability.
The datasets generated during and/or analyzed during the current study are available from the corresponding author upon reasonable request.
Supplementary Material
Acknowledgments
This work was supported, in part, by US National Institutes of Health (NIH) grants R01CA188652 (C.M.M.), NIH R01CA172667 (D.K.N), P01-HL110900 (PC) and R01-HL126945 (PC), a Searle Scholar Award (C.M.M.), a Camille and Henry Dreyfus Teacher-Scholar Award (C.M.M.), an NSF CAREER Award (#1454425 to C.M.M.), and an Ajinomoto Innovation Alliance Program Grant (C.M.M). The project was funded (in part) by a seed grant made available through the UC San Diego Larsson-Rosenquist Foundation Mother-Milk-Infant Center of Research Excellence (M.W). J.S.G. is supported by AHA award 18CDA34080527. This material is the result of work supported with resources and the use of facilities at the VA San Diego Medical Center. The contents do not represent the views of the U.S. Department of Veterans Affairs or the United States Government. We would like to thank Dr. Mari Gantner for helping with primary brown adipose tissue isolation and culture.
Footnotes
Competing interests
The authors declare no competing financial interests.
Author contributions
M.W. and C.M.M. conceived and designed the study. C.R.G. carried out knock down and analysis of ACAD enzymes and assisted with design and execution of all 3T3L1 experiments; L.S.R. and D.K.N. carried out lipidomic analysis of 13C traced adipocytes; and J.M., Y.M.L. and J.S.A. provided germ-free and SPF samples. T.P.C and S.A.P isolated and cultured human primary cells. N.M. and J.M.G. assisted with GC/MS analysis of in vivo samples; J.D.H. carried out gene expression analysis of tissue samples, J.S.G and D.A.G. carried out D2O thermo-variation experiment in mice. P.C. carried out in vivo oxygen tension and arterial blood flow studies in mice. M.W. performed all other experiments. R.L designed and executed the clinical study of NAFL and NASH patients. M.W. and C.M.M. wrote the paper with help from all authors.
References
- 1.Newgard CB et al. A branched-chain amino acid-related metabolic signature that differentiates obese and lean humans and contributes to insulin resistance. Cell Metab 9, 311–26 (2009). [DOI] [PMC free article] [PubMed] [Google Scholar]
- 2.Wang TJ et al. Metabolite profiles and the risk of developing diabetes. Nat Med 17, 448–53 (2011). [DOI] [PMC free article] [PubMed] [Google Scholar]
- 3.Tonjes M et al. BCAT1 promotes cell proliferation through amino acid catabolism in gliomas carrying wild-type IDH1. Nat Med 19, 901–8 (2013). [DOI] [PMC free article] [PubMed] [Google Scholar]
- 4.Overmyer KA et al. Maximal oxidative capacity during exercise is associated with skeletal muscle fuel selection and dynamic changes in mitochondrial protein acetylation. Cell Metab 21, 468–78 (2015). [DOI] [PMC free article] [PubMed] [Google Scholar]
- 5.Herman MA, She P, Peroni OD, Lynch CJ & Kahn BB Adipose tissue branched chain amino acid (BCAA) metabolism modulates circulating BCAA levels. J Biol Chem 285, 11348–56 (2010). [DOI] [PMC free article] [PubMed] [Google Scholar]
- 6.Crown SB, Marze N & Antoniewicz MR Catabolism of Branched Chain Amino Acids Contributes Significantly to Synthesis of Odd-Chain and Even-Chain Fatty Acids in 3T3-L1 Adipocytes. PLoS One 10, e0145850 (2015). [DOI] [PMC free article] [PubMed] [Google Scholar]
- 7.Green CR et al. Branched-chain amino acid catabolism fuels adipocyte differentiation and lipogenesis. Nat Chem Biol 12, 15–21 (2016). [DOI] [PMC free article] [PubMed] [Google Scholar]
- 8.Ran-Ressler RR, Bae S, Lawrence P, Wang DH & Brenna JT Branched-chain fatty acid content of foods and estimated intake in the USA. Br J Nutr 112, 565–72 (2014). [DOI] [PMC free article] [PubMed] [Google Scholar]
- 9.Jenkins B, West JA & Koulman A A review of odd-chain fatty acid metabolism and the role of pentadecanoic Acid (c15:0) and heptadecanoic Acid (c17:0) in health and disease. Molecules 20, 2425–44 (2015). [DOI] [PMC free article] [PubMed] [Google Scholar]
- 10.Mercier R, Dominguez-Cuevas P & Errington J Crucial role for membrane fluidity in proliferation of primitive cells. Cell Rep 1, 417–23 (2012). [DOI] [PubMed] [Google Scholar]
- 11.Kniazeva M, Zhu H, Sewell AK & Han M A Lipid-TORC1 Pathway Promotes Neuronal Development and Foraging Behavior under Both Fed and Fasted Conditions in C. elegans. Dev Cell 33, 260–71 (2015). [DOI] [PubMed] [Google Scholar]
- 12.Gibson RA & Kneebone GM Fatty acid composition of human colostrum and mature breast milk. Am J Clin Nutr 34, 252–7 (1981). [DOI] [PubMed] [Google Scholar]
- 13.Grigor MR, Dunckley GG & Purves HD The synthesis of the branched-chain fatty acids of rat skin surface lipid. Biochim Biophys Acta 218, 389–99 (1970). [DOI] [PubMed] [Google Scholar]
- 14.Ran-Ressler RR, Devapatla S, Lawrence P & Brenna JT Branched chain fatty acids are constituents of the normal healthy newborn gastrointestinal tract. Pediatr Res 64, 605–9 (2008). [DOI] [PMC free article] [PubMed] [Google Scholar]
- 15.Su X et al. Adipose tissue monomethyl branched-chain fatty acids and insulin sensitivity: Effects of obesity and weight loss. Obesity (Silver Spring) 23, 329–34 (2015). [DOI] [PMC free article] [PubMed] [Google Scholar]
- 16.Mika A et al. A comprehensive study of serum odd- and branched-chain fatty acids in patients with excess weight. Obesity (Silver Spring) 24, 1669–76 (2016). [DOI] [PubMed] [Google Scholar]
- 17.Lackey DE et al. Regulation of adipose branched-chain amino acid catabolism enzyme expression and cross-adipose amino acid flux in human obesity. Am J Physiol Endocrinol Metab 304, E1175–87 (2013). [DOI] [PMC free article] [PubMed] [Google Scholar]
- 18.Kishimoto Y, Williams M, Moser HW, Hignite C & Biermann K Branched-chain and odd-numbered fatty acids and aldehydes in the nervous system of a patient with deranged vitamin B 12 metabolism. J Lipid Res 14, 69–77 (1973). [PubMed] [Google Scholar]
- 19.Svensson RU et al. Inhibition of acetyl-CoA carboxylase suppresses fatty acid synthesis and tumor growth of non-small-cell lung cancer in preclinical models. Nat Med 22, 1108–1119 (2016). [DOI] [PMC free article] [PubMed] [Google Scholar]
- 20.Hiltunen JK et al. Mitochondrial fatty acid synthesis type II: more than just fatty acids. J Biol Chem 284, 9011–5 (2009). [DOI] [PMC free article] [PubMed] [Google Scholar]
- 21.Lewis CA et al. Tracing compartmentalized NADPH metabolism in the cytosol and mitochondria of mammalian cells. Mol Cell 55, 253–63 (2014). [DOI] [PMC free article] [PubMed] [Google Scholar]
- 22.Horning MG, Martin DB, Karmen A & Vagelos PR Fatty acid synthesis in adipose tissue. II. Enzymatic synthesis of branched chain and odd-numbered fatty acids. J Biol Chem 236, 669–72 (1961). [PubMed] [Google Scholar]
- 23.Oku H, Yagi N, Nagata J & Chinen I Precursor role of branched-chain amino acids in the biosynthesis of iso and anteiso fatty acids in rat skin. Biochim Biophys Acta 1214, 279–87 (1994). [PubMed] [Google Scholar]
- 24.Liu L et al. Human fetal intestinal epithelial cells metabolize and incorporate branched chain fatty acids in a structure specific manner. Prostaglandins Leukot Essent Fatty Acids 116, 32–39 (2017). [DOI] [PMC free article] [PubMed] [Google Scholar]
- 25.Obayashi M et al. Estrogen controls branched-chain amino acid catabolism in female rats. J Nutr 134, 2628–33 (2004). [DOI] [PubMed] [Google Scholar]
- 26.Kaneda T Iso- and anteiso-fatty acids in bacteria: biosynthesis, function, and taxonomic significance. Microbiol Rev 55, 288–302 (1991). [DOI] [PMC free article] [PubMed] [Google Scholar]
- 27.Macfarlane GT, Gibson GR, Beatty E & Cummings JH Estimation of short-chain fatty acid production from protein by human intestinal bacteria based on branched-chain fatty acid measurements. FEMS Microbiology Ecology 10, 81–88 (1992). [Google Scholar]
- 28.Previs SF et al. New methodologies for studying lipid synthesis and turnover: looking backwards to enable moving forwards. Biochim Biophys Acta 1842, 402–13 (2014). [DOI] [PubMed] [Google Scholar]
- 29.Abdelmagid SA et al. Comprehensive profiling of plasma fatty acid concentrations in young healthy Canadian adults. PLoS One 10, e0116195 (2015). [DOI] [PMC free article] [PubMed] [Google Scholar]
- 30.Sailer M et al. Increased plasma citrulline in mice marks diet-induced obesity and may predict the development of the metabolic syndrome. PLoS One 8, e63950 (2013). [DOI] [PMC free article] [PubMed] [Google Scholar]
- 31.Jenkins BJ et al. Odd Chain Fatty Acids; New Insights of the Relationship Between the Gut Microbiota, Dietary Intake, Biosynthesis and Glucose Intolerance. Sci Rep 7, 44845 (2017). [DOI] [PMC free article] [PubMed] [Google Scholar]
- 32.Eissing L et al. De novo lipogenesis in human fat and liver is linked to ChREBP-beta and metabolic health. Nat Commun 4, 1528 (2013). [DOI] [PMC free article] [PubMed] [Google Scholar]
- 33.Duarte JA et al. A high-fat diet suppresses de novo lipogenesis and desaturation but not elongation and triglyceride synthesis in mice. J Lipid Res 55, 2541–53 (2014). [DOI] [PMC free article] [PubMed] [Google Scholar]
- 34.Sanchez-Gurmaches J et al. Brown Fat AKT2 Is a Cold-Induced Kinase that Stimulates ChREBP-Mediated De Novo Lipogenesis to Optimize Fuel Storage and Thermogenesis. Cell Metab 27, 195–209 e6 (2018). [DOI] [PMC free article] [PubMed] [Google Scholar]
- 35.Violante S et al. Substrate specificity of human carnitine acetyltransferase: Implications for fatty acid and branched-chain amino acid metabolism. Biochim Biophys Acta 1832, 773–9 (2013). [DOI] [PubMed] [Google Scholar]
- 36.Geiger T et al. Initial quantitative proteomic map of 28 mouse tissues using the SILAC mouse. Mol Cell Proteomics 12, 1709–22 (2013). [DOI] [PMC free article] [PubMed] [Google Scholar]
- 37.Trayhurn P, Wang B & Wood IS Hypoxia in adipose tissue: a basis for the dysregulation of tissue function in obesity? Br J Nutr 100, 227–35 (2008). [DOI] [PubMed] [Google Scholar]
- 38.Robciuc MR et al. VEGFB/VEGFR1-Induced Expansion of Adipose Vasculature Counteracts Obesity and Related Metabolic Complications. Cell Metab 23, 712–24 (2016). [DOI] [PMC free article] [PubMed] [Google Scholar]
- 39.Ye J, Gao Z, Yin J & He Q Hypoxia is a potential risk factor for chronic inflammation and adiponectin reduction in adipose tissue of ob/ob and dietary obese mice. Am J Physiol Endocrinol Metab 293, E1118–28 (2007). [DOI] [PubMed] [Google Scholar]
- 40.Mayers JR et al. Tissue of origin dictates branched-chain amino acid metabolism in mutant Kras-driven cancers. Science 353, 1161–5 (2016). [DOI] [PMC free article] [PubMed] [Google Scholar]
- 41.Jang C et al. A branched-chain amino acid metabolite drives vascular fatty acid transport and causes insulin resistance. Nat Med 22, 421–6 (2016). [DOI] [PMC free article] [PubMed] [Google Scholar]
- 42.Anderson KA et al. SIRT4 Is a Lysine Deacylase that Controls Leucine Metabolism and Insulin Secretion. Cell Metab 25, 838–855 e15 (2017). [DOI] [PMC free article] [PubMed] [Google Scholar]
- 43.Hellerstein MK, Neese RA & Schwarz JM Model for measuring absolute rates of hepatic de novo lipogenesis and reesterification of free fatty acids. Am J Physiol 265, E814–20 (1993). [DOI] [PubMed] [Google Scholar]
- 44.Shin AC et al. Brain insulin lowers circulating BCAA levels by inducing hepatic BCAA catabolism. Cell Metab 20, 898–909 (2014). [DOI] [PMC free article] [PubMed] [Google Scholar]
- 45.Seiler SE et al. Carnitine Acetyltransferase Mitigates Metabolic Inertia and Muscle Fatigue during Exercise. Cell Metab 22, 65–76 (2015). [DOI] [PMC free article] [PubMed] [Google Scholar]
- 46.Davies MN et al. The Acetyl Group Buffering Action of Carnitine Acetyltransferase Offsets Macronutrient-Induced Lysine Acetylation of Mitochondrial Proteins. Cell Rep 14, 243–54 (2016). [DOI] [PMC free article] [PubMed] [Google Scholar]
- 47.Mardinoglu A et al. Integration of clinical data with a genome-scale metabolic model of the human adipocyte. Mol Syst Biol 9, 649 (2013). [DOI] [PMC free article] [PubMed] [Google Scholar]
- 48.Kniazeva M, Euler T & Han M A branched-chain fatty acid is involved in post-embryonic growth control in parallel to the insulin receptor pathway and its biosynthesis is feedback-regulated in C. elegans. Genes Dev 22, 2102–10 (2008). [DOI] [PMC free article] [PubMed] [Google Scholar]
- 49.Yan Y et al. BCFA suppresses LPS induced IL-8 mRNA expression in human intestinal epithelial cells. Prostaglandins Leukot Essent Fatty Acids 116, 27–31 (2017). [DOI] [PubMed] [Google Scholar]
- 50.Ran-Ressler RR et al. Branched chain fatty acids reduce the incidence of necrotizing enterocolitis and alter gastrointestinal microbial ecology in a neonatal rat model. PLoS One 6, e29032 (2011). [DOI] [PMC free article] [PubMed] [Google Scholar]
- 51.Gantner ML, Hazen BC, Eury E, Brown EL & Kralli A Complementary Roles of Estrogen-Related Receptors in Brown Adipocyte Thermogenic Function. Endocrinology 157, 4770–4781 (2016). [DOI] [PMC free article] [PubMed] [Google Scholar]
- 52.Vacanti NM et al. Regulation of substrate utilization by the mitochondrial pyruvate carrier. Mol Cell 56, 425–35 (2014). [DOI] [PMC free article] [PubMed] [Google Scholar]
- 53.Cabrales P & Tsai AG Plasma viscosity regulates systemic and microvascular perfusion during acute extreme anemic conditions. Am J Physiol Heart Circ Physiol 291, H2445–52 (2006). [DOI] [PubMed] [Google Scholar]
- 54.Decaris ML et al. Identifying nonalcoholic fatty liver disease patients with active fibrosis by measuring extracellular matrix remodeling rates in tissue and blood. Hepatology 65, 78–88 (2017). [DOI] [PMC free article] [PubMed] [Google Scholar]
- 55.Fernandez CA, Des Rosiers C, Previs SF, David F & Brunengraber H Correction of 13C mass isotopomer distributions for natural stable isotope abundance. J Mass Spectrom 31, 255–62 (1996). [DOI] [PubMed] [Google Scholar]
- 56.Young JD INCA: a computational platform for isotopically non-stationary metabolic flux analysis. Bioinformatics 30, 1333–5 (2014). [DOI] [PMC free article] [PubMed] [Google Scholar]
- 57.Lee WN et al. In vivo measurement of fatty acids and cholesterol synthesis using D2O and mass isotopomer analysis. Am J Physiol 266, E699–708 (1994). [DOI] [PubMed] [Google Scholar]
- 58.Louie SM et al. GSTP1 Is a Driver of Triple-Negative Breast Cancer Cell Metabolism and Pathogenicity. Cell Chem Biol 23, 567–78 (2016). [DOI] [PMC free article] [PubMed] [Google Scholar]
Associated Data
This section collects any data citations, data availability statements, or supplementary materials included in this article.
Supplementary Materials
Data Availability Statement
The datasets generated during and/or analyzed during the current study are available from the corresponding author upon reasonable request.