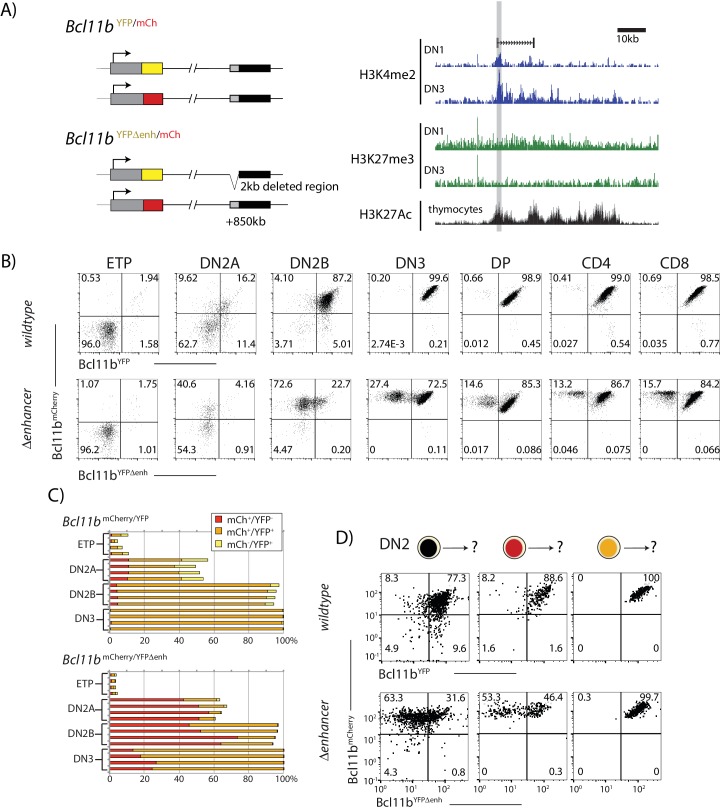
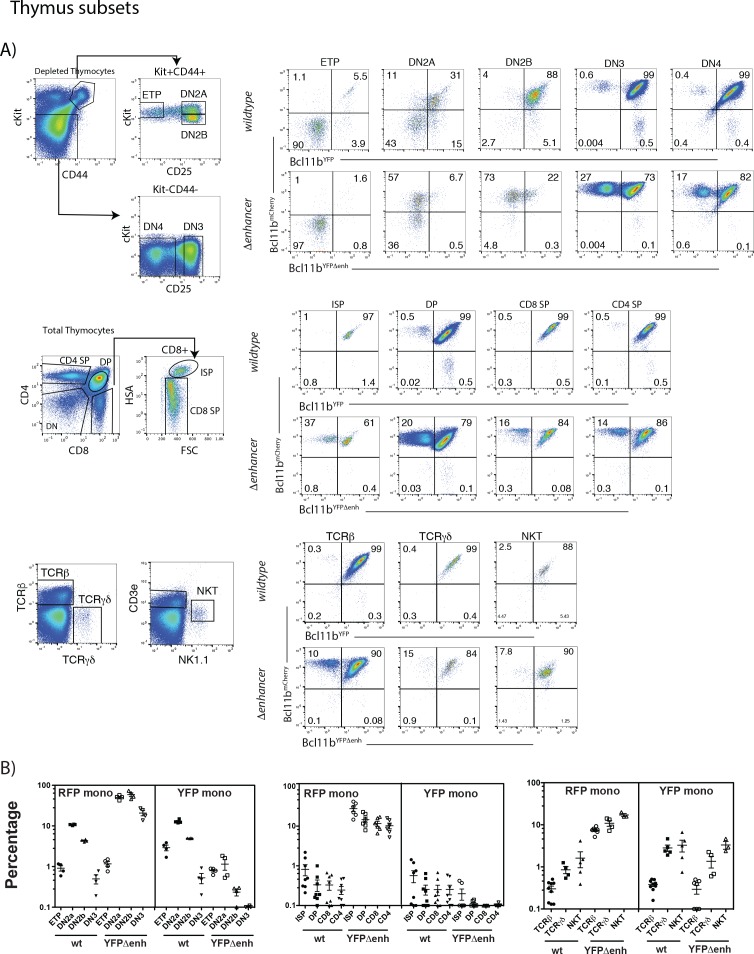
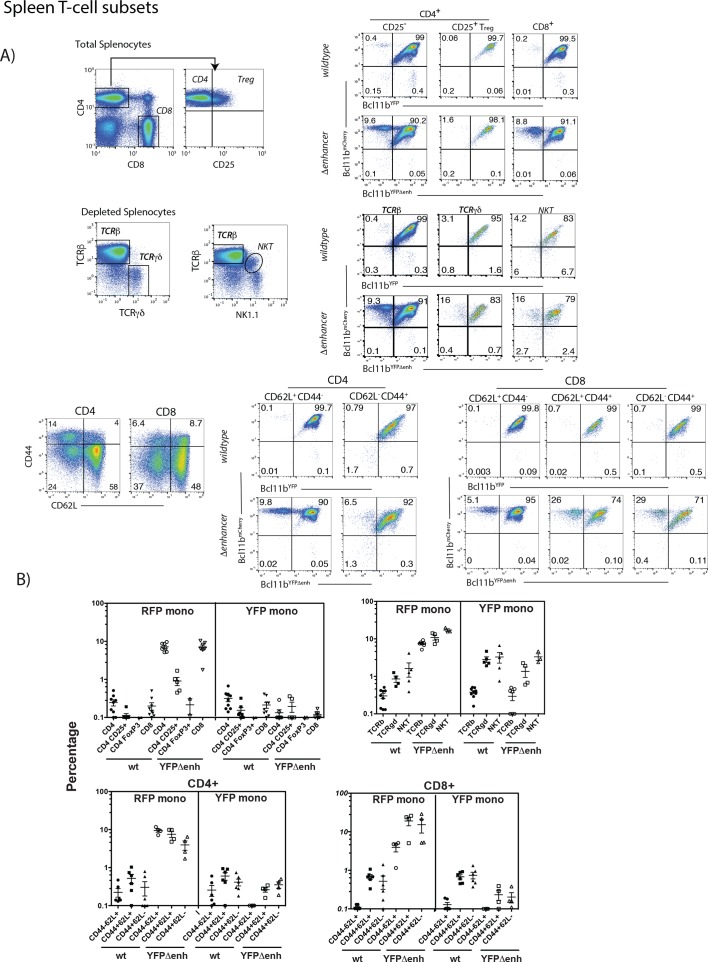
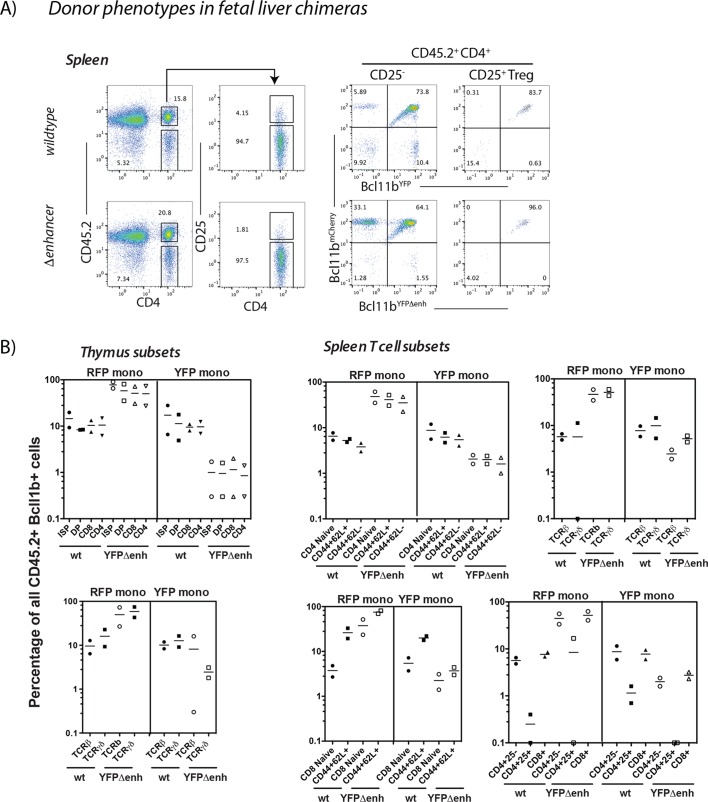
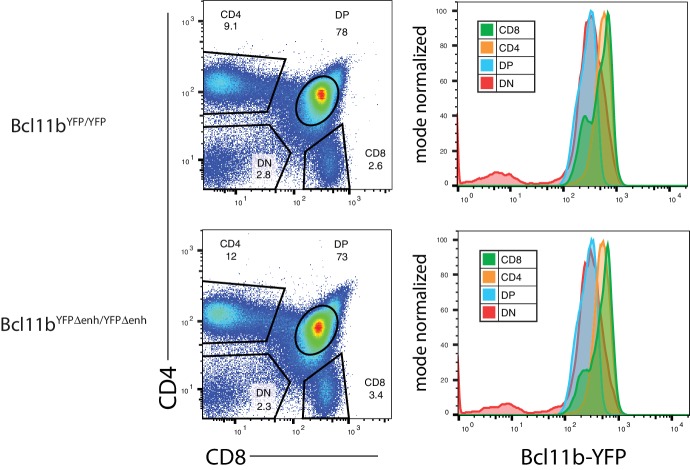
Figure 3. A distal enhancer region controls Bcl11b activation probability.
(A) Schematic of normal and enhancer-deleted two-color Bcl11b reporter strains (left). Genome browser plots (right), showing +850 kb enhancer of Bcl11b, showing distributions of histone marks (H3K4me2, H3K27me3, and H3K27Ac) and an associated LncRNA (Isoda et al., 2017). Orientation is with transcription from left to right (reversed relative to genome numbering). Gray shaded area indicates the enhancer region deleted using gene targeting (removed region: chr12:108,396,825–108,398,672, mm9). (B) Flow cytometry plots show Bcl11b-mCh versus Bcl11b-YFP levels in developing T-cell populations from dual Bcl11b reporter mice, either with an intact YFP enhancer (top), or a disrupted YFP enhancer (bottom). Results are representative of two independent experiments. (C) Bar graphs showing the percentages of cells in early thymic populations with mono- and bi-allelic expression of wildtype mCherry and wildtype YFP versus mutant YFP alleles in wildtype Bcl11bYFP/mCh and Bcl11bYFPΔEnh/mCh dual reporter mice, demonstrating the reduced frequency of mutant YFP allele expression relative to the wildtype mCherry allele in the same cells. Each bar shows results from one mouse; n = 4 mice of each strain are shown. (D) DN2 progenitors were sorted for different Bcl11b allelic activation states as indicated, cultured on OP9-DL1 monolayers for 4 days, and analyzed using flow cytometry. Flow plots show Bcl11b-mCh versus Bcl11b-YFP levels of cells generated from precursors with a normal (top) or disrupted (bottom) YFP enhancer, showing defective YFP up-regulation from the mutant relative to the wildtype alleles. Enhancer disruption reduces the probability of switch-like Bcl11b activation, but does not affect expression levels after activation. Results are representative of two independent experiments. See also Figure 1—figure supplement 1, and Figure 3—figure supplement 1–4.

