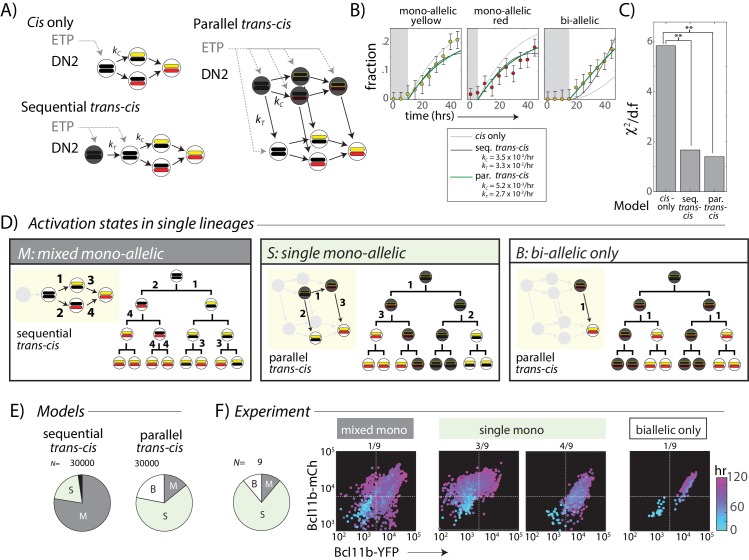
Figure 4. A trans-acting step, occurring in parallel with the cis-acting step, provides an additional input for Bcl11b activation.
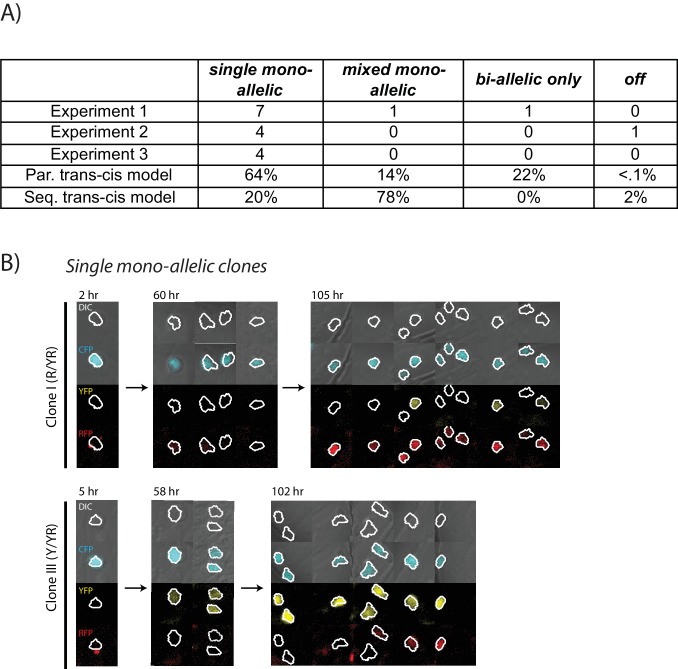
(A) Candidate models for Bcl11b activation from the DN2 stage, involving a single cis-acting switch (top left), sequential trans-, then cis-acting switches (bottom left), and parallel, independent trans- and cis- acting switches (right). (B) Plots show best fits of different models to the time evolution of Bcl11b allelic activation states, observed by timelapse imaging (Figure 2). Gray-shaded area indicates time delay for detection of indicated allelic state as a result of the time required for stable fluorescence protein accumulation. Best fit rate constants indicated in legend. (C) Bar charts show reduced chi-squared values for each model fit, that is the normalized sum-squared fit errors over all time points and allelic states, divided by the degrees of freedom (d.f.) (see Materials and methods). Both sequential and parallel trans-cis models fit the data significantly better than the cis-only model (F-test, F = 12.2, p=0.0052, sequential vs. cis-only model; F = 8.13, p=0.021, parallel vs. cis-only model). (D) Three possible classes of Bcl11b activation states observable from clonal lineage data. Lineage trees and transition diagrams show examples of simulated lineages that fall into the indicated classes. (E) Pie charts show expected distribution of allelic activation states predicted for clonal lineages of non-expressing progenitors in either the sequential (left) or the parallel (right) trans-cis model, obtained from N = 30,000 simulations, using parameters derived from bulk fitting (see Appendix). (F) Pie chart (left) shows observed distribution of activation states observed across an entire imaging time course. Colored scatterplots (right) show Bcl11b-mCh versus Bcl11b-YFP levels of single-cell lineages, falling into the indicated categories. Clones were scored according to observable fluorescence across an entire developmental trajectory, from 0 hr (cyan) to 120 hr (purple). The observed frequency of clones with ‘single mono-allelic’ expression of Bcl11b (7/9 = 77%) is significantly different than that predicted for the sequential trans-cis Model (20.1%, **- p<0.001, χ2 = 14.9, d.f. = 1), but not significantly different from that predicted for the parallel trans-cis Model (63.9%, χ2 = 0.27, d..f = 1, n.s.). Results are representative of three independent experiments. See Figure 4—figure supplement 2 for data for independent replicate experiments.


