Abstract
Background
Road safety has been receiving increased attention through the United Nations Decade of Action on Road Safety, and is also now specifically addressed in the sustainable development goals 3.6 and 11.2. In an effort to enhance the response to Road Traffic Injuries (RTIs), this paper aims to examine the cost effectiveness of proven preventive interventions and forms part of an update of the WHO-CHOICE programme.
Methods
Generalized cost-effectiveness analysis (GCEA) approach was used for our analysis. GCEA applies a null reference case, in which the effects of currently implemented interventions are subtracted from current rates of burden, in order to identify the most efficient package of interventions. A population model was used to arrive at estimates of intervention effectiveness. All heath system costs required to deliver the intervention, regardless of payer, were included. Interventions are considered to be implemented for 100 years. The analysis was undertaken for eastern sub-Saharan Africa and Southeast Asia.
Results
In Southeast Asia, among individual interventions, drink driving legislation and its enforcement via random breath testing of drivers at roadside checkpoints, at 80% coverage, was found to be the most cost-effective intervention. Moreover, the combination of “speed limits + random breath testing + motorcycle helmet use”, at 90% coverage, was found to be the most cost-effective package. In eastern sub-Saharan Africa, enforcement of speed limits via mobile/handheld cameras, at 80% coverage, was found to be the most cost-effective single intervention. The combination of “seatbelt use + motorcycle helmet use + speed limits + random breath testing” at 90% coverage was found to be the most cost-effective intervention package.
Conclusion
This study presents updated estimates on cost-effectiveness of practical, evidence-based strategies that countries can use to address the burden of RTIs. The combination of individual interventions that enforces simultaneously multiple road safety measures are proving to be the most cost-effective scenarios. It is important to note, however, that, in addition to enacting and enforcing legislation on the risk factors highlighted as part of this paper, countries need to have a coordinated, multi-faceted strategy to improve road safety.
Electronic supplementary material
The online version of this article (10.1186/s12962-018-0161-4) contains supplementary material, which is available to authorized users.
Keywords: Cost-effectiveness analysis, Road traffic injury, Road safety, Priority setting, Resource allocation, Expansion path, WHO-CHOICE, Abdulgafoor m. bachani, Dan chisholm
Background
Annually, 1.25 million people die in road crashes worldwide [1]. Road traffic injuries (RTIs) represent the tenth leading cause of death among all age groups [2], and are predicted to be the seventh leading cause of death by 2030 [1]. RTIs are the leading cause of death among persons aged 15–29 years [1], and pedestrians, bicyclists, and motorcyclists represent 49% of all road traffic deaths [1]. The African region has the highest rates of road traffic deaths. RTIs are not only a public health problem, but also a development issue. As a result of RTIs, it has been estimated that low and middle-income countries (LMICs) lose approximately 3% of their gross domestic product (GDP) each year [1]. In recognition of the scale of the problem, road safety has been receiving increased attention through the United Nations Decade of Action on Road Safety, and it is also now specifically addressed in two of the sustainable development goals (SDGs). SDG target 3.6 calls for halving the number of global deaths and injuries from road traffic accidents by 2020 [3].
In an effort to enhance the response to RTIs, this paper aims to examine the cost effectiveness of proven interventions. This work forms part of an update of the WHO-CHOICE programme. Generalized cost-effectiveness analysis (GCEA) is used, which enables the efficiency of current interventions to be assessed alongside that of new interventions [4]. All currently recommended interventions are included in the analysis individually, and then as packages of care, based on combining the most cost-effective interventions.
For the purposes of consistency and comparability, this paper largely adopts the framework of an earlier WHO-CHOICE analysis [5, 6]. That analysis concluded that combined enforcement strategies represent the most efficient way to reduce the burden of RTIs, since combinations benefit from synergies on the cost side while producing greater overall health gain. This new analysis builds on that earlier work by using updated attributable fractions of RTIs associated with the different road users groups (pedestrians, bicyclists, car occupants, etc.) for our regions of interest, also by extending the time horizon of implementation from 10 years to 100 years. The following were also updated: the prevalence and distribution of RTIs (both fatal and non-fatal), the population sizes and mortality rates, the health-state valuations for long-term sequelae of RTIs, as well as the prices of the resources used in interventions.
Methods
Detailed descriptions of the methods employed in WHO-CHOICE have been published previously [4, 7]. The goal of WHO-CHOICE is to compare both current and new interventions in terms of cost effectiveness. In this paper, we describe specific methods related to RTIs. The base year of 2010 was selected to be in line with the 2010 Global Burden of Disease study [8], whose data form the base of many of the disease models used in WHO-CHOICE. The analysis was undertaken for the eastern sub-Saharan Africa and Southeast Asia regions [9].
To allow for comparison of results in a sector-wide analysis, the WHO-CHOICE project evaluates interventions across a range of diseases and risk factors, using common methods. Health outcomes are measured as the gain in healthy life years (HLYs) due to an intervention. The use of HLYs allows for priority setting across the health sector since it facilitates comparison across different diseases. HLYs are reported both discounted at 3% per annum and undiscounted. WHO-CHOICE adopts the costing perspective of “the health system”, by which is meant the ensemble of actions and actors whose primary intent is to improve human health. The analysis, therefore, contains all direct, market-valued costs, whether public or private, that are required to deliver the intervention, regardless of payer. All costs are discounted at 3% per annum. Interventions are considered to be implemented for 100 years.
Identification of risk factors and interventions for road traffic injuries
As for the previous WHO-CHOICE analysis, a dynamic system modelled with a Haddon matrix [10] was used as a reference framework for identifying factors that have an impact on RTI. Each cell of the matrix allows opportunities for an intervention to reduce road traffic injuries. Factors in italics are those included in the analysis (see Table 1).
Table 1.
The Haddon matrix
| Phase | Factors | ||
|---|---|---|---|
| Human | Vehicle | Environment | |
| Pre-crash | |||
| Crash prevention | Information Attitudes Impairment Police enforcement |
Roadworthiness Lighting Braking Handling Speed management |
Road design Road layout Speed limits Pedestrian facilities |
| Crash | |||
| Injury prevention during the crash |
Use of restraints
Impairment |
Occupant restraints Other safety devices Crash-protective design |
Forgiving roadside |
| Post-crash | |||
| Life sustaining | First-aid skill Access to hospital |
Ease of access Fire risk |
Rescue facilities Congestion |
Source: World report on road traffic injury prevention, Fig. 1.3; factors in italics are those included in the analysis
This analysis evaluates 13 individual and combination interventions. They are drawn from recommendations in the the World report on road traffic injury prevention [10] and are mainly focused on pre-event road safety measures, targeting change in human behaviour, due to the availability of robust evidence on their effectiveness and feasibility (see Table 2).
Table 2.
Interventions included in the analysis
| # | Scenario name | Intervention | Description |
|---|---|---|---|
| 1 | RBT | Random breath testing | Drink driving legislations and its enforcement via random breath testing of drivers at roadside checkpoints |
| 2 | ESL | Enforcement of speed limits | Sustained effort by traffic enforcement teams to raise the perceived risk of drivers being caught via the use of mobile/hand held speed cameras at randomly chosen checkpoint sites |
| 3 | HUB | Bicycle helmet use | Legislation and enforcement of helmet use by bicyclists aged 15 years or less |
| 4 | HUM | Motorcycle helmet use | Legislation and enforcement of helmet use among riders of moped and motorcycles |
| 5 | SBU | Seatbelt use | Legislation and enforcement of seat belt use in cars (drivers and passengers) |
| 6 | SBU_HUM | Seatbelt use + motorcycle helmet use | |
| 7 | SBU_HUM_RBT | Seatbelt use + motorcycle helmet use + random breath testing | |
| 8 | SBU_HUM_ESL | Seatbelt use + motorcycle helmet use + enforcement of speed limits | |
| 9 | SBU_HUM_ESL_RBT | Seatbelt use + motorcycle helmet use + enforcement of speed limits + random breath testing | |
| 10 | SBU_HUM_ESL_RBT_HUB | Seatbelt use + motorcycle helmet use + enforcement of speed limits + random breath testing + bicycle helmet use | |
| 11 | ESL_RBT | Enforcement of speed limits + random breath testing | |
| 12 | ESL_RBT_HUM | Enforcement of speed limits + random breath testing + motorcycle helmet use | |
| 13 | ESL_RBT_SBU | Enforcement of speed limits + random breath testing + seatbelt use | |
Key parameters in this analysis were the prevalence and distribution of RTIs, both fatal and non-fatal, the prevalence and distribution of risk factors for RTIs, the prevalence, distribution and effectiveness of interventions to reduce RTIs, the population size and mortality rates, and the health state valuations for the long-term sequelae of RTIs.
Attribution of RTIs by road user group
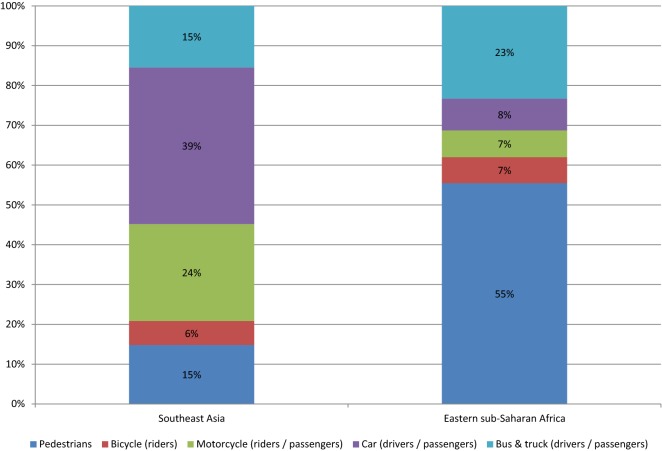
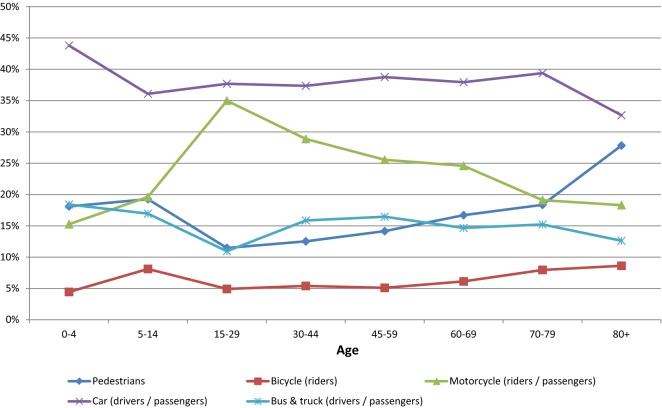
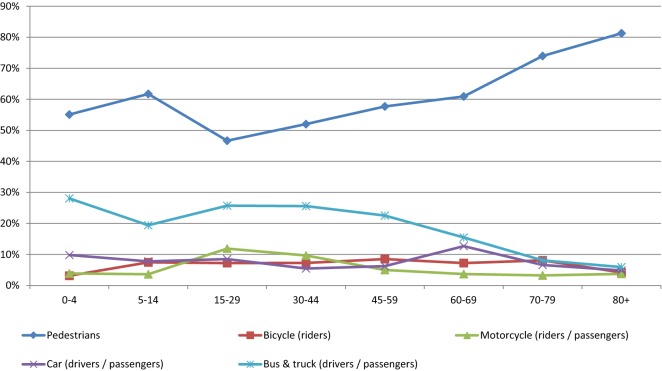
A literature review to give an overview of published data between 2006 and 2014 on fatal and non-fatal road traffic injuries, their risk factors and sequelae was conducted (see Additional file 1). The attributable fractions are calculated separately for all risk factors at the regional level based on the epidemiological evidence (e.g. exposure rates) from the countries in the region, weighted by population size. Key data on fatal and non-fatal injuries by road user type, sex and age group was provided by the International Injury Research Unit of the Johns Hopkins Bloomberg School of Public Health, which maintains and develops a global database of RTIs. Information collected with the literature review was used in triangulation of the attribution of the RTIs by road user group in combination of the data provided by the Johns Hopkins Bloomberg School of Public Health and the findings of the original literature review that informed the original model creation along with its attribution distribution (Figs. 1, 2, 3).
Fig. 1.
Distribution of road traffic fatalities by road user type calculated based on data provided by the International Injury Research Unit of Johns Hopkins Bloomberg School of Public Health
Fig. 2.
Age distribution of fatalities by road user type in Southeast Asia. Calculated based on data provided by the International Injury Research Unit of Johns Hopkins Bloomberg School of Public Health
Fig. 3.
Age distribution of fatalities by road user type in Eastern sub-Saharan Africa. Calculated based on data provided by the International Injury Research Unit of Johns Hopkins Bloomberg School of Public Health
Attribution of RTIs by risk factor
To measure the independent contribution of different risk factors to overall rates of RTIs in the population, we used the population attributable fraction (PAF), which can be defined as the fraction of incident cases attributable to the risk exposure:
Estimation of intervention effectiveness
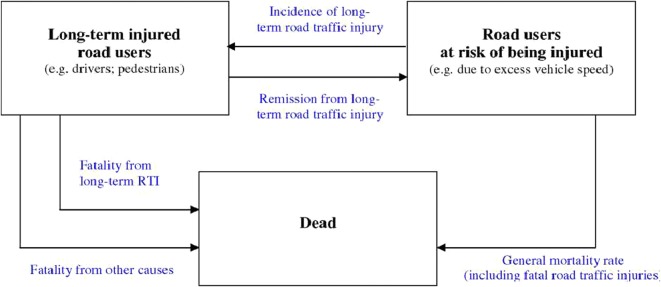
Interventions are at first compared to a hypothetical scenario where the known effects of implemented interventions are removed, referred to as the null scenario. Then the marginal impacts of interventions are evaluated with reference to the null scenario. A multi-state population model [11] was used to estimate scenarios (see Fig. 4). Further details on the methods can be found in [5]. Non-fatal acute injuries of short term duration (e.g. bruises, cuts) were not considered in the analysis.
Fig. 4.
Population model for estimating health impact of road safety measures
(Source: Road traffic injury prevention: an assessment of risk exposure and intervention cost effectiveness in different world region, 2008 [5], Fig. 8)
The same estimates of the effects of interventions as in the previous WHO analysis [5] were used (see Additional file 2). This is due to the fact that during initial literature scoping on the intervention effects in the regions modelled, no papers of suitable focus and/or quality were found to enable updating of the sub-model of the intervention effect estimates in the targeted countries. The estimates used in this analysis of the incidence, prevalence and case fatality rates of RTIs, as well as their associated levels of disability are also shown in Additional file 2. The impact of the selected interventions on population health were evaluated individually, and then as a combination by multiplying the effects of each individual intervention.
Intervention costing
Costs of interventions were estimated at the health system level, and include the costs of all market-valued inputs required to deliver the intervention. For example, costs include those of the passage of legislation, the enforcement of legislation and programme management [12]. For “bicycle helmet use” and “motorcycle helmet use” interventions, the costs of equipping bicyclists and motorcyclists with helmets were included, since these costs represent an integral component of those interventions. For the “seatbelt use” intervention, the costs of installing driver and passengers seatbelts in cars not already so equipped were included. Costs are discounted at 3% per annum, assuming a 100 year implementation period. Capital costs are annualized over the lifetime of the asset. All prices are in 2010 International Dollars. 2010 was chosen as the baseline year in line with the 2010 Global Burden of Disease epidemiological data which forms the base of many of the disease models used in WHO-CHOICE. The main costing assumptions are shown in Additional file 2.
Results
The results for each intervention individually, and then as a package, are presented in Tables 3 and 4.
Table 3.
Costs, effects and cost effectiveness of road safety measures in Southeast Asia over 100 years
| Intervention (legislation and enforcement) | Pop° coverage (%) | Total costs per 10 million population (I$ 2010) | Healthy life years (HLY) gained per 10 million population | ACER (I$ per HLY) | ICER (I$ per HLY) |
|---|---|---|---|---|---|
| Random breath testing | 80 | 117,632,481 | 52,288 | 2250 | Dominated |
| Enforcement of Speed limits | 80 | 120,598,909 | 44,216 | 2727 | Dominated |
| Bicycle helmet use | 80 | 111,809,164 | 1068 | 104,648 | Dominated |
| Motorcycle helmet use | 90 | 169,026,306 | 51,497 | 3282 | Dominated |
| Seatbelt use | 50 | 102,206,381 | 12,058 | 8476 | Dominated |
| Seatbelt use + motorcycle helmet use | 90 | 185,043,479 | 63,644 | 2907 | Dominated |
| Seatbelt use + motorcycle helmet use + random breath testing | 90 | 204,664,782 | 116,168 | 1762 | Dominated |
| Seatbelt use + motorcycle helmet use + enforcement of speed limits | 80 | 202,251,594 | 108,096 | 1871 | Dominated |
| Seatbelt use + motorcycle helmet use + enforcement of speed limits + random breath testing | 90 | 224,072,895 | 160,738 | 1394 | 1 552 |
| Seatbelt use + motorcycle helmet use + enforcement of speed limits + random breath testing + bicycle helmet use | 90 | 249,482,034 | 161,811 | 1542 | 23,692 |
| Enforcement of speed limits + random breath testing | 80 | 139,450,546 | 96,620 | 1443 | Dominated |
| Enforcement of speed limits + random breath testing + motorcycle helmet use | 90 | 205,065,577 | 148,493 | 1381 | 1381 |
| Enforcement of speed limits + random breath testing + seatbelt use | 80 | 158,109,184 | 108,774 | 1454 | Dominated |
Table 4.
Costs, effects and cost effectiveness of road safety measures in Eastern sub-Saharan Africa over 100 years
| Intervention (legislation and enforcement) | Pop° coverage (%) | Total costs per 10 million population (I$ 2010) | Healthy life years (HLY) gained per 10 million population | ACER (I$ per HLY) | ICER (I$ per HLY) |
|---|---|---|---|---|---|
| Random breath testing | 80 | 371,264,947 | 8242 | 45,048 | Dominated |
| Enforcement of speed limits | 80 | 372,557,382 | 14,576 | 25,559 | Dominated |
| Bicycle helmet use | 80 | 367,527,956 | 243 | 1,514,136 | Dominated |
| Motorcycle helmet use | 90 | 385,934,475 | 6191 | 62,343 | Dominated |
| Seatbelt use | 50 | 336,588,617 | 3480 | 96,715 | Dominated |
| Seatbelt use + motorcycle helmet use | 90 | 439,366,375 | 9688 | 45,353 | Dominated |
| Seatbelt use + motorcycle helmet use + random breath testing | 90 | 495,706,294 | 17,972 | 27,583 | Dominated |
| Seatbelt use + motorcycle helmet use +enforcement of speed limits | 80 | 485,490,048 | 24,335 | 19,950 | Dominated |
| Seatbelt use + motorcycle helmet use + enforcement of speed limits + random breath testing | 90 | 551,981,331 | 32,649 | 16,907 | 16,907 |
| Seatbelt use + motorcycle helmet use + enforcement of speed limits + random breath testing + bicycle helmet use | 90 | 612,222,569 | 32,892 | 18,613 | 247,240 |
| Enforcement of speed limits + random breath testing | 80 | 427,607,093 | 22,846 | 18,717 | Dominated |
| Enforcement of speed limits + random breath testing + motorcycle helmet use | 90 | 496,182,560 | 29,060 | 17,074 | Dominated |
| Enforcement of speed limits + random breath testing + seatbelt use | 80 | 482,432,030 | 26,417 | 18,262 | Dominated |
Population-level effects of interventions
The effectiveness of interventions are reported in healthy life years (HLYs) gained due to the specific intervention (Tables 3 and 4).
Because the highest road fatalities are among car drivers and passengers in Southeast Asia (39% of all fatalities, Fig. 1), drink driving legislation and its enforcement via “random breath testing” at roadside checkpoints was found to be the most effective single intervention in this region. The legislation “motorcycle helmet use”, and its enforcement, was found to be the second most effective single intervention; this is consistent with the high proportion of motorcycles in this region and the percentage of road fatalities among this road user group (24%, Fig. 1).
In eastern sub-Saharan Africa, the enforcement of “speed limits” via mobile/handheld cameras at 80% coverage was found to be the most effective single intervention, probably reflecting the fact that pedestrians account for more than 50% of road fatalities among all road user groups in this region (see Fig. 1).
The legislation and enforcement of “bicycle helmet use”, at 80% coverage, was found to be the least effective single intervention in both regions.
Among the combination of interventions, a scenario that combined all five individual interventions was found to be the most effective in both regions.
Population level costs of interventions
The total costs estimated for motorcycle helmet use include not only the costs of the passage of legislation and its enforcement but also the costs to the household of purchasing safety equipment, which may explain why this intervention represents the most costly single intervention in both sub-regions. The household cost component is also added to the costs of “seatbelt use” and “bicycle helmet use”; the costs of “seatbelt use” is applied to cars that are not already equipped and “bicycle helmet use” targets only children aged 15 years or less (Tables 3 and 4).
Economies of scope are realised by combining individual interventions due to the synergies that exists between different enforcement strategies.
Cost effectiveness of interventions
The cost effectiveness of individual interventions and their combinations are presented in Tables 3 and 4. Cost-effectiveness ratios are reported as costs (in international dollars) per HLY gained.
Among single interventions, “random breath testing”, at 80% coverage, was found to be the most cost-effective intervention in Southeast Asia, whereas in eastern sub-Saharan Africa, it was “speed limits”, at 80% coverage.
Combinations of individual interventions were found to be the most cost-effective: “speed limits + random breath testing + motorcycle helmet use”, at 90% coverage, in Southeast Asia and “seatbelt use + motorcycle helmet use + speed limits + random breath testing”, at 90% coverage, in eastern sub-Saharan Africa.
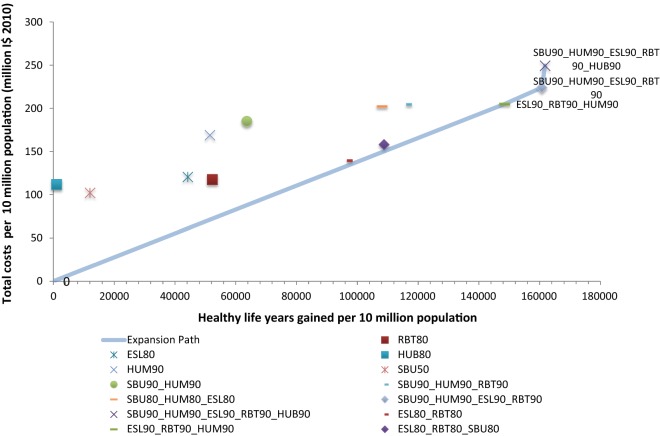
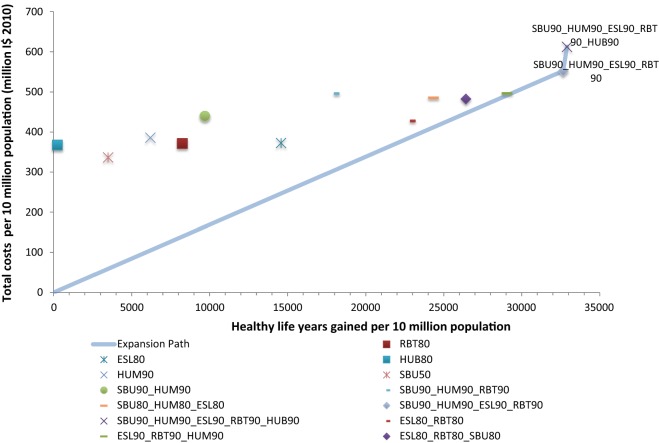
Figures 5 and 6 show the expansion path a decision maker could follow to achieve the maximum health gain for a given level of expenditure. The expansion path shows the order in which each intervention would be adopted based on its incremental cost-effectiveness ratio, compared to the previously adopted intervention, until no more health gain is possible [4].
Fig. 5.
Cost-effectiveness expansion path for Southeast Asia. Refer to Table 2 for interventions’ labels
Fig. 6.
Cost-effectiveness expansion path for Eastern sub-Saharan Africa. Refer to Table 2 for interventions’ labels
Following the expansion path in Fig. 5, in Southeast Asia policymakers would first implement “speed limits + random breath testing + motorcycle helmet use”, at 90% coverage, and when additional resources become available, add “seatbelt use”, at 90% coverage, followed by “bicycle helmet use”, also at 90% coverage.
In eastern sub-Saharan Africa, after “seatbelt use + motorcycle helmet use + speed limits + random breath testing”, at 90% coverage, a policymaker could add “bicycle helmet use”, also at 90% coverage, to maximize health gain (see Fig. 6).
Discussion
This paper adopts the framework of the 2012 study and is showing that the most cost effective interventions are essentially unchanged. However, the ranking of interventions is slightly different. Bicycle helmet use, while being on the expansion path (as a single intervention) in the previous analysis for countries in sub-Saharan Africa, is now shown to be less cost effective in this update unless combined with other interventions. The combination of speed limits, random breath testing and motorcycle helmet use at 90% coverage also appears on the expansion path in this update, and is the most cost effective combination of interventions in Southeast Asia, while it was dominated in the previous analysis. Nevertheless, these findings corroborate the conclusion of the previous analysis stating that combined enforcement strategies represent the most efficient way to reduce the burden of RTIs.
The analysis presented in this paper underscores the cost-effective nature of interventions to prevent road traffic injuries in low-income and lower middle-income countries. As previous studies have demonstrated, compared to other public health measures, strategies to improve road safety are cost-effective interventions [6, 13–15]. Our analysis shows that interventions aimed at enforcing legislation for road safety are especially effective, as they improve cost efficiencies while also enhancing gains in effectiveness.
The interventions included in our analysis are in line with the recently proposed Save-LIVES technical package published by WHO [16]. This package was developed to provide a comprehensive, evidence-based set of tools to address the growing burden of RTIs globally. Based on the recommendations included in this package, legislation and its enforcement are the cornerstones of an effective road safety programme. Our findings, which show significant potential gains as a result of enacting and enforcing legislation targeting the leading risk factors for road traffic injuries, support this recommendation.
As the United Nations Decade of Action for Road Safety reaches its final years, and with the goal of halving the world’s road traffic deaths by the year 2020 (SDG 3.6) upon us, there is an increased sense of urgency to address the burden of RTIs globally [3, 17]. Action needs to be taken at national levels, and countries should identify and implement strategies to improve road safety within their borders. In recognition of the fact that policy-makers work under resource-constrained conditions, and have to make decisions about competing programs, our analysis presents a practical approach that identifies the most cost-effective individual interventions that countries could implement first, followed by an expansion strategy that can be employed as more resources become available. Such a phased approach is more likely to be more feasible than an all-or-nothing option.
A limitation of our analysis is that we take a regional perspective, rather than a country specific one, and that we present analysis for only two regions in the world. These are, however, regions that have high burdens of RTIs and related fatalities. It is also expected that the findings would hold true at country level.
Conclusion
This study presents updated estimates on cost-effectiveness of practical, evidence-based strategies that countries can use to address the burden of RTIs. It is important to note, however, that, in addition to enacting and enforcing legislation on the risk factors highlighted as part of this paper, countries need to have a coordinated, multi-faceted strategy to improve road safety that includes leadership and coordination of activities around road safety; efficient and reliable mechanisms to gather data that would aid in understanding the burden as well as evaluating the effectiveness and efficiency of programs; infrastructural improvements; a focus on vehicle safety standards; and a coordinated post-crash care system that is aimed at minimizing the impact of a road accident on the individual.
Additional files
Additional file 1. Detailed results of the literature review (2006–2014).
Additional file 2. Effect sizes and costing assumptions.
Authors’ contributions
AHR run the multi-state population model to estimate each scenario, performed the costing and the cost-effectiveness analysis, and drafted the manuscript. AMB provided conceptual input and contributes to the discussion part. JAL provided conceptual input, quality control and supervised the analysis. TL did the literature review and updated the model accordingly. DC as the lead author of the previous analysis, provided quality control. All authors contributed to the edit of the manuscript. All authors read an approved the final manuscript.
Authors’ information
AHR, JAL, TL and DC are all employees of the World Health Organization. The views expressed in this paper are those of the authors and they do not necessarily represent the views of the WHO.
Acknowledgements
We thank Adnan Hyder for his careful review and comments on the paper.
Competing interests
Not applicable.
Availability of data and materials
The datasets that support the findings of this paper are available at http://www.who.int/choice/en.
Consent for publication
Not applicable.
Ethics approval and consent to participate
Not applicable.
Funding
No funding was received for this analysis.
Publisher’s Note
Springer Nature remains neutral with regard to jurisdictional claims in published maps and institutional affiliations.
Abbreviations
- ACER
average cost-effectiveness ratio
- CHOICE
CHOosing Interventions that are Cost-Effective
- GCEA
generalized cost-effectiveness analysis
- GDP
gross domestic product
- HLY
healthy life years
- ICER
incremental cost-effectiveness ratio
- PAF
population attributable fraction
- RTI
road traffic injuries
- SDGs
sustainable development goals
- WHO
World Health Organization
Contributor Information
Ambinintsoa H. Ralaidovy, Email: ralaidovya@who.int
Abdulgafoor M. Bachani, Email: abachani@jhu.edu
Jeremy A. Lauer, Email: lauerj@who.int
Taavi Lai, Email: lait@who.int.
Dan Chisholm, Email: chisholmd@who.int.
References
- 1.World Health Organization . Global status report on road safety 2015. Geneva: WHO; 2015. [Google Scholar]
- 2.World Health Organization . Global health estimates 2015: deaths by cause, age, sex, by country and by region, 2000–2015. Geneva: World Health Organization; 2016. [Google Scholar]
- 3.United Nations. Sustainable Development Goals. https://sustainabledevelopment.un.org/sdgs. Accessed 11 Apr 2017.
- 4.Tan-TorresEdejer T, Baltussen R, Adam T, Hutubessy R, Acharya A, Evans D, Murray C. Making choices in health: WHO guide to cost-effectiveness analysis. Geneva: World Health Organization; 2003. [Google Scholar]
- 5.Chisholm D, Naci H. Road traffic injury prevention: an assessment of risk exposure and intervention cost-effectiveness in different world regions. 2008. http://www.who.int/choice/publications/d_2009_road_traffic.pdf. Accessed 11 Apr 2017.
- 6.Chisholm D, Huseyin N, Hyder AA, Tran NT, Peden M. Cost effectiveness of strategies to combat road traffic injuries in sub-Saharan Africa and South East Asia: mathematical modelling study. BMJ. 2012;344:e612. doi: 10.1136/bmj.e612. [DOI] [PMC free article] [PubMed] [Google Scholar]
- 7.Evans DB, Tan-Torres Edejer T, Adam T, Lim SS. Methods to assess the costs and health effects of interventions for improving health in developing countries. BMJ. 2005;331(7530):1457–1461. doi: 10.1136/bmj.38658.675243.94. [DOI] [PMC free article] [PubMed] [Google Scholar]
- 8.Murray C, Vos T, Lozano R, Naghavi M, Flaxman AD, Michaud C, et al. Disability-adjusted life years (DALYs) for 291 diseases and injuries in 21 regions, 1990–2010: a systematic analysis for the global burden of disease study 2010. Lancet. 2012;380(9859):2197–2223. doi: 10.1016/S0140-6736(12)61689-4. [DOI] [PubMed] [Google Scholar]
- 9.Institute for Health Metrics and Evaluation. Global health data exchange_countries. http://ghdx.healthdata.org/countries. Accessed 2 June 2016.
- 10.Peden M, Scurfield R, Sleet D, Mohan D, Hyder AA, Jarawan E, Mathers C. World report on road traffic injury prevention. Geneva: World Health Organization; 2004. [Google Scholar]
- 11.Lauer JA, Röhrich K, Wirth H, Charette C, Gribble S, Murray C. PopMod: a longitudinal four-state population model with two disease states. Cost Eff Resour Alloc. 2003;1(1):6. [DOI] [PMC free article] [PubMed]
- 12.Bertram MY, Stenberg K, Brindley C, Li J, Serje J, Watts R, Tan-Torres Edejer T. Disease control programme support costs: an update of WHO-CHOICE methodology, price databases and quantity assumptions. Cost Eff Resour Alloc. 2017;15(1):21. doi: 10.1186/s12962-017-0083-6. [DOI] [PMC free article] [PubMed] [Google Scholar]
- 13.Norton R, Hyder AA, Bishai D, Peden M. Unintentional injuries. In: Jamison DT, Breman JG, Measham AR, et al., editors. Disease control priorities in developing countries. 2nd ed. Washington, DC: The International Bank for Reconstruction and Development/The World Bank; New York: Oxford University Press; 2006. p. 737–54.
- 14.Bishai DM, Hyder AA. Modeling the cost effectiveness of injury interventions in lower and middle income countries: opportunities and challenges. Cost Eff Resour Alloc. 2006;4(1):2. doi: 10.1186/1478-7547-4-2. [DOI] [PMC free article] [PubMed] [Google Scholar]
- 15.Bachani AM, Peden M, Gururaj G, Norton R, Hyder AA. Road traffic injuries. In: Mock CN, Nugent R, Kobusingye O, Smith KR, editors. Disease control priorities. 3. Washington, DC: World Bank; 2017. pp. 35–54. [PubMed] [Google Scholar]
- 16.World Health Organization . Save LIVES—a road safety technical package. Geneva: WHO; 2017. [Google Scholar]
- 17.United Nations. United Nations decade of action for road safety 2011–2020. In: United Nations and road safety. 2011. http://www.un.org/en/roadsafety/. Accessed 26 Feb 2018.
Associated Data
This section collects any data citations, data availability statements, or supplementary materials included in this article.
Supplementary Materials
Additional file 1. Detailed results of the literature review (2006–2014).
Additional file 2. Effect sizes and costing assumptions.
Data Availability Statement
The datasets that support the findings of this paper are available at http://www.who.int/choice/en.


