

SUMMARY
Complement is a critical component of humoral immunity implicated in cancer development, however its biological contributions to tumorigenesis remain poorly understood. Using the K14-HPV16 transgenic mouse model of squamous carcinogenesis, we report that urokinase (uPA)+ macrophages regulate C3-independent release of C5a during premalignant progression that in turn regulates protumorigenic properties of C5aR1+ mast cells and macrophages, including suppression of CD8+ T cell cytotoxicity. Therapeutic inhibition of C5aR1 via the peptide antagonist PMX-53 improved efficacy of paclitaxel chemotherapy associated with increased presence and cytotoxic properties of CXCR3+ effector memory CD8+ T cells in carcinomas, dependent on both macrophage transcriptional programming and IFNγ. Together, these data identify C5aR1-dependent signaling as an important immunomodulatory program in neoplastic tissue tractable for combinatorial cancer immunotherapy.
Keywords: Squamous cell carcinoma, macrophage, CD8+ T cell, complement C5a, inflammation, immunotherapy, urokinase
SIGNIFICANCE
Anaphylatoxins and the downstream pathways they regulate are emerging tractable targets for anticancer immunotherapy. Results presented herein identify uPA-expressing macrophages as critical regulators of C3-independent C5a generation in squamous cell carcinomas (SCCs) that sustain immunosuppressive tumor immune microenvironments (TiME). Therapeutic inhibition of C5aR1 in combination with chemotherapy fostered TiME reprogramming, resulting in CD8+ T cell- dependent antitumor immune responses correlating with decreased local and peripheral T cell receptor (TCR)β diversity. Intratumoral TCRβ clonotypes were hyperexpanded and increasingly detected in matched peripherally expanded T cell populations, thereby implicating antigen-dependent peripheral priming in response to C5aR1 inhibition. These results reveal C5aR1-dependent signaling as a critical regulator of immunosuppressive TiMEs in SCCs that can be leveraged for CD8+ T cell- dependent antitumor immune responses.
IN BRIEF
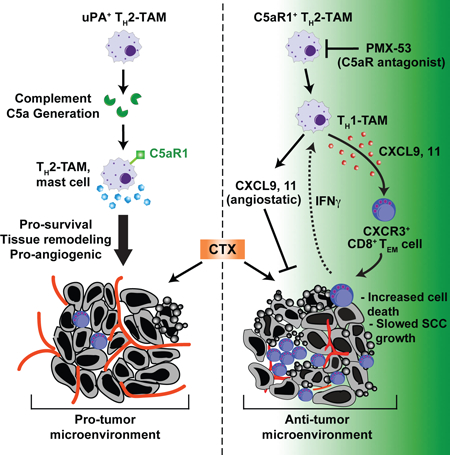
Medler et al. find that C3-independent C5a release mediated by uPA+ macrophages fosters an immunosuppressive microenvironment during squamous carcinogenesis by activating C5aR1+ mast cells and macrophages. C5aR1 inhibition improves paclitaxel efficacy by reprogramming macrophages to recruit cytotoxic CD8+ T cells.
Graphical Abstract
INTRODUCTION
As the co-dominant central mediator of humoral immunity, complement cascades are critical for recognition and elimination of pathogens and damaged cells, opsonization of pathogenic substances, and induction of anaphylactoid reactions (Schmidt et al., 2016). Acute generation of anaphylatoxins C3a, C4a, and C5a induces migration of phagocytes, degranulation of mast cells and granulocytes, and relaxation of smooth muscle cells in damaged tissues, whereas sustained complement activation instead fosters exacerbation of inflammatory pathologies (Ricklin et al., 2016). Because many of these characteristic features of tissue “damage” are also associated with chronic inflammation accompanying solid tumor development (Hanahan and Coussens, 2012; Hanahan and Weinberg, 2011; Mantovani et al., 2008), we hypothesized that complement components also functionally regulated aspects of de novo neoplastic progression.
The classical, lectin, and alternative pathways of complement activation represent primary mechanisms by which complement-induced inflammation is initiated, although extrinsic proteases associated with coagulation and fibrinolytic pathways also directly activate anaphylatoxins irrespective of their individual convertases (Amara et al., 2008; Huber-Lang et al., 2006). The classical pathway involves complement proteins complexed with immunoglobulin (Ig)G or IgM antibodies that bind antigens, typically on microbial surfaces in the context of infection, where a proteolytic cascade promotes generation of anaphylatoxins C3a, and ultimately the terminal complement mediator C5a. The alternative pathway instead involves spontaneous hydrolysis of C3 - also typically on microbial surfaces - that initiates alternative proteolytic cascades resulting in production of the C3 convertase C3bBb. While each of these pathways involves unique modes of initiation, they funnel to complement component C3 and generate similar effector molecules that initiate potent inflammatory responses in tissues.
We previously reported that B cells, humoral immunity, and immune complexes (ICs) containing complement components activate IgG receptor (FcγR) signaling pathways in infiltrating myeloid cells that foster neoplastic progression of squamous cell carcinomas (SCCs) and pancreatic adenocarcinomas (PDAs) (Affara et al., 2014; Andreu et al., 2010; de Visser et al., 2005; Gunderson et al., 2016; Schioppa et al., 2011). Since chronic activation of inflammatory pathways drives neoplastic progression of SCCs and PDAs, we hypothesized that generation of complement might also exert tumor-regulatory roles. While we previously reported that squamous carcinogenesis was independent of complement C3 (de Visser et al., 2004), herein we queried whether complement components downstream of C3 exerted tumor regulatory roles and identified C5a and its receptor as functionally significant mediators of SCC progression.
RESULTS
Infiltration of C5aR1+ Leukocytes During Neoplastic Progression in HPV16 mice
The K14-HPV16 (human papilloma virus type 16 [HPV16]) transgenic mouse model of squamous carcinogenesis is a well-characterized model of multi-stage epithelial carcinogenesis where mice express the human papillomavirus type 16 early region genes, expressed under control of a keratin 14 (K14) promoter/enhancer (Arbeit et al., 1994). Transgenic mice are born phenotypically normal; on the FVB/n background, by 1 month of age, 100% of mice develop cutaneous epidermal hyperplasia and progress to mild dysplasia by 4 months of age. By 6 months of age, mice develop high-grade dysplasias that can undergo malignant conversion to invasive SCCs in ~50% of transgenic mice, and metastasize to regional lymph nodes in ~30% of tumor-bearing animals (Coussens et al., 1996). Subjacent to benign hyperplasias of HPV16 mice, deposition of immunoglobulin (IgG), C1q, and C3- containing immune complexes (ICs) is observed that subsequently induce local recruitment of FcγR+ leukocytes that foster ongoing multi-stage carcinogenesis (Andreu et al., 2010; de Visser et al., 2005). Despite accumulation of ICs in premalignant dermal stroma, neoplastic progression is independent of C3, and the classical and alternative complement pathways (de Visser et al., 2004). Because fibrinolytic and coagulation cascade proteases can also generate C5a by C5 convertase- independent mechanisms (Amara et al., 2008; Huber-Lang et al., 2006), we reasoned that neoplastic tissues from both C3-proficient and C3-deficient HPV16 mice would be characterized by C5a accumulation. Indeed, HPV16/C3Tm1Crr/Tm1Crr (HPV16/C3−/−) mice exhibited abundant deposition of C5a, associated with increased presence of high affinity C5a receptor (C5aR1)+ cells in stromal regions adjacent to premalignant dysplasias, similar to their C3-proficient littermates (Figure 1A). Deposition of C5a was a prominent feature of benign hyperplasias, as well as early and late dysplasias in HPV16 mice (1-, 4-, and 6-month old mice, respectively), indicating C5a deposition is an early feature of squamous carcinogenesis (Figure 1B and S1A).
Figure 1. C5aR1+ Leukocytes Infiltrate Neoplastic Skin in HPV16 Mice.
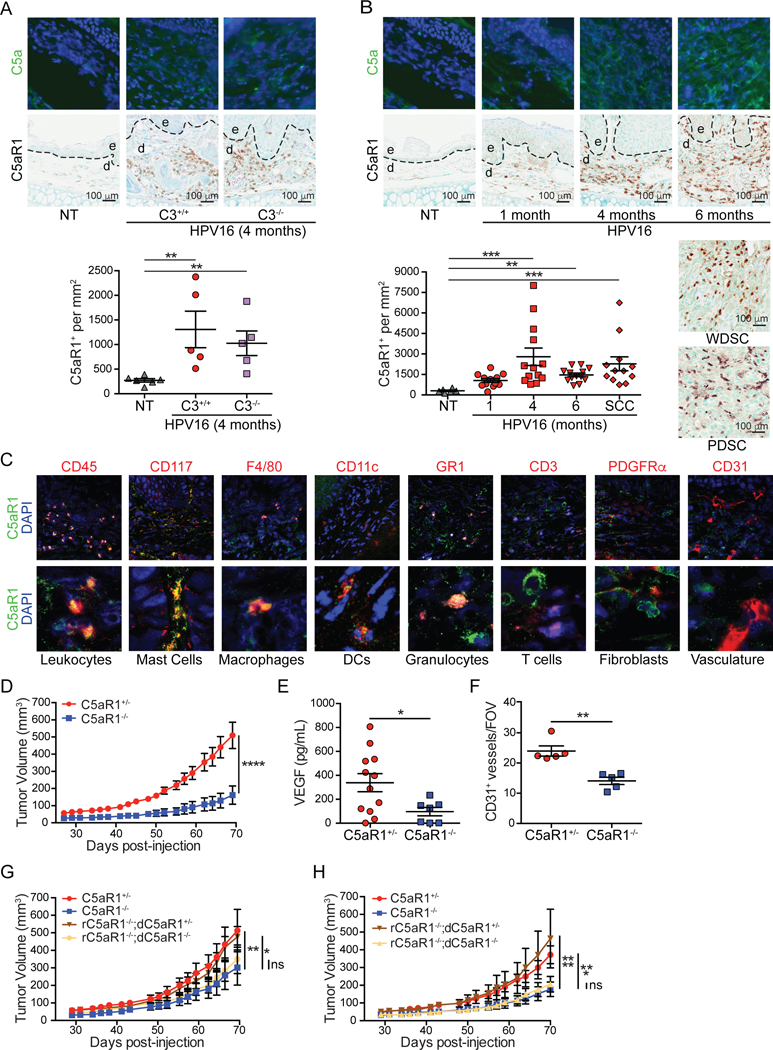
(A) Immunofluorescent (IF) detection of C5a (green, DAPI [blue]; top row), and immunohistochemistry (IHC) of C5aR1 (brown; middle row), and quantification (bottom) of ear skin from nontransgenic (NT), and 4-month old C3+/+ versus C3−/− HPV16 mice. Representative images are shown. (B) IF detection of C5a (green, DAPI [blue]; top row), and IHC of C5aR1 (brown middle row and side), and quantitation (bottom) from NT mice and canonical timepoints from HPV16 mice. Representative images are shown. (C) Co-IF of C5aR1 (green) with indicated lineage markers in dysplastic ear skin from HPV16 mice. Representative images for each cell type are shown. Boxed areas on top are shown at higher magnification on bottom. (D) PDSC5 tumor growth kinetics in C5aR1+/− and C5aR1−/− mice (n≥8 mice/group). (E) Quantitation of VEGF protein in lysates by ELISA from SCCs in (D) (F) Manual IHC analysis of CD31+ vessels from SCCs in (D). Please define FOV. (G and H) Growth kinetics of PDSC5 cells admixed with C5aR1+/− or C5aR1−/− BMMCs (G) or BMMFs (H) from donor (d) mice, implanted into syngeneic recipient (r) mice of indicated genotypes. Mice from two independent experiments depicted (BMMCs, n=9–16; BMMΦs n=11–15 mice/group). Data are represented as mean ± SEM. * p < 0.05; ** p < 0.01; *** p < 0.001; **** p < 0.0001. Significance determined by one-way (A-B) or two-way (D, G-H) ANOVA with Bonferroni post-test for multiple comparisons or by unpaired Student’s t test with Welch’s correction (E-F). Each data point reflects an individual mouse. In (A-C), epidermal (e) and dermal (d) regions are indicated, with dotted lines reflecting epidermal-dermal interface. See also Figures S1 and S2.
To exert biologic functionality, C5a binds and activates C5aR1 or its alternative receptor C5L2. Immunostaining for C5aR1 revealed increased presence of C5aR1+ cells in dermal regions of neoplastic skin with highest concordance to C5a deposition in focal regions of high-grade dysplasia and maintained in well-differentiated and poorly-differentiated SCCs (WDSC and PDSC, respectively; (Figure 1B), while presence of C5L2+ cells was only modestly increased in a subset of high-grade dysplasias (Figure S1B). Co-immunofluorescent staining identified C5aR1+ cells as CD45+ leukocytes, including CD117+ mast cells, F4/80+ macrophages, CD11c+ dendritic cells (DCs), and Gr1+ granulocytes (Figure 1C). C5aR1 was not detected on CD31+ vasculature, platelet-derived growth factor receptor (PDGFR)α+ cells (presumably dermal fibroblasts), or on CD3+ T cells (Figure 1C), consistent with results from flow cytometry (Figure S1C-D), which also identified C5aR1+-γδ T cells and NK cells (Figure S1E).
C5aR1+ Leukocytes Mediate Squamous Cell Carcinogenesis
Because C5aR1+ leukocytes infiltrate premalignant skin of HPV16 mice, we evaluated whether its expression was functionally significant with regards to orthotopic SCC growth. We assessed growth of two HPV16 SCC-derived cell lines, PDSC5 and WDSC1, derived from poorly and well differentiated SCCs, respectively (Affara et al., 2014) following intradermal transplantation into C5ar1tm1Cge/+ (C5aR1+/−) versus C5aR1−/− syngeneic hosts. Growth of both PDSC5 and WDSC1 tumors was significantly growth-restricted in C5aR1-deficient recipients (Figure 1D and S2A). End-stage SCCs in C5aR1−/− mice exhibited significantly reduced levels of vascular endothelial growth factor (VEGF) (Figure 1E) and diminished density of CD31+-vasculature (Figure 1F).
Given that mast cells, macrophages, and granulocytes expressed the highest levels of C5aR1 (Figure 1C and S1C), and our previous findings that cKIT+ mast cells and macrophages, but not granulocytes, regulate inflammation and angiogenesis in neoplastic tissue of HPV16 mice (Affara et al., 2014; Andreu et al., 2010; Coussens et al., 1999; Coussens et al., 2000; de Visser et al., 2005), we asked whether these cell types were responsible for restricted tumor growth in C5aR1−/− mice. We co-injected C5aR1+/− versus C5aR1−/− bone marrow-derived mast cells (BMMC) or macrophages (BMMΦ) 1:1 with PDSC5 cells into syngeneic recipient C5aR1−/− versus C5aR1+/− mice to assess C5aR1-dependent regulation. Implantation of either C5aR1+/− BMMCs or BMMFs into C5aR1−/− recipients restored tumor growth kinetics (Figure 1G-H) and characteristic CD31+ vascular density similar to C5aR1+/− recipients (Figure S2B-C), whereas neither C5aR1−/− BMMCs nor BMMΦs reinstated these characteristics. Admixed tumors grown in C5aR1+/− recipients exhibited characteristic growth kinetics and vascular density (Figure S2D-G). Together, these data indicate that C5aR1- mediated effector programs in mast cells and macrophages are critical protumoral regulators of squamous carcinogenesis.
We next evaluated characteristic features of de novo premalignant and malignant progression to determine if C5aR1-dependent programs were similarly critical. We generated transgenic HPV16/C5aR1−/− mice and quantitatively evaluated presence of CD45+ cells at canonical stages of neoplastic progression. This analysis revealed reduced leukocyte infiltration, including mast cells, Ly6G+ granulocytes, and F4/80+ macrophages, in premalignant skin of HPV16/C5aR1−/− versus age- matched HPV16/C5aR1+/− controls (Figure 2A-D). Despite reduced presence of these cell types, overall leukocyte complexity remained unchanged (Figure S2H). Correlating with reduced leukocyte infiltration, density of CD31+ vasculature (Figure 2E), keratinocyte proliferation (Figure 2F), and development of focal dysplasia and SCC incidence (Figure 2G) were significantly reduced in HPV16/C5aR1−/− mice, as compared to age-matched littermate controls. Together, these data indicate that C5a activation of C5aR1-expressing leukocytes is a co-dominant protumorigenic regulator of de novo squamous carcinogenesis.
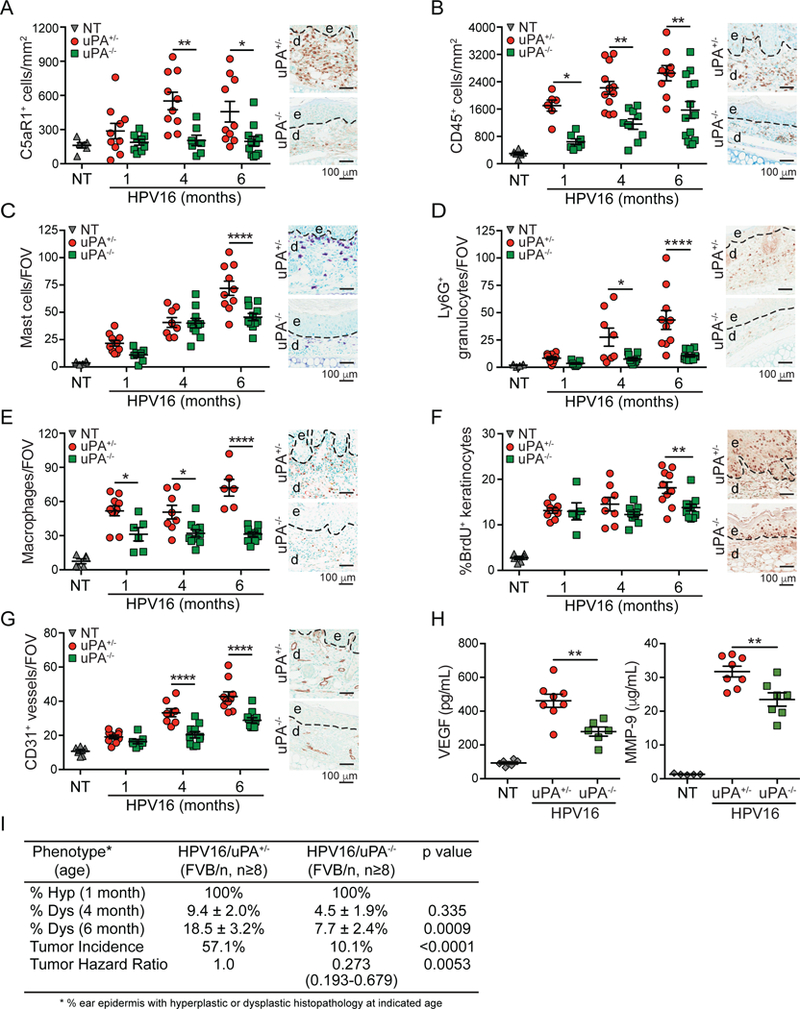
Figure 2. C5aR1 Expression Regulates Squamous Carcinogenesis in HPV16 Mice.
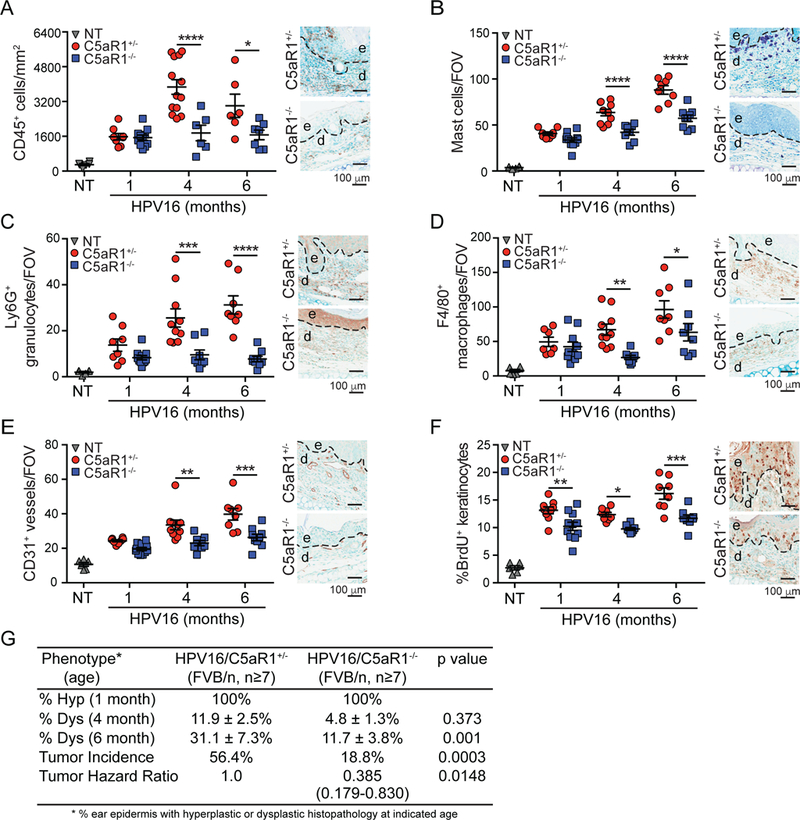
. (A-F) Automated (A) or manual (B-F) quantification of CD45+ cells (A), toluidine blue-stained mast cells (B), Ly6G+ granulocytes (C), F4/80+ macrophages (D), CD31+ vessels (E), and percentage of BrdU+ keratinocytes (F) in ear skin from HPV16/C5aR1+/− and HPV16/C5aR1−/− mice at 1-, 4-, and 6- month of age. Data points in graphs reflect independent mice, and micrographs on right are representative images from 6-month old mice showing epidermal (e), dermal (d) regions, and interface (dotted line). (G) Percentage of ear skin area from indicated genotypes of HPV16 mice exhibiting hyperplasia (hyp; n=8–11), dysplasia (dys; n=8–9), and lifetime whole body SCC incidence (HPV16/C5aR1+/− n=39 and HPV16/C5aR1−/− n=48), with significance determined by Chi-square test, and hazard ratio determined by Kaplan-Meyer analysis. Significance determined by two-way ANOVA with Bonferroni post-test for multiple comparisons unless otherwise indicated. Data represented as means ± SEM. * p < 0.05; ** p < 0.01; *** p < 0.001; **** p < 0.0001. See also Figure S2.
C5a Generation in Neoplastic Tissue
Several members of the coagulation and fibrinolytic cascade generate C5a directly in vitro, including thrombin, plasmin, and Factors IXa, Xa, and XIa (Amara et al., 2008; Huber-Lang et al., 2006), and since generation of C5a during squamous carcinogenesis was independent of C3 in HPV16 mice (de Visser et al., 2004), we hypothesized C5a regulation via one or another of these proteases. Of these, we identified plasmin as a likely candidate based on its activation by urokinase plasminogen activator (uPA), a serine protease highly expressed in numerous human solid tumors (Mekkawy et al., 2014) and in HPV16 mice as revealed by casein-plasminogen zymography of skin lysates, where both high and low molecular weight uPA increase concordantly with neoplastic progression (Figure 3A). Thus, we hypothesized that if plasmin was a significant regulator of C5a release, then uPA-deficient mice would phenocopy C5aR1-deficiency with regards to slowed tumor growth. To evaluate this, we orthotopically implanted PDSC5 cells into syngeneic uPA-proficient (Plautm1Mlg/+ [uPA+/−]) and uPA−/− mice and observed slowed orthotopic tumor growth in uPA-deficient hosts (Figure 3B). Because the implanted PDSC5 cells were uPA-proficient (data not shown), this indicated that the relevant source of uPA was stromal in origin. Using co-immunofluorescence, we found that macrophages represented a significant source of uPA in HPV16 dysplastic skin, whereas other stromal cell types yielded negligible uPA immunoreactivity (Figure 3C).
Figure 3. Urokinase Regulates Complement C5a Generation.
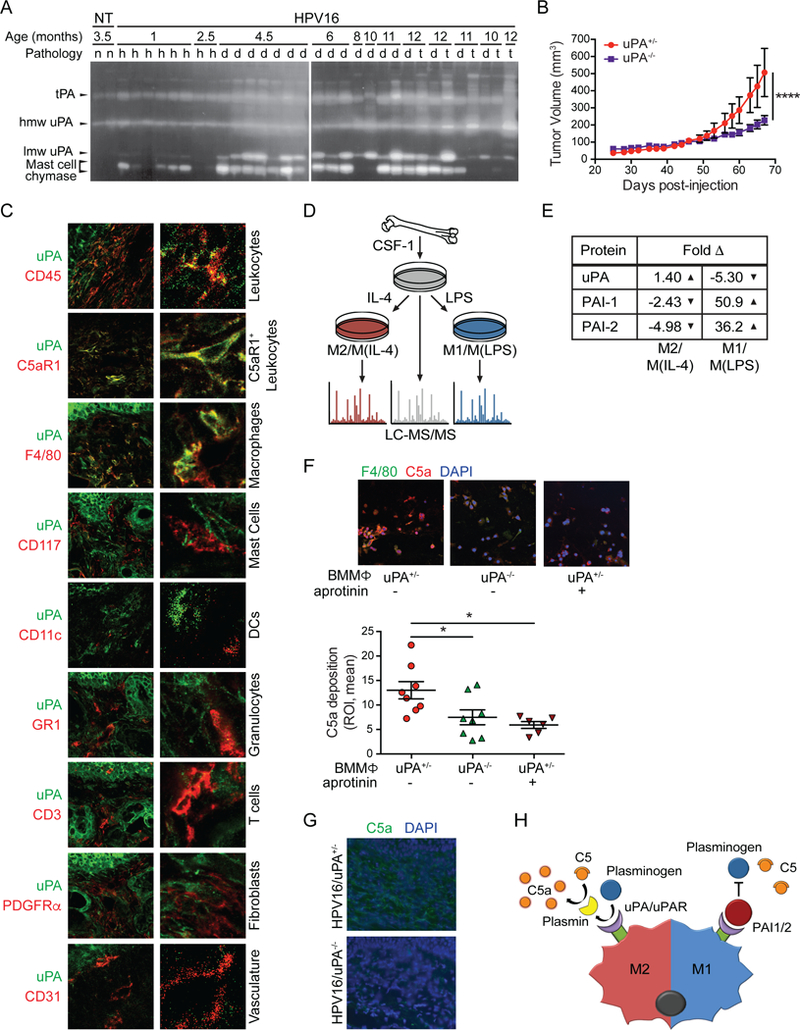
(A) Casein/plasminogen zymogram of nontransgenic (n), hyperplastic (h), dysplastic (d), and SCC (t) tissue extracts at indicated ages. Protein identity based on molecular weight. lmw, low molecular weight; hmw, high molecular weight. (B) SCC growth kinetics from PDSC5 cells, implanted in uPA+/− versus uPA−/− mice from two independent experiments (n≥17 mice/group). Significance determined by two-way ANOVA with Bonferroni post-test for multiple comparisons. (C) Co-IF analysis of uPA (green) with indicated lineage markers in dysplastic ear skin from HPV16 mice. Representative images shown. Boxed areas on top are shown at higher magnification on right. (D) Schematic of sample preparation for LC-MS/MS analysis. (E) Quantitation of fold change in protein levels of factors associated with plasminogen processing in M2/M(IL-4) and M1/M(LPS), as compared to M0/M(CSF-1) macrophages. (F) In vitro complement deposition assay of BMMΦs from uPA+/− or uPA−/− mice co-cultured with PDSC5 cells, and IF-stained for C5a (red) and F4/80 (green) (top) and quantified (bottom). Data points shown reflect two ROIs/well with each experimental condition replicated in 3–4 wells, and the experiment repeated twice. (G) IF staining of C5a (green) in tissue sections reflecting high grade dysplasia from HPV16/uPA+/− and HPV16/uPA−/− mice. Representative images are shown. (H) Model of complement activation. ‘M2’-type macrophages upregulate plasminogen processing to generate C5a, while ‘M1’-type macrophages produce negative regulators of plasminogen processing. Data are represented as means ± SEM. * p < 0.05; ** p < 0.01; *** p < 0.001; **** p < 0.0001. See also Figure S3.
Since macrophages in neoplasms reflect a continuum of phenotypes regulated in part by their cytokine/chemokine milieu (Ruffell and Coussens, 2015), we asked whether plasminogen processing was a general property of macrophages, or, instead, a property unique to the continuum of M1-type or M2-type states (reviewed in (Ruffell and Coussens, 2015)). To assess this, we generated BMMΦs, and subjected them to polarizing growth conditions using colony stimulating factor (CSF)-1 plus interleukin (IL)-4 (M2/M(IL-4)-polarized), versus CSF1 plus lipopolysaccharide (LPS) (M1/M(LPS)- polarized), and subsequently examined their proteomes via liquid chromatography tandem mass spectrometry (LC-MS/MS), as compared to control CSF-1-stimulated BMMΦs (Figure 3D). LC- MS/MS revealed a modest increase in uPA (1.4-fold) with decreased expression of plasminogen activator inhibitor (PAI)-1 and −2 (2.43-fold and 4.98-fold, respectively) in M2/M(IL-4)-BMMΦs as compared to CSF-1-stimulated controls (Figure 3E). In contrast, M1/M(LPS)-polarized macrophages exhibited a 5.3-fold decrease in uPA expression, in concert with 50.9- and 36.2-fold increased expression of PAI-1 and −2, respectively (Figure 3E), indicating that neoplasia-associated macrophages (M2-type) may facilitate plasminogen processing and C5a generation, in agreement with reports revealing macrophage-dependent generation of C5a by serine protease-dependent mechanisms (Huber-Lang et al., 2002). To examine this further, we exploited an in vitro complement activation assay by co-culturing BMMΦs from uPA+/− versus uPA−/− mice with PDSC5 cells and serum isolated from HPV16 mice, followed by C5a and F4/80 immunofluorescent staining and quantification. Whereas M(IL-4) uPA+/− macrophages mediated robust C5a generation in a serine-protease dependent manner, M(IL-4) uPA−/− macrophages exhibited significantly reduced C5a generation, comparable to aprotinin (a competitive serine protease inhibitor)-treated M(IL-4) uPA+/− macrophages (Figure 3F). Using this same assay, we asked the degree to which C5a could be generated in serum depleted of either C3 or plasminogen and revealed C3-dependent aprotinin-sensitive, and plasminogen-dependent aprotinin-insensitive C5a generation (Figure S3A), implicating both C3 and plasmin as regulators of C5a generation in vitro.
Since hallmark characteristics of neoplastic progression in HPV16 mice are C3-independent (de Visser et al., 2004), we next asked if downstream regulation of uPA represented a dominant mode of C5a generation in vivo and thus generated HPV16/Plautm1Mlg/tm1Ml9 (HPV16/uPA−/−) mice. We observed decreased C5a deposition in dermal stroma (Figure 3G) and skin lysates (Figure S3B) of HPV16/uPA−/− mice, thus supporting a significant uPA-dependent mechanism for C5a generation in vivo (Figure 3H). Moreover, HPV16/uPA−/− mice exhibited diminished recruitment of C5aR1+ cells (Figure 4A), and otherwise phenocopied HPV16/C5aR1−/− mice with regards to canonical parameters of neoplastic progression, including reduced infiltration of CD45+ leukocytes, mast cells, Ly6G+ granulocytes, and F4/80+ macrophages (Figure 4B-E), decreased BrdU+ keratinocyte proliferation (Figure 4F), reduced vascular density (Figure 4G), reduced levels of VEGF and matrix metalloproteinase (MMP)9 (Figure 4H), and reduced frequency of focal dysplasias and SCC incidence, with benign hyperplasias representing the most frequent terminal neoplastic phenotype (Figure 4I).
Figure 4. uPA Deficiency Limits Neoplastic Progression and Phenocopies C5aR1 Deficiency in HPV16 Mice.
(A-G) IHC and automated (A-B) or manual (C-G) quantitation of C5aR1+ cells (A), CD45+ leukocytes (B), toluidine blue-stained cells mast cells (C), Ly6G+ granulocytes (D), F4/80+ macrophages (E), percentage of BrDU+ keratinocytes (F), and CD31+ vessels (G) in tissue sections (ear) from HPV16/uPA+/− and HPV16/uPA−/− at 1-, 4-, and 6-months. of age. (H) VEGF and MMP9 levels in ear lysates determined by ELISA from 6-month-old HPV16/uPA+/− and HPV16/uPA−/− ears versus 4-month NT ear skin. Significance determined by unpaired Student’s t test with Welch’s correction. (I) Percentage of ear skin area from indicated genotypes of HPV16 mice exhibiting hyperplasia (hyp; n=6–7 mice per genotype), dysplasia (dys; n=9–14 mice per genotype), and lifetime whole body tumor incidence (HPV16/uPA+/− n=21, HPV16/uPA−/− n=203), with significance determined by Chi-square test, and hazard ratio determined by Kaplan-Meyer analysis. For panels A-H, data points reflect independent mice, and micrographs on right are representative images from 6-month old mice. Panels (A-E, G-H) show epidermal (e), dermal (d) regions, and interface (dotted line). Significance assessed by two-way ANOVA with Bonferroni post-test for multiple comparisons unless otherwise indicated. Data represented as means ± SEM. * p < 0.05; ** p < 0.01; *** p < 0.001; **** p < 0.0001.
C5aR1+ Cells in Human SCCs
Since protumoral pathways downstream of C5aR1 signaling regulate squamous carcinogenesis in HPV16 mice, we asked if increased presence of C5aR1+ cells characterized human SCCs. We obtained human cutaneous SCCs (cSCC), vulvar SCCs, and head and neck SCCs (HNSCC) and assessed presence of C5aR1+ cells as compared to CD45+ cells. C5aR1+ cells were prominent features of each malignancy and were significantly increased as compared to non-malignant homeostatic tissue (Figure 5A-B).
Figure 5. C5aR1 Infiltration Characterizes Human SCCs.
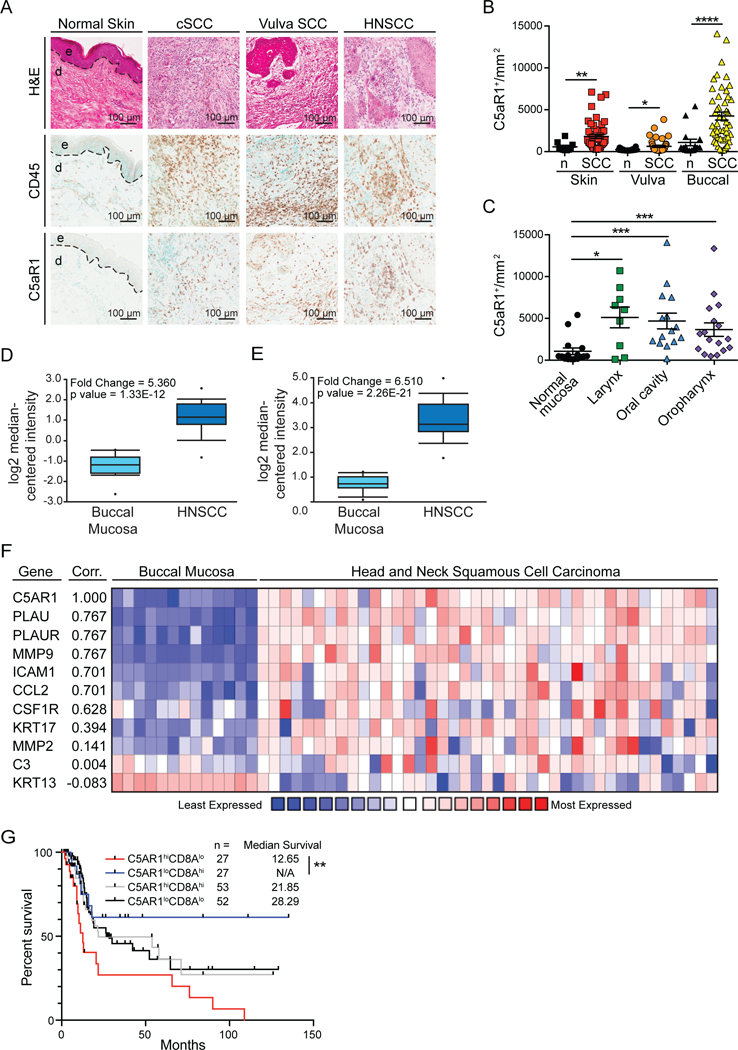
(A) Representative histopathology of cutaneous SCC, vulva SCC, and HNSCC in comparison to healthy cutaneous skin. Panels depict representative hematoxylin and eosin-stained tissue sections (top), and IHC staining for CD45 (middle) and C5aR1 (bottom) from serial sections. (B and C) Automated quantitation of C5aR1+ cells in tissue sections shown in (A) as compared to normal counterparts, with significance determined by Mann-Whitney test. (D and E) Relative expression of C5AR1 (D) and PLAU (E) comparing normal buccal mucosa (n=13) and HNSCC (n=41) from the Ginos Head-Neck dataset in Oncomine. (F) Correlation (Corr.) between C5AR1 and PLAU, PLAUR, MMP9, ICAM1, CCL2, CSF1R, KRT17, MMP2, C3, and KRT13 in the Ginos Head-Neck dataset using Oncomine coexpression heatmaps. Correlation derived from the average linkage hierarchical clustering and data displayed as log2 median-centered intensity with lowest expression in blue and highest expression in red. (G) Overall survival of HNSCC patients from the Nature 2015 TCGA cohort based on median expression of C5AR1 and CD8A. Significance determined by log-rank analyses of each patient cohort. Data represented as means ± SEM. * p < 0.05; ** p < 0.01; *** p < 0.001; **** p < 0.0001.
Vulvar SCCs are associated with high-risk HPV serotypes, as are a proportion of oropharyngeal SCCs, whereas cSCCs and other HNSCCs (laryngeal and oral cavity) typically are not. We observed that the increased presence of C5aR1+ cells was consistent across this spectrum of SCC subtypes (Figures 5B-C), indicating that C5aR1-associated inflammation reflects a general feature of squamous carcinomas. Accordingly, previously published HNSCC datasets similarly revealed increased expression of C5AR1 and PLAU (uPA) (Figure 5D-E), as compared to homeostatic buccal tissue. We also observed that coexpression of genes associated with C5AR1 expression included PLAU and PLAUR, as well as other genes associated with mast cells (MMP9, but not MMP2) and macrophage recruitment or function (CSF1R, ICAM1, CCL2) (Figure 5F). KRT17, a gene associated with HNSCC, was moderately associated with C5aR1 expression, while KRT13, a gene lost in SCCs, negatively correlated with C5aR1 expression, with no association between C5AR1 and C3 expression (Figure 5F). To determine whether C5aR was associated with clinical outcomes, we assessed the Nature 2015 TCGA dataset for survival and found significantly increased survival for patients bearing C5AR1loCD8Ahi tumors as compared to C5AR1hiCD8Alo tumors (Figure 5G), perhaps indicating that C5aR1-mediated inflammation influences CD8 T cell functionality and clinical outcomes.
C5a Inhibition Regulates Response to Chemotherapy in a CD8+ T Cell-Dependent Manner
Since genetic loss of C5aR1 significantly slowed SCC progression, we assessed whether C5aR1 might also represent a therapeutic target. To test this, PDSC5 cells were implanted intradermally into syngeneic hosts, and grown to ~50–60 mm3, at which point Alzet pumps were subcutaneously implanted delivering PMX-53, a C5aR1 peptide antagonist (Finch et al., 1999). Mice were then treated with two cycles of paclitaxel (PTX). While neither PMX-53 nor PTX monotherapy significantly altered tumor growth kinetics, combination therapy was synergistically effective in slowing SCC growth to end-stage (Figure 6A).
Figure 6. Therapeutic C5aR1 Blockade Sensitizes Established SCCs to Chemotherapy.
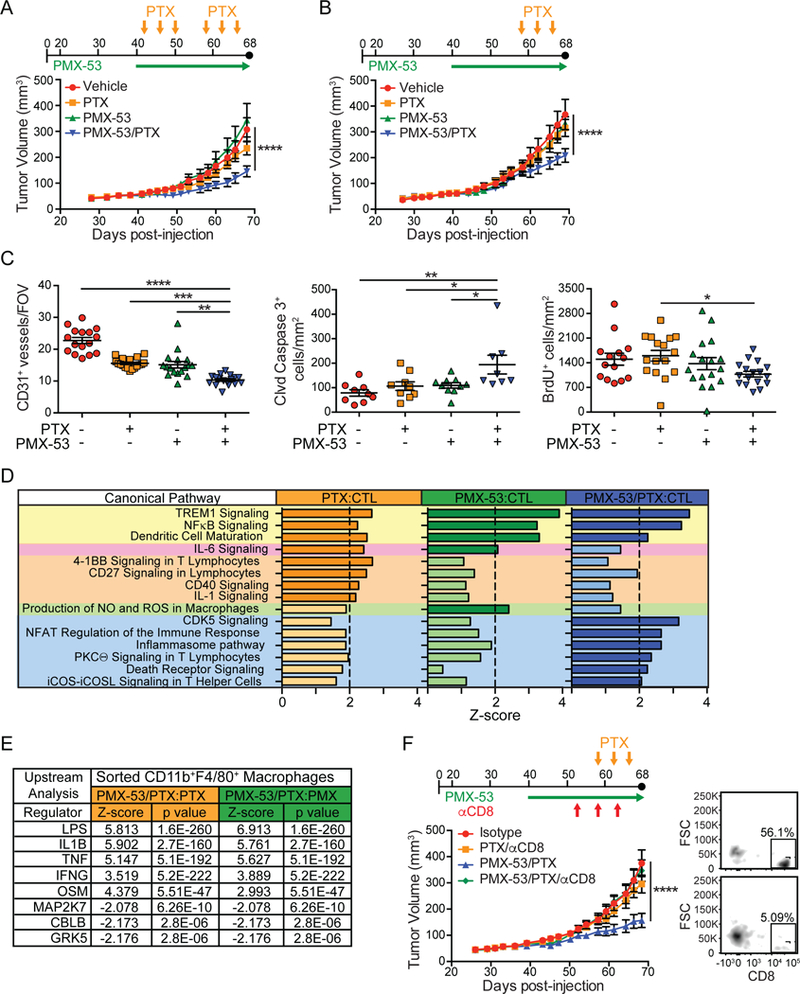
(A and B) Dosing strategies (top) and PDSC5 growth kinetics (lower graph) in early- (A) or late- (B) stage SCCs. Average tumor volumes reflecting two independent experiments (A; n=12–15) and (B; n=20–24) are shown. (C) Manual quantitation of CD31+ vessels and automated quantitation of cleaved (Clvd) caspase-3+ and BrdU+ cells in tissue sections from SCCs shown in panel (B). Each data point shown reflects an independent mouse. (D) Canonical pathway analysis comparing indicated treatment groups using IPA. Gene expression of SCCs generated using the myeloid panel from NanoString. Significant differences (Z-score > |2.0|, dark colors) indicate probability of association of gene expression from NanoString datasets with the indicated canonical pathways. Pathways shaded in yellow were increased in all groups compared to controls (CTL), while the pathway highlighted in pink was increased in PTX and PMX-53 as compared to control. Pathways highlighted in orange, green, and blue were increased in PTX, PMX-53, and PMX-53/PTX as compared to control, respectively. N=9 mice/group. (E) Upstream analysis comparing indicated treatment groups using IPA. Gene expression data from FACS-isolated CD11b+MHCII+F4/80+ macrophages using the pan-cancer immune panel (NanoString). Upstream analyses predict upstream regulators significantly activated or inhibited (Z- score > |2.0|). N = 3–5 mice/group. (F) Dosing strategy (top) and growth kinetics (lower graph) of PDSC5-SCCs in syngeneic mice treated with PTX or PMX-53/PTX, and either isotype control (IgG2b) or αCD8 mAb. Shown are mice pooled from two independent experiments (n=8–12 mice/group). At right is FACS plot showing percentage CD8+ cells (as a percentage of CD3+ cells) in tumors from control (top) versus CD8- depleted (bottom) mice. Data represented as means ± SEM. * p < 0.05; ** p < 0.01; *** p < 0.001; **** p < 0.0001, with significance assessed by one-way (C) or two-way (A-B, F) ANOVA with Bonferroni post-test for multiple comparisons. See also Figure S4-S5.
To determine if SCCs remained responsive to combined therapy in a more advanced setting, we assessed SCC growth in mice given only the later cycle of PTX and observed a similar inhibition of SCC growth with combination therapy (Figure 6B). End-stage SCCs from combination therapy- treated mice exhibited reduced CD31+ vasculature, increased presence of cleaved caspase-3+ cells, and a modest, albeit significant, decrease in proliferating cells (Figure 6C). Flow cytometric analysis of end-stage tumors revealed no significant changes in the major leukocyte populations between experimental groups (Figure S4A). Given this, we asked whether inhibition of C5aR1 instead induced a qualitative difference in signaling programs operative during tumor growth. To address this, we evaluated gene expression of end-stage tumors from the various experimental groups using NanoString Myeloid Innate Immunity Panel and Ingenuity Pathway Analysis (IPA) tools. We observed changes in mRNAs associated with dendritic cell (DC) maturation, NFқB and TREM1 signaling across all treatment groups, as compared to untreated control tumors (Figure 6D). Moreover, we observed increased expression of mRNAs associated with T cell activation in SCCs from PTX and PMX-53/PTX-treated mice, as well as increased expression of genes associated with macrophage nitric oxide (NO) and reactive oxygen species (ROS) production in the PMX-53 treated group (Figure 6D).
Since C5aR1 is highly expressed by macrophages, and ROS and NO production are generally associated with TH1-type microenvironments, we asked whether macrophage polarization was altered in animals treated with PMX-53. We isolated macrophages from orthotopic SCC by FACS and evaluated gene expression using NanoString PanCancer Immune Profiling Panel and IPA analysis to assess changes between PMX-53/PTX-treated as compared to either PTX or PMX-53 monotherapy. Upstream analysis revealed that macrophages from SCCs of PMX-53/PTX-treated mice expressed gene signatures associated with LPS, IL-1β, tumor necrosis factor (TNF), oncostatin M, and interferon (IFN)γ responses (Figure 6E). Network analysis revealed that SCC-derived macrophages from PMX- 53/PTX versus PMX-53 groups expressed higher levels of several mRNAs associated with TH1-type responses including S100a8, Tbk1, Tank, Cd274 (programmed death-ligand 1 [PD-L1]), as well as Cxcl9 and Cxcl11, IFNγ-responsive chemokines notable for their ability to recruit CXCR3+ CD8+ T cells (Figure S4B). Increased levels of Cxcl9 and Cxcl11 were confirmed by qPCR (Figure S5A).
To assess the functional significance of these changes in regulating productive T cell responses, we depleted either CD8+ or CD4+ T cells from PTX and PMX-53/PTX-treated mice bearing orthotopic SCCs and found that CD8+ T cells (Figure 6F), but not CD4+ T cells (Figure S5B) were required for efficacy of PMX-53/PTX therapy. Notably, CD31+ vascular density was restored to characteristic levels in CD8+ T cell-depleted (Figure S5C), but not in CD4+ T cell-depleted (Figure S5D) SCCs.
C5aR-Regulated Macrophage Programming Impacts CD8+ T Cell Recruitment and Effector Function
Because of the observed increase in CXCR3 ligands secreted by repolarized macrophages in SCCs of PMX-53/PTX treated mice (Figure S4B, S5A), we assessed infiltration of CXCR3+ CD8+ T cells in SCCs and observed a significant increase in PMX-53/PTX-treated mice as compared to other treatment groups (Figure 7A), while CCR5+ CD8+ T cells were unchanged (Figure S6A). Notably, CXCR3+CD8+ T cells were granzyme B+, indicative of their cytolytic capacity (Figure 7B). These data led us to ask whether: 1) CXCR3 was necessary for therapeutic efficacy of PMX-53/PTX; 2) if macrophages were responsible for CXCR3+CD8+ T cell recruitment into PMX-53/PTX treated SCCs; and 3) if IFNg was similarly required for therapeutic efficacy. While in vivo blockade of CXCR3 did not block overall CD8+ T cell presence in SCCs (Figure S6B), it abated CXCR3+ CD8+ T cell presence (Figure S6C), reversed efficacy of PMX-53/PTX therapy (Figure 7C), and restored characteristic SCC vascular density (Figure S6D). Reducing macrophage presence in SCCs via treatment of mice with a neutralizing mAb to CSF1 (Figure S6E) similarly reversed PMX-53/PTX efficacy (Figure 7D), coincident with reduced CXCR3+ CD8+ T cell presence (Figure 7E), and partially restored vascular density (Figure S6F). Similarly, blockade of IFNγ reversed therapeutic efficacy of PMX-53/PTX (Figure 7F).
Figure 7. C5aR1 Inhibition of SCC Growth is Dependent on Macrophage Recruitment of CXCR3+CD8+ T cells.
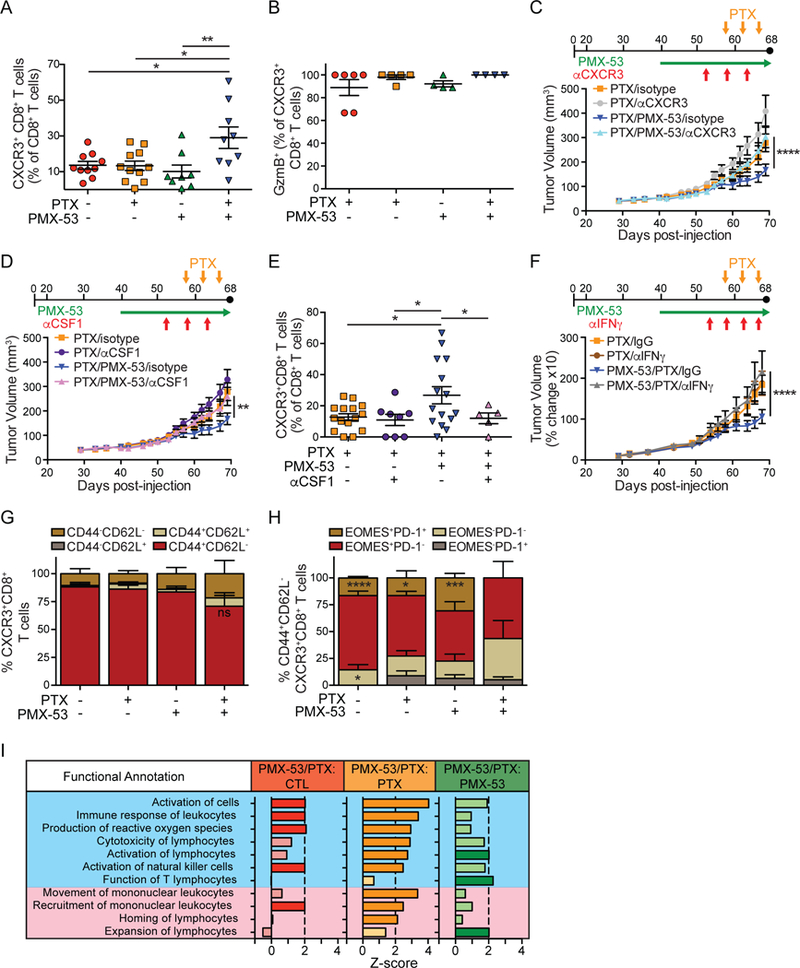
(A) Flow cytometric analysis assessing CXCR3+ CD8+ T cells in end-stage SCCs from mice in treatment groups shown in Figure 6B. (B) Granzyme B (GzmB) expression in CXCR3+CD8+ T cells in end-stage SCCs from indicated treatment groups from mice shown Figure 6B, assessed by flow cytometry. (C) Dosing strategy (top) and PDSC5 growth kinetics (lower graph) in mice treated with PTX or PMX- 53/PTX, and either isotype control (IgG2b) or αCXCR3 mAb. Shown are mice pooled from two independent experiments (n=9–12 mice/group). (D) Dosing strategy (top) and PDSC5 growth kinetics (lower graph) in mice treated with PTX or PMX- 53/PTX, and either isotype control (IgG2b) or αCSFI mAb. Shown are mice pooled from two independent experiments (n=9–15 mice/group). (E) Infiltration of CXCR3+ CD8+ T cells into end-stage SCCs in mice from Figure 7D and control groups from Figure 6B. (F) Dosing strategy (top) and PDSC5 growth kinetics (lower graph) in mice treated with PTX or PMX- 53/PTX, and either isotype control (IgG1) or αIFNγ mAb. Shown are percent changes in SCCs in mice pooled from two independent experiments (n=11–17 mice/group). (G) CD44 and CD62L expression by flow cytometry on CXCR3+ CD8+ T cells in end-stage SCCs from mice in treatment groups shown in Figure 6B. (H) EOMES and PD-1 by flow cytometry on CD44+CD62L-CXCR3+ CD8+ T cells infiltrating end-stage SCCs from mice in treatment groups shown in Figure 6B. (I) Downstream effector pathway analysis comparing gene expression in FACS-isolated CD8+ T cells from indicated treatment groups (Figure 6B) using pan-cancer immune panel (NanoString) and IPA. Significant differences (Z-score> |2|) identify how indicated functions change based on differences in gene expression in the dataset. Functions listed in blue are indicative of activation, while functions in pink indicate movement or expansion. N = 3–5 mice/group. Data are represented as means ± SEM. * p < 0.05; ** p < 0.01; *** p < 0.001; **** p < 0.0001, with significance determined by one-way (A-B, E) or two-way (C-D,F) with Bonferroni post-test for multiple comparisons, or unpaired Student’s t test with Welch’s correction (G-H). In (A-B, E), each data point reflects an individual mouse. See also Figure S6-S7.
Because PMX-53/PTX efficacy was dependent on CXCR3+ CD8+ T cells, we assessed the phenotype of CXCR3+CD8+ T cells and found the majority of these in all treatment groups to be CD44+CD62L- (Figure 7G and S6G), indicative of an effector or effector memory subtype. We then assessed eomesodermin (EOMES) and programmed death-1 (PD-1) on CD44+CD62L-CXCR3+CD8+ T cells and found that the largest subgroup across all treatment groups was EOMES+PD-1-, that were also CD69-CD107a+Ki67+/−KLRG1+/− (Figure S7A), features characteristic of effector CD8+ T cells (Zehn and Wherry, 2015). We also noted a significantly decreased presence of EOMES+PD-1+ cells in SCCs of PMX-53/PTX treated mice (Figure 7H) that were CD69-CD107a-Ki67-KLRG1- (Figure S7B), indicative of an exhausted effector phenotype that were notably absent in PMX-53/PTX-treated SCCs (Figure 7H). In the PMX-53/PTX treated SCCs, there was a modest increase in the proportion of EOMES-PD-1- CD8+ T cells (Figure 7H) that were CD69-CD107a+Ki67-KLRG1+ (Figure S7C), consistent with an effector memory phenotype. Analysis of FACS-isolated CD8+ T cells via NanoString PanCancer Immune Profiling Panel and IPA downstream analysis revealed that CD8+ T cells in the PMX-53/PTX group expressed a transcriptional profile indicative of an activated and migratory phenotype, as compared to other groups (Figure 7I). Together, these data indicated that CXCR3+CD8+ T cells regulate response to chemotherapy by infiltrating SCCs in response to macrophage reprogramming associated with IFNγ. In support of this mechanism in human HNSCC, we observed a significant correlation between CXCR3 with CD8A, CXCL9, CXCL11, CD69, PRF1, GZMA, and GZMB expression (Figure S7D).
PMX-53/PTX Expands Intratumoral High Frequency T Cell Clones
To determine if expanded CD8+ T cell phenotypes reflected antigen-dependent expansion, we performed deep sequencing of the complementarity-determining region (CDR) 3 region of the T cell receptor (TCR)β chain in matched cardiac-perfused SCC lysates and peripheral blood mononuclear cells (PBMCs). Intratumoral diversity of TCRβ sequences and the number of unique TCRβ sequences were modestly decreased in SCCs by addition of PMX-53 to PTX (Figure 8A-B), accompanied by a modest expansion of the top 25 clones intratumorally (Figure 8C), though overall clonality and maximum clonal frequency were unchanged (Figure S8A-B), results that were mirrored in peripheral blood (Figure 8D-F and S8C-D). To understand how these modest clonal responses reflected varied clonal homeostasis (Nazarov et al., 2015), we assessed frequencies of rare (<10−5), small (10−5-10−4), medium (10−4-10−3), large (10−3-0.01), and hyperexpanded (>0.01) clones in SCCs and blood, represented as a fraction of the total population (=1.0). This revealed decreased presence of rare and medium populations, and concomitant increases in hyperexpanded populations in SCCs of PMX- 53/PTX treated mice (Figure 8G, top row), explaining decreased overall diversity (Figure 8A). Based on pairwise analysis of each population in SCCs and its clonotype overlap relative to blood, we observed decreased overlap of rare and small populations, in addition to increased overlap of hyperexpanded clones, revealing that high-frequency intratumoral clonotypes were increasingly found peripherally in PMX-53/PTX treated mice (Figure 8H). Our interpretation of these data, given that the majority of expanded CD8+ T cells in SCCs of PMX-53/PTX-treated SCCs were Ki67-, is that PMX- 53/PTX therapy resulted in peripheral priming and expansion of antigen-specific clones that in turn traffic to SCCs, leading to the observed intratumoral high-frequency clonotypes detected in peripheral populations coinciding with decreased overall diversity of TCRβ clonotypes both locally and peripherally.
Figure 8. PMX-53/PTX Increases Hyperexpanded T Cell Clonotypes Resulting in Decreased TCRβ Diversity.
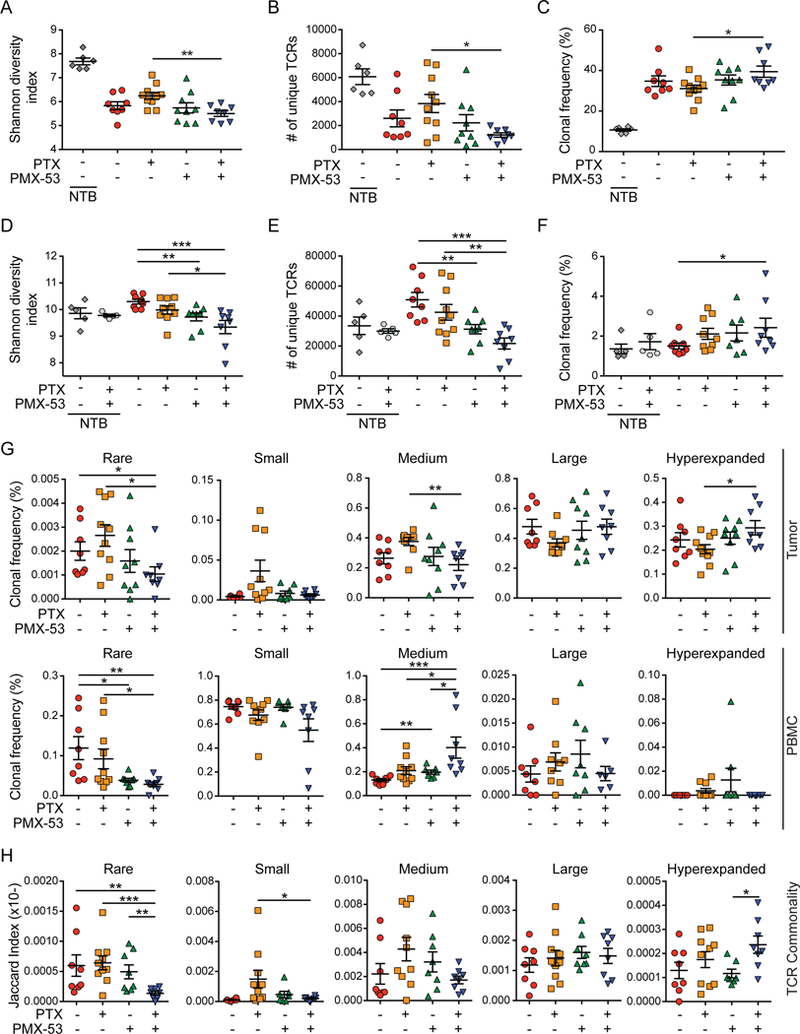
(A-C) End-stage SCCs from mice shown in Figure 6A with specified treatments (n=5–10 mice/group) were analyzed by deep sequencing of CDR3 regions of the TCRβ chain to determine the Shannon diversity index reflecting the number of unique TCRβ sequences and abundance of clonotypes (A), the total number of unique TCRb sequences (B), and the intratumoral frequency of top 25 TCRβ clonotypes (C). (D-F) Matched PBMCs from mice in (A-C) were analyzed by deep sequencing of CDR3 regions of the TCRβ chain to determine the Shannon diversity index reflecting the number of unique TCRβ sequences and abundance of clonotypes (D), the total number of unique TCRβ sequences (E), and the intratumoral frequency of top 25 TCRb clonotypes (F). (G) Alterations in clonal frequencies within the homeostatic space in SCCs (top) and PBMCs (bottom). Cumulative frequencies of rare (<10−5), small (10−5-10−4), medium (10−4-10−3), large (10−3-0.01), and hyperexpanded (>0.01) clones as a fraction of total TCRβ repertoires are shown. Data presented are the sum of all clonal frequencies for each mouse and included all TCRβ sequences with a detectable frequency count. (H) Pairwise assessment of TCR clonotype sequence commonality between SCC and PBMCs. Each point represents the Jaccard overlap index between the various frequency subsets in tumor and matched PBMC sample. Unless otherwise indicated, each data point reflects an independent mouse. Data are represented as means ± SEM. * p < 0.05; ** p < 0.01; *** p < 0.001; **** p < 0.0001 with statistical outliers removed using ROUT test (Q=1) and significance determined by Mann-Whitney test. See also Figure S8.
DISCUSSION
Studies revealed herein indicate that signaling downstream of complement C5a represents a co-dominant regulator of cancer-associated chronic inflammation fostering hallmark characteristics of squamous carcinogenesis. The C3-indpendent nature of inflammation in HPV16 mice indicates that C5a generation can occur independent of classical, lectin, and alternative pathways when regulated downstream of uPA expressed by macrophages in neoplastic tissue. C5a binding to its high-affinity receptor (C5aR1) on infiltrating myeloid subsets activate protumorigenic and immunosuppressive bioactivities critical for neoplastic progression; HPV16 mice lacking either C5aR1 or uPA exhibited reduced neoplasia-associated inflammation, keratinocyte hyperproliferation, development of angiogenic vasculature, and reduced malignant progression to de novo SCC.
In homeostatic and acutely wounded tissues, precise control of complement activation is required to prevent unrestricted inflammation, anaphylactic shock, and exacerbation of pathologies or tissue damage (Ricklin et al., 2016); thus, it is not surprising that tumors co-opt this biologic circuitry as a survival strategy (Reis et al., 2018). As such, components of complement have emerged as critical mediators of tumor progression (Afshar-Kharghan, 2017). One of the first studies to reveal protumorigenic roles for complement, Markiewski and colleagues reported C5a promoted subcutaneous TC-1 cervical carcinoma growth by enhancing recruitment of T cell-suppressive myeloid cells (Markiewski et al., 2008). Sarcomas, and mammary, ovarian, colon, and cutaneous carcinomas have also been reported to be regulated by C5a-mediated signaling, variably involving transforming growth factor (TGF)β, IL-10, and recruitment of T cell-suppressive macrophages responding to CCL2 (Bonavita et al., 2015; Reis et al., 2018). Whereas generation of C5a is C3- independent in HPV16 mice (de Visser et al., 2004) and instead uPA- and C5aR1-dependent, other tumor models report C3-dependent C5a generation, thereby underscoring the highly contextual nature of complement regulation in cancer development. Why the difference?
While it is entirely plausible that the dominant nature of HPV16 oncoproteins alters hemostasis and renders C5 susceptible to proteolysis by fibrinolytic proteases in HPV16/C3−/− mice, it is also likely that mechanisms revealed herein reflect tumor evolution based on selective pressure. The coagulation and fibrinolytic systems regulate fibrin deposition and degradation, respectively. Leaky vasculature allows fibrinogen and circulating zymogens to enter tissue parenchyma. The fibrinolytic system, including tissue plasminogen activator (tPA), uPA, and plasmin, play important roles in regulating degradation of blood clots, regulation of wound healing, and promoting inflammation, likely in part by regulating complement activation (Foley, 2017). In contrast to the endothelial restricted nature of tPA, uPA is primarily localized to interstitia, where it activates plasmin in a fibrin-independent manner. In neoplastic tissue of HPV16 mice, stromal uPA localized to macrophages and regulated C5a generation, leading to enhanced inflammation and neoplastic progression. Macrophages are critical regulators of tissue repair and wound healing (Mantovani et al., 2013), and their expression of uPA has been implicated in skeletal muscle repair, cardiac fibrosis, atherosclerosis, and wound healing (Foley, 2017). uPA+-macrophages regulate plasmin processing and deposition, thereby facilitating localized generation of C3a and C5a, release of proinflammatory mediators, and phagocytosis of pathogens or apoptotic cells (Foley, 2017). The C3-independent nature of neoplastic progression in HPV16 mice, while certainly related to prominence of uPA+ macrophages regulating localized generation of C5a, could also be due to negative regulators of the complement interactome that rapidly degrade C3 or its downstream products, or in instances where negative regulators of C3 are rendered ineffective, such as when PTX3 is methylated (Bonavita et al., 2015). Along these lines, we observed increased presence of PTX3+ cells during neoplastic progression (Figure S8E), thereby offering a plausible mechanism for the dispensable nature of C3 in this model.
Why might it be beneficial for a tumor to adapt and extrinsically activate complement C5a? During canonical complement activation, several factors upstream of C5 (C1q, C4b, and C3b and its degradation products iC3b and C3dg), function as opsonins regulating phagocytosis, antigen uptake, cross-presentation by antigen presenting cells (APCs), and aiding clearance of apoptotic cells (Schmidt et al., 2016). However, apoptotic malignant cells, in addition to releasing nucleic acids and other stress factors impacting APCs by toll-like receptor-mediated programs, can also be antigenic and would benefit by precluding opsinin generation. Human SCCs upregulate multiple negative regulators of complement that prevent C3 activation or instead increase degradation of opsonins, namely C3b and its cleavage product iC3b (Reis et al., 2018), which are also cleaved by plasmin and further reduce phagocytosis by macrophages (Foley et al., 2015). In HPV16 mice, plasmin generates C5a downstream of uPA and promotes neoplasia-associated inflammation, and likely also enables malignant keratinocytes to avoid decoration by opsonins and subsequent phagocytosis. Results of this are likely two-fold - enhanced cell survival by virtue of factors secreted by recruited leukocytes responding to C5a, as well as lack of opsonization, reduced antigen uptake, and cross-presentation by APCs. It is therefore plausible that SCCs in HPV16 mice evolve to extrinsically activate complement C5a via the fibrinolytic and/or coagulation systems to promote cancer-associated inflammation while simultaneously evading immunosurveillance.
We observed that C5aR1−/− mice exhibited decreased tumor incidence and reduced orthotopic tumor growth dependent on both macrophages and mast cells, similar to results observed in FcγR−/− mice, likely reflecting regulation of redundant protumorigenic molecules (e.g. VEGF, TNFα, IL-10) impacting angiogenesis, tissue remodeling, immunosuppression, and tumor growth. Therapeutically, treatment of orthotopic SCCs with PMX-53 significantly improved response to paclitaxel involving gene expression networks linked to TH1 transcriptional programing of macrophages associated with reduced vasculature density, increased keratinocyte cell death, and evidence of IFNγ- and CXCR3- dependent antitumor CD8+ T cell responses independent of CD4+ T cells.
As a result of macrophage-mediated T cell suppression, and likely chronic antigen exposure, CXCR3+ CD8+ T cells in SCCs manifest a dysfunctional phenotype characterized by PD-1+EOMES+ expression, reduced proliferation and cell surface expression of the lysosomal marker CD107a, indicative of degranulation. In contrast, CD8+ T cells in SCCs from PMX-53/PTX-treated mice exhibited increased proportions of PD-1-EOMES-CXCR3+ CD8+ T cells, characterized as CD69- CD107a+Ki67-KLRG1+, indicative of effector memory cells. Effector memory CD8+ T cells expressing high levels of CXCR3 are thought to be long-lived and associated with durable anti-tumor memory responses (Pages et al., 2005). CXCR3 is a chemokine receptor whose expression is increased following antigen stimulation of Th1-CD4+ T cells and effector and subsets of memory CD8+ T cells. These interactions enable T cell entry into inflamed tissues via IFNγ-inducible ligands CXCL9, CXCL10, and CXCL11, expression of which correlates with CD8+ T cell infiltration and outcomes (Mikucki et al., 2015). Herein, neoplasia-associated macrophages increased expression of CXCR3 ligands in response to IFNγ, that in turn enhanced recruitment of effector and effector memory CD8+ T cells. This shift from a dysfunctional to a CXCR3+ effector memory CD8+ T cell phenotype bolster therapeutic efficacy, as depletion of macrophages, or blockade of CXCR3 or IFNγ reversed SCC growth kinetics in mice treated with PMX-53/PTX.
Analysis of TCRβ sequences revealed that T cell clones were less diverse locally and peripherally, with high-frequency clones expanded in SCCs of PMX-53/PTX-treated mice. Because intratumoral CD8+ T cells were largely Ki67-, and because there was high concordance with peripheral TCR sequences in PMX-53/PTX treated groups as measured by the Jaccard index, we conclude that hyperexpanded T cell clones expanded in secondary lymphoid organs and subsequently were recruited to SCCs. While we anticipate these responses are likely antigen- specific, we cannot rule out that a portion of therapeutic efficacy may be due to bystander T cell activation. Impacts of TCRβ repertoire changes in PMX-53/PTX treated mice are relevant given that patients with less diverse and more clonal TCR repertoires have improved therapeutic responses to αPD-1 therapy (Tumeh et al., 2014).
Taken together, results presented herein provide evidence that complement C5a and signaling pathways downstream of myeloid C5aR1 are early regulators of squamous carcinogenesis by promoting cancer-associated inflammation. Our preclinical data demonstrate that therapeutic inhibition of C5aR1, in combination with cytotoxic chemotherapy, results in transcriptional reprogramming of macrophages, that not only impacts angiogenic programs, but also leads to recruitment of CXCR3+ cytotoxic CD8+ T cells by IFNγ-dependent mechanisms. Given that human SCCs are highly infiltrated with C5aR1+ cells, and that increased survival is observed in patients bearing C5AR1loCD8Ahi tumors, we assert that these malignancies may benefit from therapies targeting C5aR1 in conjunction with chemotherapy, with or without additional immunomodulating therapies.
STAR METHODS
Detailed methods are provided in the online version of this paper and include the following:
Key Resources Table
Contact for Reagent and Resource Sharing
Further information and requests for resources and reagents should be directed to and will be fulfilled by the Lead Contact, Lisa M. Coussens (coussenl@ohsu.edu)
Experimental Model and Subject Details:
Human Studies
De-identified human buccal, cSCC, and HNSCC tissues were acquired from the Department of Dermatology Molecular Profiling Resource (IRB protocols #809 and #10071) with patient consent obtained at time of tissue acquisition. De-identified vulva SCCs were obtained from the OHSU BioLibrary (IRB Protocol #4918) with patient consent obtained at time of tissue acquisition. Use of samples herein occurred under exempt category 4 for individual receiving de-identified biological specimens. Skin and buccal mucosa were resected from non-tumor-bearing patients, while vulva tissue was adjacent normal. Accrual reflects samples resected from individual patients: 10 normal skin, 50 cSCC, 32 adjacent normal vulva, 41 vSCC, 16 normal buccal mucosa, and 49 HNSCC.
Animal Studies
All animal experiments were performed in compliance with the National Institutes of Health guidelines and were approved by the University of California, San Francisco and Oregon Health & Science University Institutional Animal Care and Use Committees. Parameters of neoplastic progression in the K14-HPV16 transgenic mouse model of squamous cell carcinogenesis have been previously described (Coussens et al., 1996; Coussens et al., 1999; Coussens et al., 2000; de Visser et al., 2004, 2005; Eichten et al., 2007; Junankar et al., 2006; van Kempen et al., 2002). Briefly, K14-HPV16 transgenic mice represent a well-characterized model of multi-stage epithelial carcinogenesis where human papillomavirus type 16 (HPV16) early region genes are expressed under control of a human keratin 14 (K14) promoter/enhancer, i.e., K14-HPV16 mice (Arbeit et al., 1994; Coussens et al., 1996; Coussens et al., 1999; Coussens et al., 2000; Daniel et al., 2003; de Visser et al., 2004, 2005; Rhee et al., 2004; van Kempen et al., 2002). Mice are born phenotypically normal; by 1 month of age, 100% of mice present with epidermal hyperplasia that progresses to mild dysplasia by 4 months of age. Around 6 months of age, mice develop high grade dysplasia that undergoes malignant conversion to invasive SCC in 50% of mice between 6 and 12 months of age on the FVB/n strain background (Coussens et al., 1996). Malignant tumors are predominantly SCCs that metastasize to LNs in 30% of the mice that develop SCCs (van Kempen et al., 2002). To generate HPV16/C5aR1−/− and HPV16/uPA−/− mice, C5aR1+/− (Hopken et al., 1996) (purchased from The Jackson Laboratory, stock no. 006845) and uPA+/− mice (Carmeliet et al., 1994) (generous gifts from Drs. Leif Lund and Keld Dano) were backcrossed from the 129S4(B6) and 129S2/SvPas strains, respectively, into the FVB/n strain to N > 20 and n > 18, respectively, and then intercrossed with K14-HPV16 mice. HPV16/C3−/− mice have been previously reported (de Visser et al., 2004). To confirm genotypes, the following parameters were used: HPV16 mice; Primer JA7: AGA ACT GCA ATG TTT CAG GAC CCA CAG; Primer JA4: TCT GCA ACA AGA CAT ACA TCG ACC GG; 95°C 5 min; 95°C 1 min; 60°C 30 sec; 72°C 2 min; repeat steps 2–4 30 cycles; 72°C 10 min; 4°C forever; Tg band 431 base pair (bp), WT no band; C5aR1−/− mice; Primer oIMR7178: GGT CTC TCC CCA GCA TCA TA; Primer oIMR7179: GGC AAC GTA GCC AAG AAA AA; Primer oIMR7415: GCC AGA GGC CAC TTG TGT AG; 94°C 3 min; 94°C 30 sec; 63°C 1 min; 72°C 1 min; repeat steps 2–4 35 cycles; 72°C 2 min; 4°C forever; Mutant band at 244 bp, WT band at 386 bp; uPA−/− mice; Primer oIMR0432: TCT GGA GGA CCG CTT ATC TG; Primer oIMR0433: CTC TTC TCC AAT GTG GGA TTG; Primer oIMR2060: CAC GAG ACT AGT GAG ACG TG; 94°C 3 min; 94°C 30 sec; 52°C 1 min; 72°C 1 min; repeat steps 2–4 35 cycles; 72°C 2 min; 4°C forever; Mutant band 337 bp, WT band 153 bp.
PDSC5 or WDSC cells were derived from SCC tumors that developed de novo on K14-HPV16 mice as previously described (Affara et al., 2014; Arbeit et al., 1996). 0.5 × 10⁶ PDSC5 or WDSC cells were suspended 1:1 in PBS and Growth Factor-Reduced Matrigel (Corning), and 50 μL intradermally injected into the flanks of 6–10 week-old male FVB/n mice. SCCs were measured 3x per week using a digital caliper and tumor volume calculated using the equation V (mm3) = A x B2/2, where A reflected the largest diameter, and B the smallest diameter. PMX-53 (Finch et al., 1999) was synthesized by GenScript, resuspended in water, and administered at 1.0 mg/kg/day via subcutaneous implantation via Alzet pump (model 2004, 28-day pump) on day 40 when SCCs reached ~50 mm3. Paclitaxel (Novaplus) was injected intravenously at 12 mg/kg every 4 days for a total of 3 injections per cycle. In instances where 2 cycles of chemotherapy were given, there was a 7-day break between cycles. Mice were sacrificed 2 days after the last dose of chemotherapy. For studies using aCD4 (GK1.5, 500 μg), αCD8 (YTS169.4, 500 μg), aCSF1 (5a1, 1.0 mg for first dose, 500 μg for subsequent doses), αCXCR3 (CXCR3–173, 500 μg), and αlFNγ (XMG1.2, 250 μg), antibodies were given 5 days prior to first treatment with paclitaxel, and every 5 days thereafter until study end.
Method Details
Bone Marrow-Derived Mast Cells and Macrophages
Bone marrow was isolated from femurs and tibias from mice of indicated genotypes using a 23- gauge needle. Cells were then cultured in RPMI 1640 supplemented with 10% FBS, 2.0 mM L- glutamine, 100 U/ml penicillin, 100 μg/ml streptomycin, non-essential amino acids, 14.2 mM (β- mercaptoethanol, to which was added either murine recombinant IL-3 for BMMC (30 ng/ml; PeproTech) or murine recombinant CSF-1 for BMMO (20 ng/ml; PeproTech). Differentiating mast cells were cultured once per week by transferring non-adherent cells and replenishing half of the medium with a fresh one in the presence of IL-3 (10 ng/ml). To verify differentiation of BMMC, flow cytometric analysis was performed after 4 weeks in culture to assess expression of mast cell markers CD117/c-kit and FceR-1 (eBiosciences). BMMC differentiation was further assessed with toluidine blue for metachromatic staining. The resulting populations were used between weeks 4 and 12. Differentiating macrophages were cultured by transferring non-adherent cells 24 hr after bone-marrow cells isolation and replenishing the medium with a fresh one every 48 hr. BMMΦ differentiation was confirmed by flow cytometric evaluation of F4/80 and CD45 expression and used within 10 days of culture. Purity was typically >95%. All cell cultures were maintained at 37°C in a humidified atmosphere with 5% CO2.
Immunohistochemistry
Tissue samples from PBS-cardiac perfused mice were immersion-fixed in 10% neutral-buffered formalin followed by dehydration through graded series of alcohols and xylene and embedded in paraffin using standard laboratory procedures. Tissue sections were deparaffinized using xylene and rehydrated through a graded series of alcohol. To identify proliferating cells in tissue sections, mice received intraperitoneal injections of bromodeoxyuridine (BrdU; Roche Diagnostics) dissolved in PBS (50 mg/kg of mouse body weight) 90 min prior to sacrifice. Tissue sections were subjected to antigen retrieval by steam heating in Citra™ antigen retrieval solution (BioGenex) or proteinase K (Dako). Sections were then incubated with blocking buffer containing 5.0% goat serum (Thermo Fisher) and 2.5% bovine serum albumin (BSA), followed by primary antibody incubation, e.g., rat anti-BrdU (MCA2060; Serotec; 1:1000), rat anti-mouse PECAM1/CD31 (MEC 13.3; BioLegend; 1:100), rat anti- Ly6G (1A8; eBiosciences; 1:2000), rat anti-mouse cleaved capsase 3 (#9661; Cell Signaling; 1:200), CD45 (30-F11; BD Pharmingen; 1:500), F4/80 (Cl:A3–1; Serotech; 1:500), C5aR1 (10/92; Abcam; 1:500), or Granzyme B (#NB100–684; Novus Biologicals; 1:200). Tissue sections were then incubated with the corresponding biotinylated secondary antibodies (1:500, Vector Laboratories), washed, and incubated with horseradish peroxidase-conjugated avidin complex (ABC Elite, Vector Laboratories) for 30 min, followed by incubation with Fast 3,3 diaminobenzidine (DAB, Vector Laboratories). Tissue sections were counterstained with methyl green, dehydrated, and mounted with Cytoseal 60 (Thermo Fisher). To visualize mast cells, sections were deparaffinized using xylenes and rehydrated through a graded series of alcohol. Sections were stained for 2.5 min in toluidine blue working solution (10% stock toluidine blue O (stock: 1% toluidine blue O in 70% ethanol) in 1.0 % NaCl, pH 2.25). Sections were then washed in water, dehydrated quickly in graded ethanol into xylenes and mounted with Cytoseal 60. Quantification of slides was performed either manually or automated using Aperio Imagescope. For manual quantification, 5 high-powered fields per mouse were counted and averaged. For automated quantification, the entire region of interest was selected, counted, and normalized by total area of analysis.
Immunofluorescence
Ears from cardiac-perfused HPV16 mice were embedded in OCT. 8.0 μm sections were air dried for 10 min and fixed for 10 min with ice-cold methanol. Sections were washed in PBS and blocked with goat blocking buffer for 1 hour. Primary antibodies including rat anti-mouse PECAM1/CD31 (MEC 13.3; BioLegend; 1:50), CD45 (30-F11; BD Pharmingen; 1:100), F4/80, C5aR1 (M19; Santa Cruz; 1:100), C5a (L-14; Santa Cruz; 1:50), CD3 (17A2; BD Pharmingen; 1:100), PDGFRa (APA5; eBioscience; 1:100), CD117 (ACK45; BD Pharmingen; 1:50), CD11c (NB110–97871; BD Pharmingen; 1:100) were diluted in 0.5x blocking buffer and incubated overnight at 4oC. Slides were washed and incubated with appropriate fluorescent secondary antibodies diluted in 0.5x blocking buffer. Slides were washed and incubated for 10 min with Hoechst 33342 (1:10000). Slides were washed and mounted with ProLong Gold anti-fade mounting medium (Life Technologies). Images were taken with an LSM710 Confocal Laser Scanning Microscope (Zeiss).
Real-time PCR
Total mRNA was prepared from sorted cells or freshly pulverized whole tumor using RNeasy Micro/Mini kit guidelines (Qiagen). Contaminating DNA was removed with DNAse I (Invitrogen), followed by RNA quantitation using a NanoDrop ND-1000 (Thermo Fisher Scientific), superscript III (Invitrogen) was used to reverse transcribe purified RNA into cDNA according to manufacturer’s directions. Real-time PCR for gene expression was performed using the TaqMan system (Applied Biosystems) with a preamplification step employed during analysis of FACS-sorted populations. The comparative threshold cycle method was used to calculate fold change in gene expression, which was normalized to tbp or gapdh as reference genes.
Flow Cytometry and FACS
Single-cell suspensions were prepared from ear skin, tumor tissues, lymph nodes, spleens, or blood from cardias-perfused mice: Tissue was manually minced using scissors, followed by a 30 min enzymatic digestion with 2.0 mg/ml collagenase A (Roche), 1.0 mg/ml Hyaluronidase (Worthington), and 50 U/ml DNase I (Roche) in serum-free Dulbecco’s modified eagles medium (DMEM) (Invitrogen) at 37°C using continuous stirring conditions. Single cell suspensions from ear or tumor digests, lymph nodes, or spleens were prepared by passing tissue through 70-μm nylon strainers (BD Biosciences). Blood samples were acquired through cardiac puncture with a heparinized 25-gauge needle, followed by erythrocyte lysis with BD PharmLyse (BD Biosciences).
To prevent non-specific binding, cells were incubated for 30 min at 4°C with rat anti-mouse CD16/CD32 mAb (1:250, BD Bioscience) in PBS also containing Live/Dead Aqua stain (1:500; Invitrogen) to delineate between viable and dead cells. Subsequently, cells were incubated in PBS containing 1.0 % BSA (Sigma; PBS/BSA) and 2.0 mM EDTA for 30 min with 100 μl of fluorophore- conjugated anti-mouse antibodies; CD45 (30-F11; 1:2000), CD3e (145–2C11; 1:200), CD69 (H1.2F3; 1:200), CD4 (L3T4; 1:400), FoxP3 (FJK-16s; 1:200), CD44 (IM7; 1:400), CD62L (MEL-14; 1:200), CD8e (53–6.7; 1:400), γδTCR (GL3; 1:200), NK1.1 (PK136; 1:200), CD49b (DX5; 1:200), CD19 (6D5; 1:200), CD11b (M1/70; 1:400), CD11c (N418; 1:400), MHCII (M5/114.15.2; 1:1000), Ly6C (HK1.4; 1:400), Ly6G (1A8; 1:400), F4/80 (BM8; 1:400), CXCR3 (CXCR3–173; 1:200), C5aR1 (20/70; 1:100), Ki67 (SolA15; 1:200), GzmB (NG2B; 1:100), EOMES (Dan11mag; 1:200), KLRG1 (2F1; 1:200), PD-1 (J43; 1:400), FcεRI (MAR-1; 1:200), cKit (2B8; 1:800), CD107a (1D4B; 1:200) (eBioscience or Biolegend). Cells were then washed once in PBS/BSA/EDTA, followed by fixation with BD Cytofix for 30 min on ice. After a final wash, cells were stored at 4oC until data acquisition on a BDFortessa using FACSDiva software (BD Biosciences). Analysis was performed using FlowJo software program (Tree Star Inc).
For fluorescence-activated cell sorting (FACS), cells were prepared as described above without fixation, and sorting was performed on a FACSAria using CellQuestPro software (BD Biosciences). Sorted CD11b+Ly6C-Ly6G-F4/80+MHCII+ macrophages or CD3+CD8+CD4- T cells were flash frozen as a cell pellet for subsequent gene expression analyses.
Complement Deposition Assay
BMMΦ were isolated as described above, polarized with 20.0 ng/mL IL-4 for 24 h, and co-cultured 1:1 with PDSC5 or WDSC cells on chamber slides. C5a deposition on tumor cell lines was performed by incubating cells with 10% HPV16 mouse serum in gelatin-containing veronal buffer containing 0.15 mM Ca2+ and 0.5 mM Mg2+ (Sigma-Aldrich). After 12h, cells were washed, fixed with methanol, and processed for immunofluorescence as described above. Quantitation of IF staining for C5a deposition Quantitation of IF staining for C5a deposition determined by ImageJ from two independent regions of interest (ROIs) per tissue culture well, for each experimental condition indicated.
ELISA
Tumors or ears from HPV16 mice were homogenized in lysis buffer (50 mM Tris-HCl pH 8.0, 150 mM NaCl, 1.0% NP-40, 0.5% sodium deoxycholate, 0.1% SDS) containing complete EDTA-free protease inhibitors (Roche) and 1.0 mM PMSF. Homogenates were centrifuged at 12000 rpm at 4oC and were stored at −20oC for analysis. Indicated proteins were measured in tissue homogenates by DuoSet ELISA (R&D) according to the manufacturer’s instructions.
LC-MS/MS
Murine macrophages were prepared using bone marrow derived progenitors. To obtain bone marrow derived progenitor cells, tibia and femur of C57/BL6 animals were cut open and were flushed by DMEM high glucose cell culture medium using 22G syringe. Red blood cells were lysed using pharmalyse (BD biosciences) and cultured in DMEM medium containing 5% FCS, 100 U/ml penicillin, and 100 μg/ml streptomycin. M0 macrophages were obtained by treating cultured cells with 10 ng/mL CSF-1 for 5 days. Macrophages were then polarized to classically activated (M1) using 100 ng/mL LPS (Sigma) and 5.0 ng/mL IFNγ(Peprotech) or alternatively activated (M2) using 10 ng/mL IL-4 (Peprotech).
We used stable isotope labeling of amino acids in culture (SILAC) for quantitative proteomics and coupled this with click chemistry to quantitatively analyze nascent protein synthesis upon macrophage activation. To capture newly synthesized proteins, cells were metabolically labeled with 100 μM azidohomoalanine (Anaspec), an unnatural methionine analog, coupled with an alkyne resin using click-chemistry for purification of AHA labeled proteins. Macrophages were incubated with AHA for 16 hrs following activation. For SILAC, Arg (L-Arg 13C6 or L-Arg 13C6 15N4, Sigma) and Lysine isotopes (L-Lys 13C6 or L-Lys 13C6 15N4, Sigma) were used for modifying peptide mass. Basal state (M0) macrophages or activated macrophages were either labeled with 13C6 forms of amino acids or 13C6 15N4 forms, and proteomic analysis performed via reverse labeling to negate any bias due to isotopic form of amino acids. Equal amounts of lysates from M1 or M2 activated macrophages were mixed with lysates of M0 macrophages. Newly synthesized proteins containing AHA were coupled with alkyne resin for enrichment and purification using click-it protein enrichment kit (Thermo Fisher) following manufacturer’s instructions. Enriched proteins were digested on alkyne resin column using 0.1 μg/ml trypsin for 16 hr at 37°C. Peptides were desalted and subjected to HPLC chromatographic separation into 18 fractions, and subjected to LC-MS/MS analysis using Orbitrap mass spectrometer (Agilent Biosciences). Quantitative analysis was performed using MaxQuant software.
Nanostring profiling of gene expression
For myeloid panels, 10–20 mg of snap frozen tumors were crushed on liquid nitrogen and RNA was extracted using the RNeasy Micro Kit (QIAGEN) according to the manufacturer’s instructions. For the pan-cancer immune panel, macrophages and CD8+ T cells were isolated by FACS as described above and total RNA was isolated using the RNeasy Micro Kit (QIAGEN). cDNA was synthesized using superscript VILO according to the manufacturer’s instructions (Thermo Fisher), before multiplexed target enrichment for an appropriate number of cycles (18 cycles for macrophages, 24 cycles for CD8+ T cells), according to the manufacturer’s instructions (NanoString). Samples were then hybridized with NanoString myeloid or pan-cancer immune profiling probes for 16 hr and were subsequently loaded into an nCounter SPRINT cartridge. Raw data were normalized utilizing 5–7 housekeeping genes. Fold changes in gene expression were exported to Ingenuity Pathway Analysis for further analysis.
TCRβ deep sequencing of tumor and blood
By combining methods described by Robins et al (Robins et al., 2009) and Faham et al (Faham et al., 2012), we performed 2-stage PCR on genomic DNA for TCRβ deep-sequencing library preparation. 1st stage involved multiplexing with 20 Vβ forward and 13 Jβ reverse primers using Qiagen multiplex PCR kit. To minimize amplification bias due to multiplexing with 20 Vβ forward and 13 Jβ reverse primers, we designed 260 (20V*13J) synthetic TCR templates (STs) with specific barcodes that were added in known concentration to the 1st stage PCR (Carlson et al., 2013). ST counts were used to computationally remove amplification bias post sequencing and relative abundance of each clonotype present in the original sample to be estimated (Carlson et al., 2013). Multiplex primers were designed with 5’ overhangs serving as primer binding sites in the 2nd stage PCR. Using 2.0 % of purified PCR product from stage 1 as template, we performed a 2nd stage PCR with universal and indexed Illumina adaptors. The indexed adaptors contained an 8-base index sequence that allowed barcoding of each sample.
Equal volume of all samples was pooled. Each pool, which typically contained approximately 90 samples, was profiled on a 2200 TapeStation (Agilent) and concentration determined by real time PCR using a StepOne Real Time Workstation (ABI/Thermo) with a commercial library quantification kit (Kapa Biosystems). Paired-end sequencing was performed with a 2 × 150 protocol using a Midoutput 300 sequencing kit on a NextSeq 500 (Illumina). Target clustering was about 160 million clusters per run. Illumina sequencing was performed by the OHSU Massively Parallel Sequencing Shared Resource. Following the run, base call files were converted to fastq format and demultiplexed by a separate barcode read using the most current version of Bcl2Fastq software (Illumina). Fastq files obtained as raw data for each sample was stored, processed and analyzed in a cloud-based supercomputing system maintained by the Advanced Computing Center at OHSU.
We assessed raw data for initial read quality using the FASTQC public tool. Quality paired-end sequences were combined using the PEAR merging algorithm (Zhang et al., 2014). Sequences spiked-in as internal controls were identified and removed from the Fastq files for downstream normalization of TCR clonotypes. We used the open-source TCR sequence analysis tool MiXCR (Bolotin et al., 2015) for the extraction of CDR3 sequences.
MiXCR removed out-of-frame TCR sequences and identified unique V-CDR3 (nucleotide sequence)-J seed sequence and clustered identical sequences (allowing one base mismatch) computing the frequency (in %) of each unique TCR clonotype. Normalized clonotype frequency counts were exported and a number of TCR repertoire metrics, including diversity and clonality were calculated.
Diversity was represented by Shannon diversity index or Shannon entropy (H) reflecting a quantitative measure of how many unique TCR clonotypes were present per sample, and simultaneously taking into account how evenly they were distributed (p). The value of a diversity index increases both when the number of unique TCR sequences increases and when evenness increases. For a given number of uniques, the value of a diversity index is maximized when all types are equally abundant, and calculated using the default entropy function from the entropy R package using the formula:
where p is the number of unique clonotypes in a sample, θ the frequency of a given clonotype, and k a particular clonotype.
Clonality or Clonal index (C) reflects the inverse of the normalized Shannon’s entropy H, a statistic for how much of the repertoire is made up of expanded clones.
where H is the Shannon entropy, and p is the number of unique clonotypes per sample.
Clonal homeostasis was analyzed using tcR package (Nazarov et al., 2015), measuring alterations in intratumoral and peripheral TCR clonotype frequencies within the homeostatic space in wild-type and treatment groups. The percentage of sequences was calculated and categorized as rare (0 – 10−5), small (10−5 – 10−4), medium (10−4 – 10−3), large (10−3 – 10−2), and hyperexpanded (10−2 - 1) in different treatment groups.
We used the Jaccard Index (J(B,T)) to determine TCR clonotype sequence similarity between paired blood and tumor samples (Chen et al., 2017). Here, clonotype was defined as V segment identity (e.g. V1), nucleic acid sequence of CDR3 region, and J segment identity (e.g. J1–1). For each pair of samples, the Jaccard Index was the number of clonotypes shared between blood and tumor divided by the total number of clonotypes in blood and tumor:
where B and T represent all clonal sequences in blood and tumor, respectively.
Quantification and Statistical Analysis
Statistical analyses were performed using Prism 6 for Mac. Specific tests included Mann-Whitney (unpaired, nonparametric two-tailed), unpaired t test, one- and two-way ANOVA, and Wilcoxon rank- sum. In instances where multiple comparisons were performed, Bonferroni correction was used, unless otherwise specified. Specific tests are identified in the respective figures, p values < 0.05 were considered statistically significant, with * p < 0.05, ** p < 0.01, *** p < 0.001, **** p < 0.0001, unless otherwise indicated in the figure.
Data and Software Availability
TCRβ sequencing data have been deposited in the GEO under accession GSE112323. https://www.ncbi.nlm.nih.gov/geo/query/acc.cgi?acc=GSE112323
Supplementary Material
HIGHLIGHTS.
C5aR1 signaling in macrophages and mast cells fosters neoplastic progression to SCC
uPA+ macrophages mediate C5a generation and regulate cancer-associated inflammation
C5aR1+ leukocytes infiltrate human SCCs and correlate with clinical outcome
C5aR inhibition improves response to chemotherapy dependent on CXCR3+ CD8+ T cells
ACKNOWLEDGEMENTS
The authors thank the Knight Cancer Institute (P30 CA069533) Flow Cytometry, Advanced Light Microscopy, Bioinformatics, and OHSU Massively Parallel Sequencing shared resources. Human tissue specimens provided by the OHSU Dept. of Dermatology Molecular Profiling Tissue Resource Repository (IRB#10071). We are grateful to members of the Coussens Lab for critical discussions, to Ole Behrendtsen, Lia Kim, Miriam Marx, Shiv Shah, and Meghan Lavoie for technical assistance, to Justin Tibbitts and Teresa Beechwood for research regulatory oversight and animal husbandry, and to Drs. Leif Lund and Keld Dano for providing uPA−/− mice. The authors acknowledge support from the American Cancer Society - Friends of Robert Kinas Postdoctoral Fellowship (PF-14–221-01-MPC), NIH/NCI Postdoctoral Training Grant (CA106195), the Cathy and Jim Rudd Career Development Award for Cancer Research, the Medical Research Foundation, and Drs. Gough and Crittenden for salary support during manuscript revision to TRM; NIH/NCI (CA192405) to MKM; NIH/NCI (CA057621) to ZW; and the NIH/NCI (CA130980, CA155331, CA163123), a DOD BCRP Era of Hope Scholar Expansion Award (W81XWH-08-PRMRP-IIRA), the Susan G. Komen Foundation (KG110560), the Breast Cancer Research Foundation, the Brenden-Colson Center for Pancreatic Health, and a Stand Up To Cancer - Lustgarten Foundation Pancreatic Cancer Convergence Dream Team Translational Research Grant (SU2C-AACR-DT14–14) to LMC.
Footnotes
Publisher's Disclaimer: This is a PDF file of an unedited manuscript that has been accepted for publication. As a service to our customers we are providing this early version of the manuscript. The manuscript will undergo copyediting, typesetting, and review of the resulting proof before it is published in its final citable form. Please note that during the production process errors may be discovered which could affect the content, and all legal disclaimers that apply to the journal pertain.
CONFLICT OF INTEREST
The authors declare no financial conflicts of interests. LMC declares that she is a paid consultant for Cell Signaling Technologies
REFERENCES
- Affara NI, Ruffell B, Medler TR, Gunderson AJ, Johansson M, Bornstein S, Bergsland E, Steinhoff M, Li Y, Gong Q, et al. (2014). B cells regulate macrophage phenotype and response to chemotherapy in squamous carcinomas. Cancer Cell 25, 809–821. [DOI] [PMC free article] [PubMed] [Google Scholar]
- Afshar-Kharghan V (2017). The role of the complement system in cancer. J Clin Invest 127, 780–789. [DOI] [PMC free article] [PubMed] [Google Scholar]
- Amara U, Rittirsch D, Flierl M, Bruckner U, Klos A, Gebhard F, Lambris JD, and HuberLang M (2008). Interaction between the coagulation and complement system. Adv Exp Med Biol 632, 71–79. [DOI] [PMC free article] [PubMed] [Google Scholar]
- Andreu P, Johansson M, Affara NI, Pucci F, Tan T, Junankar S, Korets L, Lam J, Tawfik D, DeNardo DG, et al. (2010). FcRgamma activation regulates inflammation-associated squamous carcinogenesis. Cancer Cell 17, 121–134. [DOI] [PMC free article] [PubMed] [Google Scholar]
- Arbeit JM, Munger K, Howley PM, and Hanahan D (1994). Progressive squamous epithelial neoplasia in K14-human papillomavirus type 16 transgenic mice. J Virol 68, 4358–4368. [DOI] [PMC free article] [PubMed] [Google Scholar]
- Arbeit JM, Olson DC, and Hanahan D (1996). Upregulation of fibroblast growth factors and their receptors during multi-stage epidermal carcinogenesis in K14-HPV16 transgenic mice. Oncogene 13, 1847–1857. [PubMed] [Google Scholar]
- Bolotin DA, Poslavsky S, Mitrophanov I, Shugay M, Mamedov IZ, Putintseva EV, and Chudakov DM (2015). MiXCR: software for comprehensive adaptive immunity profiling. Nat Methods 12, 380–381. [DOI] [PubMed] [Google Scholar]
- Bonavita E, Gentile S, Rubino M, Maina V, Papait R, Kunderfranco P, Greco C, Feruglio F, Molgora M, Laface I, et al. (2015). PTX3 is an extrinsic oncosuppressor regulating complement- dependent inflammation in cancer. Cell 160, 700–714. [DOI] [PubMed] [Google Scholar]
- Carlson CS, Emerson RO, Sherwood AM, Desmarais C, Chung MW, Parsons JM, Steen MS, LaMadrid-Herrmannsfeldt MA, Williamson DW, Livingston RJ, et al. (2013). Using synthetic templates to design an unbiased multiplex PCR assay. Nat Commun 4, 2680. [DOI] [PubMed] [Google Scholar]
- Carmeliet P, Schoonjans L, Kieckens L, Ream B, Degen J, Bronson R, De Vos R, van den Oord JJ, Collen D, and Mulligan RC (1994). Physiological consequences of loss of plasminogen activator gene function in mice. Nature 368, 419–424. [DOI] [PubMed] [Google Scholar]
- Chen X, Poncette L, and Blankenstein T (2017). Human TCR-MHC coevolution after divergence from mice includes increased nontemplate-encoded CDR3 diversity. J Exp Med 214, 3417–3433. [DOI] [PMC free article] [PubMed] [Google Scholar]
- Coussens LM, Hanahan D, and Arbeit JM (1996). Genetic predisposition and parameters of malignant progression in K14-HPV16 transgenic mice. Am J Pathol 149, 1899–1917. [PMC free article] [PubMed] [Google Scholar]
- Coussens LM, Raymond WW, Bergers G, Laig-Webster M, Behrendtsen O, Werb Z, Caughey GH, and Hanahan D (1999). Inflammatory mast cells up-regulate angiogenesis during squamous epithelial carcinogenesis. Genes Dev 13, 1382–1397. [DOI] [PMC free article] [PubMed] [Google Scholar]
- Coussens LM, Tinkle CL, Hanahan D, and Werb Z (2000). MMP-9 supplied by bone marrow- derived cells contributes to skin carcinogenesis. Cell 103, 481–490. [DOI] [PMC free article] [PubMed] [Google Scholar]
- Daniel D, Meyer-Morse N, Bergsland EK, Dehne K, Coussens LM, and Hanahan D (2003). Immune enhancement of skin carcinogenesis by CD4+ T cells. J Exp Med 197, 1017–1028. [DOI] [PMC free article] [PubMed] [Google Scholar]
- de Visser KE, Korets LV, and Coussens LM (2004). Early neoplastic progression is complement independent. Neoplasia 6, 768–776. [DOI] [PMC free article] [PubMed] [Google Scholar]
- de Visser KE, Korets LV, and Coussens LM (2005). De novo carcinogenesis promoted by chronic inflammation is B lymphocyte dependent. Cancer Cell 7, 411–423. [DOI] [PubMed] [Google Scholar]
- Eichten A, Hyun WC, and Coussens LM (2007). Distinctive features of angiogenesis and lymphangiogenesis determine their functionality during de novo tumor development. Cancer Res 67, 5211–5220. [DOI] [PubMed] [Google Scholar]
- Faham M, Zheng J, Moorhead M, Carlton VE, Stow P, Coustan-Smith E, Pui CH, and Campana D (2012). Deep-sequencing approach for minimal residual disease detection in acute lymphoblastic leukemia. Blood 120, 5173–5180. [DOI] [PMC free article] [PubMed] [Google Scholar]
- Finch AM, Wong AK, Paczkowski NJ, Wadi SK, Craik DJ, Fairlie DP, and Taylor SM (1999). Low-molecular-weight peptidic and cyclic antagonists of the receptor for the complement factor C5a. J Med Chem 42, 1965–1974. [DOI] [PubMed] [Google Scholar]
- Foley JH (2017). Plasmin(ogen) at the Nexus of Fibrinolysis, Inflammation, and Complement. Semin Thromb Hemost 43, 135–142. [DOI] [PubMed] [Google Scholar]
- Foley JH, Peterson EA, Lei V, Wan LW, Krisinger MJ, and Conway EM (2015). Interplay between fibrinolysis and complement: plasmin cleavage of iC3b modulates immune responses. J Thromb Haemost 13, 610–618. [DOI] [PubMed] [Google Scholar]
- Gunderson AJ, Kaneda MM, Tsujikawa T, Nguyen AV, Affara NI, Ruffell B, Gorjestani S, Liudahl SM, Truitt M, Olson P, et al. (2016). Bruton Tyrosine Kinase-Dependent Immune Cell Cross-talk Drives Pancreas Cancer. Cancer Discov 6, 270–285. [DOI] [PMC free article] [PubMed] [Google Scholar]
- Hanahan D, and Coussens LM (2012). Accessories to the crime: functions of cells recruited to the tumor microenvironment. Cancer Cell 21, 309–322. [DOI] [PubMed] [Google Scholar]
- Hanahan D, and Weinberg RA (2011). Hallmarks of cancer: the next generation. Cell 144, 646–674. [DOI] [PubMed] [Google Scholar]
- Hopken UE, Lu B, Gerard NP, and Gerard C (1996). The C5a chemoattractant receptor mediates mucosal defence to infection. Nature 383, 86–89. [DOI] [PubMed] [Google Scholar]
- Huber-Lang M, Sarma JV, Zetoune FS, Rittirsch D, Neff TA, McGuire SR, Lambris JD, Warner RL, Flierl MA, Hoesel LM, et al. (2006). Generation of C5a in the absence of C3: a new complement activation pathway. Nat Med 12, 682–687. [DOI] [PubMed] [Google Scholar]
- Huber-Lang M, Younkin EM, Sarma JV, Riedemann N, McGuire SR, Lu KT, Kunkel R, Younger JG, Zetoune FS, and Ward PA (2002). Generation of C5a by phagocytic cells. Am J Pathol 161, 1849–1859. [DOI] [PMC free article] [PubMed] [Google Scholar]
- Junankar SR, Eichten A, Kramer A, de Visser KE, and Coussens LM (2006). Analysis of immune cell infiltrates during squamous carcinoma development. J Investig Dermatol Symp Proc 11, 36–43. [DOI] [PubMed] [Google Scholar]
- Mantovani A, Allavena P, Sica A, and Balkwill F (2008). Cancer-related inflammation. Nature 454, 436–444. [DOI] [PubMed] [Google Scholar]
- Mantovani A, Biswas SK, Galdiero MR, Sica A, and Locati M (2013). Macrophage plasticity and polarization in tissue repair and remodelling. J Pathol 229, 176–185. [DOI] [PubMed] [Google Scholar]
- Markiewski MM, DeAngelis RA, Benencia F, Ricklin-Lichtsteiner SK, Koutoulaki A, Gerard C, Coukos G, and Lambris JD (2008). Modulation of the antitumor immune response by complement. Nat Immunol 9, 1225–1235. [DOI] [PMC free article] [PubMed] [Google Scholar]
- Mekkawy AH, Pourgholami MH, and Morris DL (2014). Involvement of urokinase-type plasminogen activator system in cancer: an overview. Med Res Rev 34, 918–956. [DOI] [PubMed] [Google Scholar]
- Mikucki ME, Fisher DT, Matsuzaki J, Skitzki JJ, Gaulin NB, Muhitch JB, Ku AW, Frelinger JG, Odunsi K, Gajewski TF, et al. (2015). Non-redundant requirement for CXCR3 signalling during tumoricidal T-cell trafficking across tumour vascular checkpoints. Nat Commun 6, 7458. [DOI] [PMC free article] [PubMed] [Google Scholar]
- Nazarov VI, Pogorelyy MV, Komech EA, Zvyagin IV, Bolotin DA, Shugay M, Chudakov DM, Lebedev YB, and Mamedov IZ (2015). tcR: an R package for T cell receptor repertoire advanced data analysis. BMC Bioinformatics 16, 175. [DOI] [PMC free article] [PubMed] [Google Scholar]
- Pages F, Berger A, Camus M, Sanchez-Cabo F, Costes A, Molidor R, Mlecnik B, Kirilovsky A, Nilsson M, Damotte D, et al. (2005). Effector memory T cells, early metastasis, and survival in colorectal cancer. N Engl J Med 353, 2654–2666. [DOI] [PubMed] [Google Scholar]
- Reis ES, Mastellos DC, Ricklin D, Mantovani A, and Lambris JD (2018). Complement in cancer: untangling an intricate relationship. Nat Rev Immunol 18, 5–18. [DOI] [PMC free article] [PubMed] [Google Scholar]
- Rhee JS, Diaz R, Korets L, Hodgson JG, and Coussens LM (2004). TIMP-1 Alters Susceptibility to Carcinogenesis. Cancer Res 64, 952–961. [DOI] [PubMed] [Google Scholar]
- Ricklin D, Reis ES, and Lambris JD (2016). Complement in disease: a defence system turning offensive. Nat Rev Nephrol 12, 383–401. [DOI] [PMC free article] [PubMed] [Google Scholar]
- Robins HS, Campregher PV, Srivastava SK, Wacher A, Turtle CJ, Kahsai O, Riddell SR, Warren EH, and Carlson CS (2009). Comprehensive assessment of T-cell receptor beta-chain diversity in alphabeta T cells. Blood 114, 4099–4107. [DOI] [PMC free article] [PubMed] [Google Scholar]
- Ruffell B, and Coussens LM (2015). Macrophages and therapeutic resistance in cancer. Cancer Cell 27, 462–472. [DOI] [PMC free article] [PubMed] [Google Scholar]
- Schioppa T, Moore R, Thompson RG, Rosser EC, Kulbe H, Nedospasov S, Mauri C, Coussens LM, and Balkwill FR (2011). B regulatory cells and the tumor-promoting actions of TNF- alpha during squamous carcinogenesis. Proc Natl Acad Sci U S A 108, 10662–10667. [DOI] [PMC free article] [PubMed] [Google Scholar]
- Schmidt CQ, Lambris JD, and Ricklin D (2016). Protection of host cells by complement regulators. Immunol Rev 274, 152–171. [DOI] [PMC free article] [PubMed] [Google Scholar]
- Tumeh PC, Harview CL, Yearley JH, Shintaku IP, Taylor EJ, Robert L, Chmielowski B, Spasic M, Henry G, Ciobanu V, et al. (2014). PD-1 blockade induces responses by inhibiting adaptive immune resistance. Nature 515, 568–571. [DOI] [PMC free article] [PubMed] [Google Scholar]
- van Kempen LC, Rhee JS, Dehne K, Lee J, Edwards DR, and Coussens LM (2002). Epithelial carcinogenesis: dynamic interplay between neoplastic cells and their microenvironment. Differentiation 70, 610–623. [DOI] [PubMed] [Google Scholar]
- Zehn D, and Wherry EJ (2015). Immune Memory and Exhaustion: Clinically Relevant Lessons from the LCMV Model. Adv Exp Med Biol 850, 137–152. [DOI] [PubMed] [Google Scholar]
- Zhang J, Kobert K, Flouri T, and Stamatakis A (2014). PEAR: a fast and accurate Illumina Paired-End reAd mergeR. Bioinformatics 30, 614–620. [DOI] [PMC free article] [PubMed] [Google Scholar]
Associated Data
This section collects any data citations, data availability statements, or supplementary materials included in this article.