Abstract
The present work is an attempt to integrate the molecular simulation studies with in vitro cytotoxicity of cytarabine-loaded chitosan nanoparticles and exploring the potential of this formulation as therapeutics for treating solid tumours. The molecular simulation was performed using GROMACS v5.4 in which, chitosan polymer (CHT; six molecules) was used to study the encapsulation and release of a single molecule of cytarabine. Root Mean Square Deviation (RMSD) of the Cα atom of cytarabine (CBR) molecule shows that CBR starts to diffuse out of the CHT polymer binding pocket around 10.2 ns, indicated by increased fluctuation of RMSD at pH 6.4, while the drug diffusion is delayed at pH 7.4 and starts diffusing around 17.5 ns. Cytarabine-loaded chitosan nanoparticles (CCNP), prepared by ionic gelation method were characterized for encapsulation efficiency, particle size and morphology, zeta potential, crystallinity and drug release profile at pH 6.4 and 7.4. CCNPs showed 64% encapsulation efficiency with an average diameter of 100 nm and zeta potential of + 53.9 mV. It was found that cytarabine existed in amorphous state in nanoformulation. In vitro release studies showed 70% cytarabine was released from the chitosan-based nanoformulation release at pH 6.4, which coincides with the pH of tumour microenvironment. Cytotoxicity against breast cancer cell line (MCF 7) was higher for nanoformulation compared to free cytarabine. Haemocompatibility studies showed that chitosan-based nanoformulation is safe, biocompatible and nonhaemolytic in nature; hence, can be used as a safe drug delivery system. Taken together, our study suggests that chitosan nanoformulation would be an effective strategy for the pH-dependent release of cytarabine against solid tumours and might impart better therapeutic efficiency.
Electronic supplementary material
The online version of this article (10.1007/s13205-018-1510-x) contains supplementary material, which is available to authorized users.
Keywords: Cytarabine, Chitosan nanoparticles, EPR effect, Controlled release, Molecular simulation, Solid tumours
Introduction
Cytarabine (1β-arabinofuranosylcytosine, Ara—C), a synthetic nucleoside analogue approved by FDA for the treatment of myeloid leukaemia, non-Hodgkin’s lymphoma and meningeal leukaemia, was originally isolated from a Caribbean sponge Tethya crypta (Thomas 2009). Cytarabine gets phosphorylated inside the cell by deoxycytidine kinase to an active cytosine arabinoside triphosphate which competitively inhibits DNA polymerase and DNA repair mechanism. It has been reported that cytarabine has limited activity against solid tumours due to the high expression level of cytidine deaminase, an enzyme that degrades cytarabine (Kojima et al. 2002). Cytarabine rapidly gets deaminated to biologically inactive uracil derivative and thus necessitate a continuous infusion for the treatment. However, the overdosing of cytarabine might cause the development of drug-resistant cells with diminished sensitivity and other toxic side effects on normal tissues (Chhikara and Parang 2010). Short plasma half-life due to rapid deamination, low bioavailability, drug resistance and side effects due to overdosing limits the therapeutic index of cytarabine which can be improved by nanoformulation (Liu et al. 2017). Nanotechnology-based drug delivery offers targeted drug delivery of anticancer agents into tumour cells through passive targeting or active targeting. It prolongs the circulation half-life of the drug and improves the accumulation of nanosized drug in the extravascular space of tumours due to the Enhanced Permeability and Retention effect (EPR effect) (Gowda et al. 2017). EPR effect could be used for the accumulation of nanoparticle in tumours where vessel density is higher when compared to normal tissues which imparts tenfold increase in drug retention when compared to free drug (Singh et al. 2012). Studies have shown that delivery of phosphorylated nucleoside analogues in vectorized nanogels diminish the cytopathic effects of chemotherapy by reducing drug concentration (Galmarini et al. 2010). Encapsulation of the cytarabine in a biodegradable polymeric matrix ought to protect the drug from enzymatic degradation and to enhance the drug accumulation in tumour tissues.
Biodegradable drug delivery systems based on natural polymers are promising vectors for controlled and prolonged delivery of anticancer compounds (Joshy et al. 2017). Polysaccharides invite special attention in drug delivery as they possess desirable characteristic features such as biocompatibility, biodegradability and low immunogenicity (Posocco et al. 2015). Chitosan, a cationic polysaccharide has been extensively used in pharmaceutical applications due to its unique structural characteristics such as mucoadhesivity and pH sensitivity due to the presence of large number of amino groups (Prabaharan 2015). Besides, being a glucosamine-containing polymer, chitosan is amenable for surface modification due to the presence of reactive amino and hydroxyl groups at C-2 and C-6 positions, respectively. Chitosan nanoparticles catch special attention in drug delivery purposes due to the better stability, low toxicity and protection of molecules from degradation (Yang et al. 2014). Chitosan nanoformulations are widely used for pH-sensitive drug delivery purposes to attain sustained or controlled drug release (Sinha et al. 2004). The slow biodegradation of chitosan permits controlled and sustained release of loaded moieties, reduces the dosing frequency and hence useful for improving patient compliance (Rajitha et al. 2016).
Compatibility between drug and polymer is important for the efficient encapsulation and delivery of the drug molecule. Molecular docking along with molecular dynamics simulations is used as a predictive tool to study drug–polymer interactions and preferred orientation to form stable complex which helps to design a suitable drug carrier for cytarabine (Yadav et al. 2018). In this study we analysed the potential of chitosan to encapsulate cytarabine and its ability to release the payload at pH 6.4 and 7.4, which corresponds to the pH of tumour microenvironment and physiological pH of blood, respectively.
Materials and methods
Materials
Cytarabine (CBR) was purchased from Tocris Bioscience, UK. Chitosan, medium mol. wt. (degree of acetylation of 85%), sodium tripolyphosphate (TPP) and MTT were procured from Sigma, India. All other chemicals used were of analytical grade. Cell lines, MCF-7 and L929, for the study were obtained from the National Centre for Cell Sciences (NCCS) Pune, India.
In silico studies
Encapsulation of cytarabine (CBR) with chitosan (CHT) oligomer and its release at pH (6.4 and 7.4) were investigated by molecular dynamic simulation. Chitosan oligomer consisting of six randomly distributed monomer units was selected. The CBR molecule was placed inside the CHT oligomer without any constraint. Therefore, the all-atom system consists of a CHT oligomer in which the encapsulation of CTB before its release from the inner space of CHT was studied. The structure of CHT (CID:71853) and CTB (CID:6253) were downloaded from Pubchem database [https://pubchem.ncbi.nlm.nih.gov/]. Force field parameters of CHT and CTB were obtained from PRODRG2 server (Schüttelkopf and Van Aalten 2004). United-atom force field GROMOS 53a6 implemented in GROMACS v5.1.4 (Abraham et al. 2015) was used to model atomic interactions. As initial configurations, CTB was aligned along the centre of 6 CHT monomer units and separated sufficiently far away (> 3 nm) to minimize the effect of starting orientations. The system was solvated with SPC216 water molecules; the charge of the system was set neutral and the energy was minimized using the steepest descent method. During the simulation, the temperature was kept constant at 323 K using a Nosé–Hoover thermostat (Martyna et al. 1992) and the pressure was kept constant at 1 bar using the Parrinello–Rahman barostat (Parrinello et al. 1980). The long-range electrostatic interaction was calculated with the particle mesh by Ewald method (Essmann et al. 1995) with a cutoff of 1.0 nm, while electrostatic interactions between charged groups within 0.9 nm were calculated explicitly. A smooth 0.9 nm cutoff for the van der Waals interactions were calculated using Lennard-Jones potential. LINCS algorithm (Hess et al. 1997) was used to constrain all bond lengths, including those to hydrogen atoms with a time step 2 fs for the integration of motion equation in both equilibration and production runs, whereas the water geometry was constrained using SETTLE (Miyamoto and Kollman 1992). All the systems were equilibrated under NPT conditions by 1 ns after energy minimization to remove close contacts, where CTB, CHT and water molecules could relax. After equilibrium, the simulations were run for 20 ns, with coordinates saved every 100 ps. The molecular simulation studies were followed by wet lab experiments to integrate the result.
Synthesis of cytarabine-loaded chitosan nanoparticles
Cytarabine-loaded chitosan nanoparticles (CCNP) were prepared by the ionic gelation method described by Calvo et al. (1997). Briefly, 1% chitosan solution (w/v) was prepared in glacial acetic acid and the pH was adjusted to 5.5 using 0.1 N NaOH. A known amount of cytarabine was added to the prepared chitosan solution followed by TPP solution (0.8%) under magnetic stirring which was continued for 60 min at room temperature. The resultant suspension was then centrifuged for 30 min at 20,000 rpm. Supernatant was collected, and the pellet was washed repeatedly with distilled water. The obtained chitosan nanoparticle suspension was freeze-dried at − 70 °C for 48 h. Blank nanoparticles were prepared using the same methods but devoid of cytarabine.
Particle morphology, hydrodynamic diameter and zeta potential
The morphology and mean diameter of prepared nanoformulation were studied using High-Resolution Transmission Electron Microscopy (HR-TEM) (JEOL, JEM 2100). The nanoparticle suspensions were sonicated to prevent particle aggregation to obtain uniform dispersion and further loaded on a copper grid and observed after drying. The hydrodynamic diameter, polydispersity index and zeta potential of the nanoparticles were analysed by dynamic light scattering (DLS) technique based on photon correlation spectroscopy (Horiba Scientific, Nanopartica, Nanoparticle analyzer SZ—100, Japan). The measurement was done at 25 °C with scattering angle of 90°.
Encapsulation and loading efficiency
The encapsulation and loading efficiency of CCNPs were determined by measuring the absorbance at 277 nm using UV–Visible spectrophotometer. Two approaches were followed for this; an indirect method, in which the concentration of unentrapped cytarabine was measured and a direct method where the estimation of cytarabine present in the re-dispersed pellet obtained after centrifugation were quantified. The loading and encapsulation efficiencies were calculated using the formula given below,
| 1 |
| 2 |
where, W0 is the weight of entrapped cytarabine, W1 is the initial weight of cytarabine and W is the weight of chitosan nanoparticles.
Fourier transform-infrared spectroscopy (FT-IR)
The FT-IR spectra of pure cytarabine (CBR), cytarabine-loaded chitosan nanoparticles (CCNP) and blank nanoparticles (BL) were obtained with a FT-IR spectrophotometer (Thermo Nicolet, Avatar 370) using 32 scans at a resolution of 4 cm−1 in the range of 4000–400 cm−1.
DSC, TGA and XRD
The physical state of cytarabine, cytarabine-loaded chitosan nanoparticles and blank were studied in a differential scanning calorimeter (DSC 60 plus, Shimadzu, Japan). Samples were crimped and heated from 25 to 400 °C at a rate of 10 °C/min under nitrogen flow at a rate of 25 ml/min. Thermo gravimetric analysis of cytarabine, blank chitosan and CCNPs were studied using Perkin Elmer, Diamond TG/DTA system. TG curves were obtained by heating the samples at 20 °C/min from 40 °C to 740 °C under a nitrogen flow. The crystalline nature of the drug-loaded samples were also studied by measuring 2θ range of 5–50° powder X-ray diffraction (PXRD) by Bruker AXS D8 Advance with copper as source.
In vitro release kinetics
The cumulative release of cytarabine from CCNP was studied at pH 6.4 and 7.4. Chitosan nanoparticles of concentration 1 mg/1 ml were dispersed in phosphate buffer of pH 6.4 and 7.4. The CCNP were dialyzed (MW cut off—10,000 Da) in 10 ml of release buffer at 37 °C for 72 h. At predetermined intervals, 1 ml of sample was taken and used the concentration of cytarabine released was calculated by UV spectrophotometry at 277 nm. The experiment was carried out in triplicate and percentage of cumulative release was calculated and statistically analysed using GraphPad Prism 7.
To identify the kinetics and mechanism of release of cytarabine from chitosan nanoparticles, the data obtained from cumulative release were fitted into Korsmeyer Peppas equation, log Mt/ M ∞ = nlog t + k, where Mt/ M ∞ is the fraction of drug released at time ‘t’ with respect to amount of drug released at infinite time, k is the rate constant and n is the diffusional exponent (Korsmeyer et al. 1983).
Haemocompatibility studies
The haemolysis assay and RBC aggregation experiment were used to investigate the blood compatibility of chitosan nanoparticles according to the prescribed method (Augustine et al. 2017). The RBCs were separated by centrifuging anticoagulated blood at 800 rpm for 5 min and diluted with PBS. For haemolysis assay, 100 µl of nanoparticle suspension was incubated with diluted blood at 37 °C for 1 h. Normal saline and distilled water were used as negative (0%) and positive (100%) control, respectively. The samples were incubated for 1 h at 37 °C and centrifuged at 800 rpm for 5 min. The absorbance of released haemoglobin in the supernatant was measured at 541 nm by UV–Vis spectrophotometer. The haemolysis percentage was calculated as per the Eq. 3.
| 3 |
RBC aggregation studies were conducted by incubating 100 µl of diluted RBCs with 100 µl of nanoparticle suspension for 1 h at 37 °C along with positive and negative controls. Normal saline was used as negative control and polyethylene imine (PEI) was used as positive control, respectively. Aggregation of RBC was observed under phase contrast microscope (Leica, Germany) at a magnification of 40×
Cytotoxicity studies
The cytotoxicity of cytarabine and cytarabine-loaded chitosan nanoparticles against MCF-seven cells (human breast adenocarcinoma cell line) and L929 cells (mouse fibroblast cell line) were studied by MTT assay (Alley et al. 1988). The cells were grown in DMEM and seeded in 96-well plate with a density of 1 × 10⁴ cells per well and kept at 37 °C in 5% CO2 humidified incubator. The cells were treated with different concentrations (0.025–0.4 µM) of blank chitosan nanoparticles, cytarabine and cytarabine-loaded chitosan nanoparticles for 72 h. After incubation, the media were replaced and 20 µL of MTT (3-(4,5–dimethyl-thiazol-2-yl)-2,5-diphenyltetrazolium bromide) (5 mg/1 ml) was added to each well and incubated for 4 h. After incubation, the media were removed and 200 µL of DMSO was added to each well to dissolve the formazan crystals and plates were read at 540 nm in a microplate reader. The percentage of cell viability was calculated by the following equation:
| 4 |
Statistical analyses
All experiments were done in triplicate and all values were expressed as mean ± SE. Statistical analyses were done by Student’s t test and results were considered statistically significant if the p value was less than 0.05 (95% confidence level).
Results and discussion
In silico studies
The cytarabine (CBR) and chitosan (CHT) aggregation process and their interactions were studied with the aid of molecular dynamics simulations. The behaviour of the system was studied for 20 ns to interpret the molecular details of CBR encapsulation and release process.
CBR encapsulation
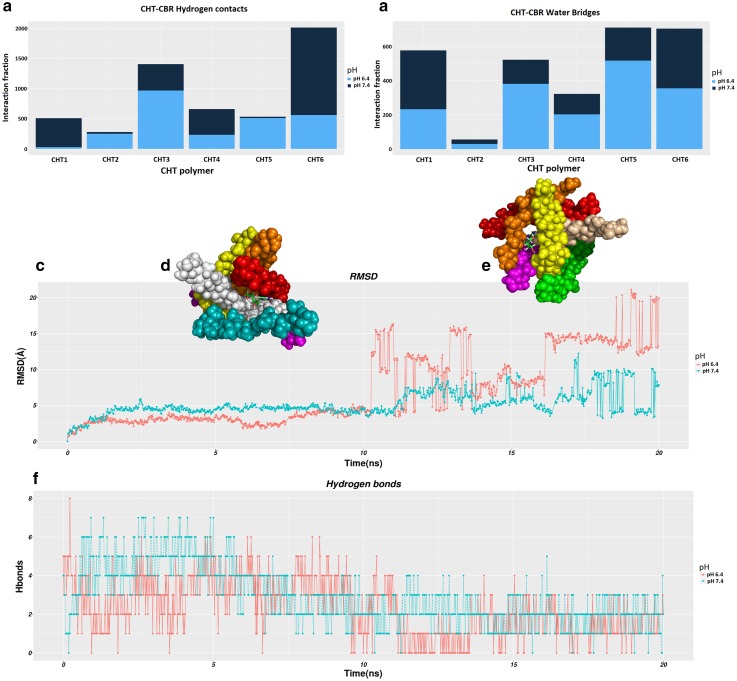
We analysed the formation of hydrogen bonds on the simulation trajectories, to better describe the CBR-CHT interactions. After equilibration, snapshots extracted from the trajectory at an interval of every 100 picoseconds (ps) of the entire 20 ns simulation time and the hydrogen contacts between CBR and CHT polymer were recorded at a distance < 0.35 nm. Molecular dynamics simulations show that the encapsulation process of CBR attached to CHT driven mainly by intermolecular hydrogen bonding accomplished by their interaction. A comparison of CBR/CHT encapsulation via hydrogen bonds indicate a higher density of hydrogen contacts at pH 7.4 and accounts for 62% of H-bonds, while the interaction comprises 38% of H-bonds at pH 6.4. They are evident through the number of hydrogen contacts and the diffusion time calculated during the simulation as shown in Fig. 1a. The increase in the intensity of hydrogen contacts indicates that the interaction of CBR with the inside of CHR polymer was stronger in pH 7.4 than at pH 6.4. Moreover, the existence of numerous hydrogen bond between CBR/CHT mediated by a water molecule at pH 7.4 (58% H-bonds) makes the aggregation more stable (Fig. 1.b). These findings imply that CBR/CHT aggregate into a compact structure with the help of hydrogen bonds.
Fig. 1.
Molecular dynamic simulations of CBR–CHT polymer interaction across a timescale of 20 ns. a Histogram of average number of hydrogen bonds; b water bridges between one molecule of CBR and six CHT monomeric units, at pH6.4(dark blue) and pH 7.4 (light blue); c RMSD of the Cα atom of CBR molecule from initial coordinates as a function of simulation time; d Overlaid on RMSD plot the snapshot of CBR release during 10.2 ns at pH 6.4; e Overlaid on RMSD plot the snapshot of CBR release during 17.5 ns at pH 7.4; (f) number of hydrogen bonds formed between CBR and CHT polymer vs simulation time
CBR release
During the transition, the CHT monomers undergo conformational changes, thereby displacing the CBR from the binding moiety. The diffusion of the CBR verified by RMSD profile indicate the magnitude of displacement and found distinct at both pH conditions. Figure 1.c shows the RMSD plot wherein the release of CBR from the CHT polymer in pH conditions (6.4 and 7.4) occurs at a relatively distinct time to the total simulation interval. From the visual inspection of the position of CBR as shown in Fig. 1d, e, it is apparent that the diffusion of CBR occurs at a time scale of 10.2 ns at pH 6.4; whereas in the case of pH 7.4, the dissemination of CBR impedes to get released at a time scale of 17.5 ns. Thus, RMSD plot reveals that the CBR could diffuse rapidly outward of the CHT polymer at pH 6.4; nevertheless, this does not happen swiftly in pH 7.4. A higher pattern of associated hydrogen bonds found in CBR/CHT configuration could infer the delayed release of the CBR from CHT polymer at pH 7.4 as displayed in Fig. 1.f.
Characterisation of cytarabine-loaded chitosan nanoparticles
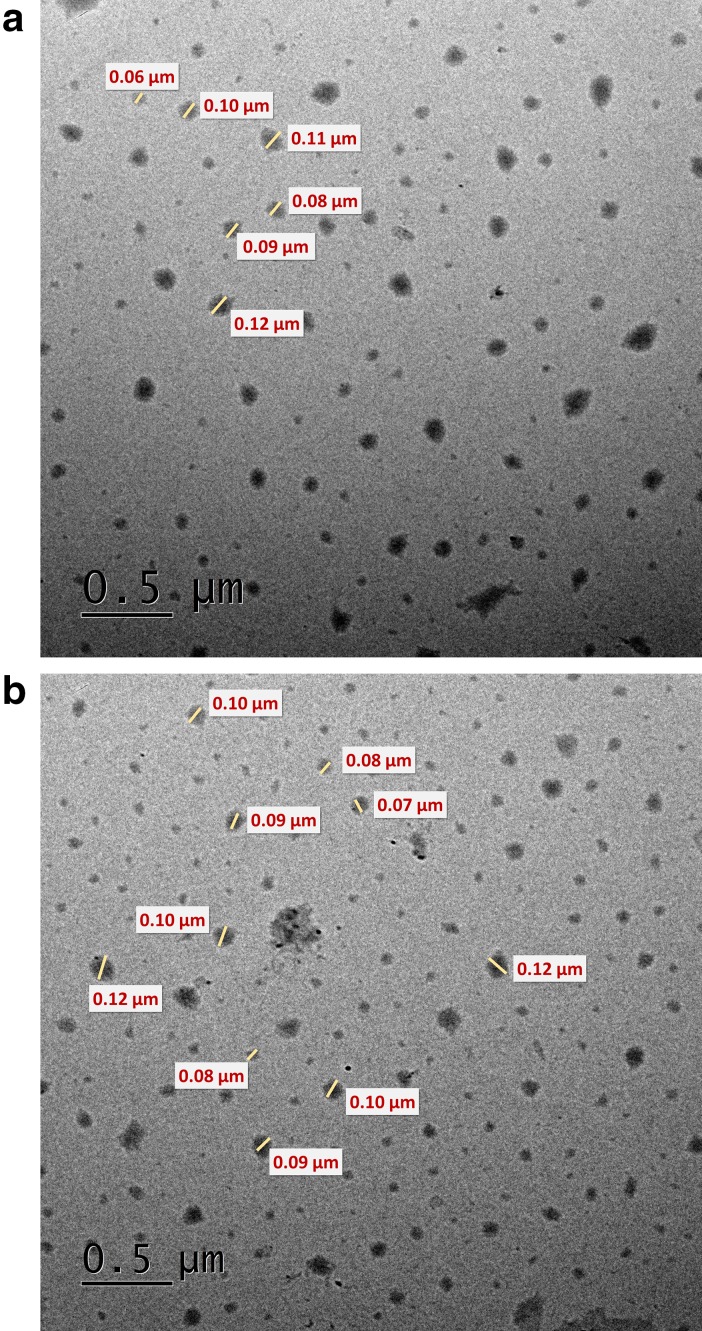
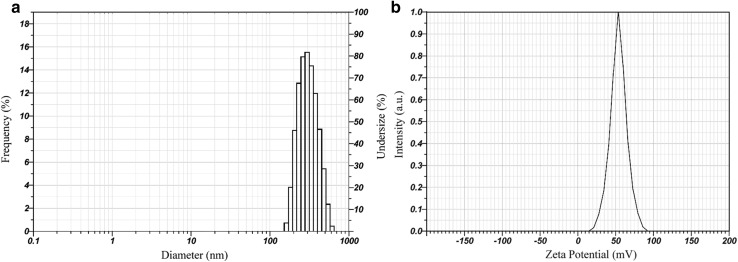
Cytarabine-loaded chitosan nanoparticles (CCNPs) were prepared by ionic crosslinking method described by Calvo et al. (1997) in which the amino group of chitosan was crosslinked by anionic tripolyphosphate (Hamidi et al. 2008). Nanoparticles were formed immediately upon mixing of the alkaline anionic TPP containing cytarabine with chitosan in acidic phase. Ionic gelation method is ideal for hydrophilic molecules like cytarabine that it can easily be incorporated in the initial chitosan and or TPP solution by reversible interactions such as hydrogen bonds, and vander Waal’s forces (Bugnicourt and Ladavière 2016). Encapsulation and loading efficiencies of cytarabine in chitosan nanoparticles were found 64.84 + 0.83% and 34.8 + 0.595%, respectively. Molecular dynamics studies authenticate favourable interaction of chitosan with cytarabine through hydrogen bonds. The morphology and size of prepared nanoparticles were studied using transmission electron microscopy (TEM). TEM image shows that the particles are roughly spherical in shape with an average diameter of 60–100 nm (Fig. 2a, b). However, the hydrodynamic diameter obtained from dynamic light scattering was found to be 314.2 nm with a polydispersity index of 0.481 and zeta potential + 53.9 mV (Fig. 3a, b). DLS measures the hydrodynamic diameter of the particle while physical core size was measured by TEM. Generally, the size measured from DLS is higher than the size obtained from TEM because the sample was measured in dried form under ultrahigh vacuum condition (Bhattacharjee 2016). The increase in size obtained by DLS might be due to the swelling of chitosan during the dispersion in water and this behaviour has been also reported by other researchers (Keawchaoon and Yoksan 2011). Drug carriers ranging in size from 10 to 500 nm are favourable for nonspecific targeting of therapeutics through enhanced retention and permeability (EPR) effect (Bae and Park 2011). The particle size less than 500 nm favours prolonged circulation time escaping the clearance of nanoparticles by phagocytic uptake (Hashad et al. 2016). Cytarabine-loaded chitosan nanoparticles showed a high positive zeta potential value with low PDI indicates a stable monodisperse solution (Fig. 3b). Zeta potential of the prepared nanoformulation was higher than + 30 mV indicating a stable colloidal solution and the high positive charge on the surface might prevent the aggregation of particles (Honary and Zahir 2013). The hydrodynamic diameter and zeta potential of the drug-loaded chitosan nanoparticles remained same after lyophilization and redispersion which indicates the stability of prepared nanoformulation. The nanoparticles were well reconstituted in deionised water without the aid of cryoprotectants. The high positive surface charge would enhance the binding of cytarabine-loaded chitosan nanoformulation with the negatively charged mucosal surfaces which enables the delivery of cytarabine on the targeted tissues.
Fig. 2.
TEM images of a blank chitosan nanoparticles and b CCNP
Fig. 3.
a Particle size distribution and b zeta potential of CCNPs by DLS
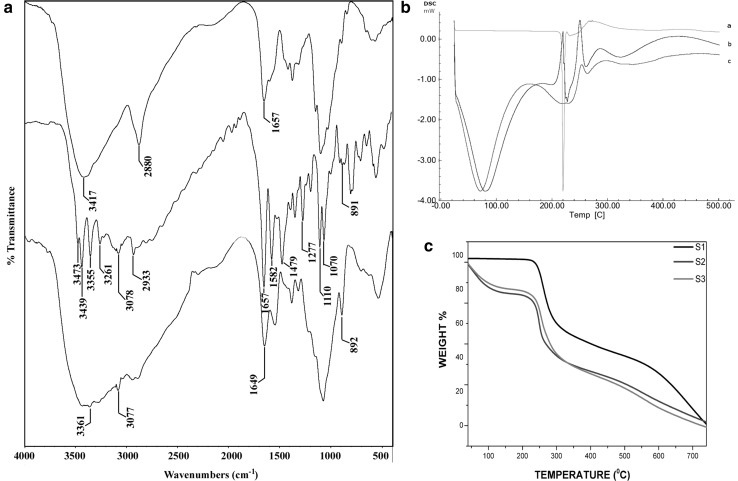
FT-IR spectra of pure chitosan, cytarabine and CCNPs are shown in Fig. 4a. Pure chitosan shows characteristic peaks at 3416 (–OH and –NH stretching), 2879 (–CH stretching) and 1656 cm− 1 are attributed to the CONH2 (amide I). Pure cytarabine exhibits peak at 3472, 3438, 3355, 3260 (–OH and –NH stretching), 3078 (aromatic C–H stretching), 2932 (–CH stretching), 1656 (C=O stretching), 1581, 1480 (C=N and C=C stretching), 1276, 1110, 1069 (C–O) stretching and 891 cm− 1 (aromatic C–H bending). The loading of cytarabine into the chitosan nanoparticles, the –OH and –NH stretching peaks at 3416 and 1656 has been shifted to 3361 and 1648, respectively. Further, appearance of peaks at 3076 and 891 cm-1 of aromatic C–H stretching and bending vibrations in drug-loaded chitosan nanoparticles indicate the successful entrapment of cytarabine.
Fig. 4.
a FT-IR spectra of chitosan, cytarabine and CCNP. b DSC thermograms of cytarabine, blank nanoparticles and CCNP. c TGA analysis of cytarabine (S1), blank nanoparticles (S2) and CCNP (S3)
Thermoanalytical methods, such as DSC and TGA are used to analyse the interactions between drug and polymer in nanoformulations. The thermograms obtained by DSC are shown in Fig. 4b. Pure cytarabine showed a sharp endothermic peak at 220.16 °C. The thermal spectra of void and drug-loaded chitosan nanoparticles showed similar endothermic peaks at 60 °C to 80 °C and 250 °C to 260 °C. However, the sharp peak shown by pure cytarabine was absent in the nanoformulation suggested that cytarabine was dispersed as amorphous state in chitosan matrix. Thermal stability and weight loss of cytarabine, blank chitosan nanoparticles and CCNPs were studied and represented in Fig. 4c. Nanoparticles underwent two step mass losses, one at below 100 °C and another one at the ranges of 200–350 °C, which could be attributed to the evaporation of water and degradation of polysaccharide structure. The low mass loss for pure cytarabine indicated that thermal stability of cytarabine was decreased after encapsulation. The DSC and TGA data ensure the successful entrapment of cytarabine in chitosan matrix. PXRD was also conducted to study the physical state of cytarabine in the prepared formulations. X-ray diffraction pattern of pure chitosan showed two distinct peaks at 2Ɵ of 9.383 and 19.930 (Supplementary Fig. 1) while in the case of chitosan nanoparticles, there was an observed shift in peak position and broadness of peak. The change in diffractogram indicates the transition of crystalline structure of chitosan. For cytarabine-loaded chitosan nanoparticles, absence of sharp peaks confirms the amorphous state of cytarabine. The transition of crystalline to amorphous state of the formulation might enhance its solubility.
In vitro release kinetics
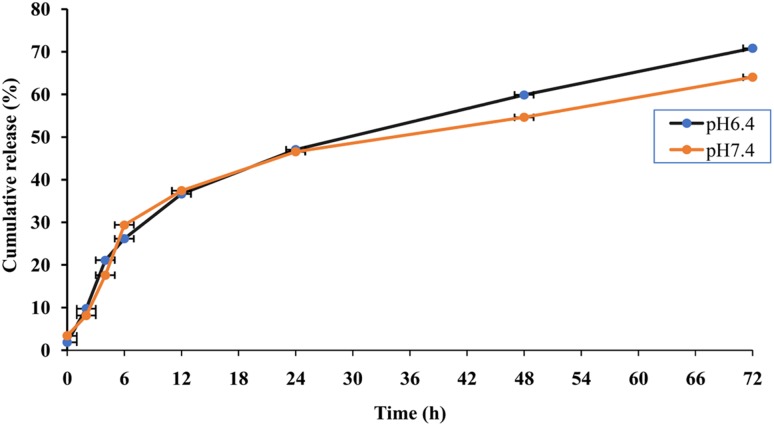
In vitro release profile of cytarabine from chitosan nanoparticles was studied in phosphate buffers with pH 6.4 and 7.4 which represents pH of tumour microenvironment and blood, respectively. The release of cytarabine from chitosan nanoparticles showed a biphasic pattern in which there was an initial burst followed by a phase of slow release. It was found that 40% of the drug was released within 24 h at pH 6.4 and 7.4 at 37 °C followed by a slow and sustained release. After 72 h, 70.82% of the cytarabine was released at pH 6.4 and 64% was released at pH 7.4 (Fig. 5). A spike in the drug release observed during the initial hours could be attributed to the release of drug molecules adhered on the surface of chitosan nanoparticle followed by a sustained release favoured by diffusion of drug through polymer matrix. The release of cytarabine was higher at pH 6.4, the pH of tumour microenvironment, compared to physiological pH (p value < 0.05). The same mechanism has been reported that chitosan nanoparticles taken up by tumour cells showed faster release at pH surrounding the tumour (Vivek et al. 2013). At lower pH, there is an increase in the pore size of swollen polymer network due to enhanced repulsion between chitosan polymer chains owing to the protonation of amino groups (Zhang et al. 2006). Th pH-sensitive release of chitosan nanoparticles would be a desirable attribute favouring the release of cytarabine inside the solid tumours where the lower pH prevail compared to normal tissues. The slightly acidic microenvironment in the malignant tumours was due to the enhanced hypoxia and increased glucose metabolism. Thus, the pH-triggered release payload in the tumour environment significantly enhances the accumulation of such drug in the tumour tissue (Liu et al. 2013).
Fig. 5.
The cumulative percentage release of cytarabine from CCNPs at pH 6.4 and 7.4 (p value ≤ 0.05)
The release of drug from chitosan nanoparticles occur through three mechanisms such as release from the particle surface, diffusion through swollen matrix and polymer erosion (Arifin et al. 2006). In few cases, the release occurs by combination of these mechanisms. The mechanism for the release of cytarabine was identified from the value of diffusional exponent obtained from Korsmeyer Peppas equation. The ‘n’ value obtained from Korsmeyer Peppas equation was 0.8704 for pH 6.4 and 0.8077 for pH 7.4 which indicates that the release of cytarabine from chitosan nanoparticles was following non-Fickian or anomalous diffusion pattern which could be attributed to the reversible swelling character of chitosan nanoparticles (Korsmeyer et al. 1986).
Haemocompatibility studies
Nanomaterials used in the systemic administration of therapeutics must be safe, biocompatible and nonhaemolytic. The prepared nanoformulation was evaluated for haemocompatibility using haemolysis assay and RBC aggregation. According to Standard Practice for Assessment of Hemolytic Properties of Materials from the American Society for testing and Materials (ASTM756, 2000), materials are classified as nonhemolytic (0–2% of hemolysis), slightly hemolytic (2–5% of hemolysis) and hemolytic (above 5% of hemolysis) (Kamat et al. 2015). The hemolysis percentage for chitosan nanoparticles was found to be 0.019 ± 0.006% which indicates the prepared nanoformulation was nonhemolytic. The RBC aggregation represented in Fig. 6 showed that there was no aggregation in the treated sample whereas the PEI (positive control)-treated samples showed RBC aggregation. The hemolysis and RBC aggregation results showed that the prepared nanoformulation can be used as a safe drug delivery system.
Fig. 6.
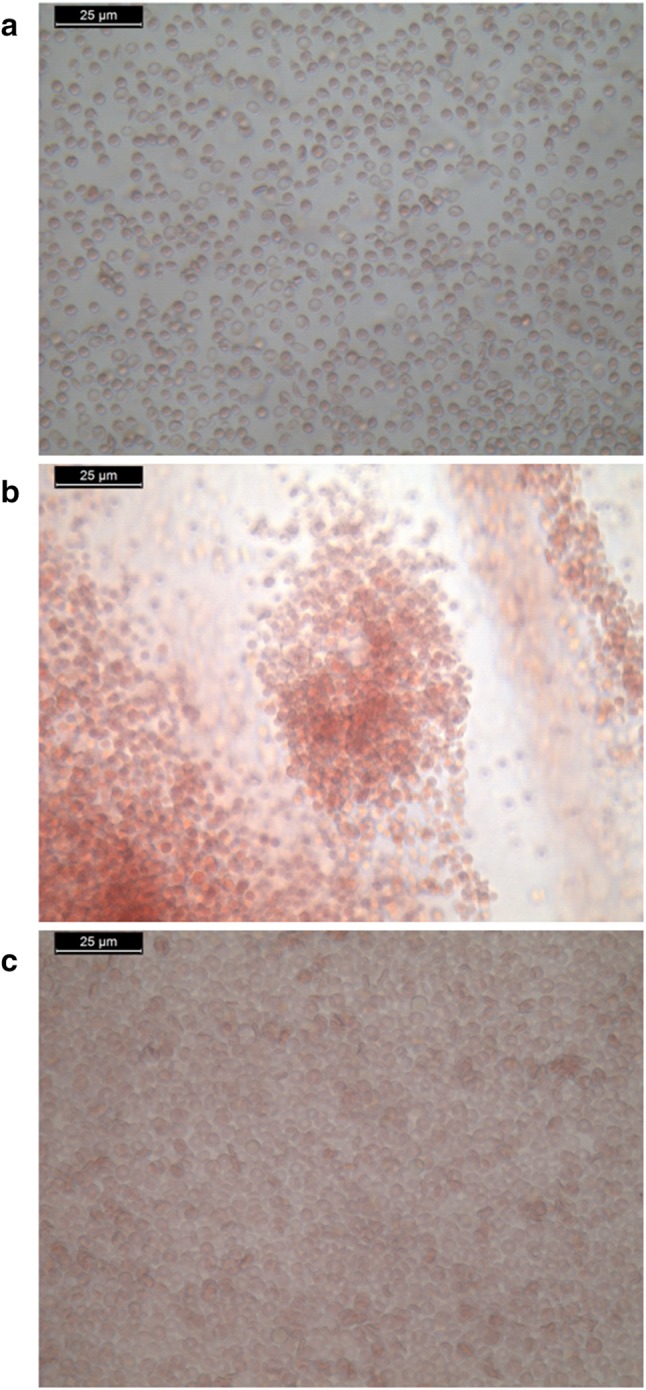
RBC aggregation in a normal saline; b PEI; c chitosan nanoparticles
Cytotoxicity studies
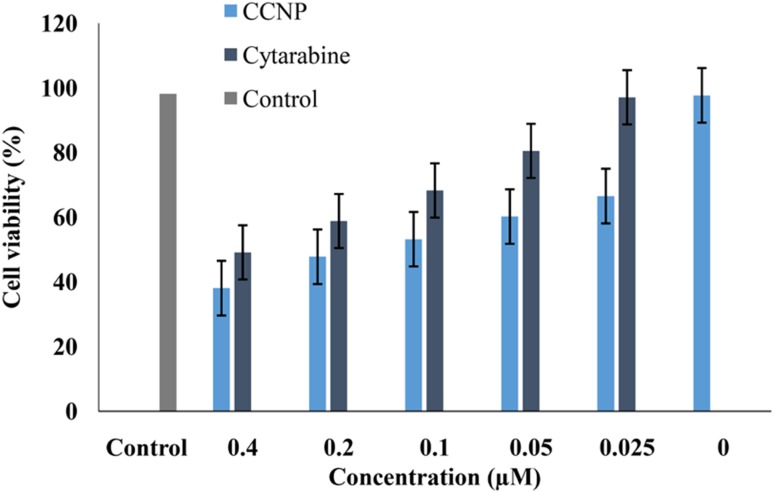
The cytotoxicity was evaluated in human breast adenocarcinoma (MCF 7) and non cancerous cell line, L929 with pure cytarabine concentrations ranging from 0.025 to 0.4 µM and CCNPs with equivalent concentration of drug for an incubation period of 72 h. Untreated MCF 7 cells, as well as cells treated with blank chitosan nanoparticles served as control. The cell toxicity was measured by estimating the formation of formazan crystals formed by the reduction of tetrazolium component of MTT. The maximum cytotoxicity (61.9%) was reported with CCNPs at a concentration of 0.4 µM while the same concentration of pure cytarabine showed toxicity of 50.9% (Fig. 7). The statistical analysis of these results showed that the cytotoxicity of cytarabine-loaded chitosan nanoparticles was higher than pure cytarabine (p value ≤ 0.05). Interestingly, CCNPs showed more cytotoxicity towards MCF-7 cell than L929 cell line (Supplementary Fig. 2). Blank chitosan nanoparticles showed less cell toxicity which ensures the biocompatibility of chitosan. The increased cytotoxic effect of CCNPs might be due to sustained release of cytarabine at the slightly acidic pH prevailing in tumour cells. The enhanced internalization of nanosized CCNPs in tumour cells increases the concentration of active drug by EPR effect also contributed to the enhanced cytotoxicity (Maeda et al. 2000). Solid tumours have a low intracellular pH due to hypoxia and increased glycolysis which led to pH-sensitive release of encapsulated drug (Liu et al. 2013). Galmarini et al. (2008) reported that nanogel formulations of triphosphate forms of nucleoside analogues showed enhanced cytotoxicity against breast and colorectal cell lines. In vitro release studies and cytotoxicity studies showed significant correlation with the data obtained from molecular simulation studies. The release of cytarabine from nanoformulation at a pH of tumour microenvironment favours enhanced cytotoxicity of cytarabine in MCF 7 cell lines.
Fig. 7.
MTT assay of cytarabine-loaded chitosan nanoparticles on MCF-7 cells after 72 h exposure. Results expressed as mean ± SD (p value < 0.05)
Conclusion
The present work evaluated the efficiency of chitosan nanoparticles as carrier for the controlled release of cytarabine in breast cancer cell lines with the aid of molecular simulation studies. Cytarabine-loaded chitosan nanoparticles prepared by ionic gelation method have a particle size of less than 400 nm favours EPR effect. In vitro release of cytarabine from chitosan nanoparticles showed sustained release of cytarabine with non-Fickian diffusion pattern while the release was found to be higher at pH 6.4. In vitro cytotoxicity studies in breast cancer cell lines showed the enhanced cytotoxicity of cytarabine nanoformulation compared to pure cytarabine. Also, chitosan nanoparticle showed pH-sensitive release of cytarabine which enhances its selective accumulation in the tumour tissue than in normal tissues. Haemocompatibility studies showed that chitosan-based nanoformulation is safe, biocompatible and nonhaemolytic in nature hence can be used as a safe drug delivery system. Therefore, chitosan nanoformulation could be a promising strategy for improving therapeutic efficiency of cytarabine against solid tumours.
Electronic supplementary material
Below is the link to the electronic supplementary material.
Acknowledgements
The first author is grateful to University Grants Commission (UGC), Government of India for providing BSR fellowship. The authors acknowledge the facilities extended by Sophisticated Test and Instrumentation Centre (STIC) and National Centre for Aquatic Animal Health, Cochin University of Science and Technology.
Compliance with ethical standards
Conflict of interest
The authors would like to declare that there are no conflicts of interest.
References
- Abraham MJ, Murtola T, Schulz R, et al. Gromacs: high performance molecular simulations through multi-level parallelism from laptops to supercomputers. SoftwareX. 2015;1–2:19–25. doi: 10.1016/j.softx.2015.06.001. [DOI] [Google Scholar]
- Alley MC, Scudiero DA, Monks A, et al. Feasibility of drug screening with panels of human tumor cell lines using a microculture tetrazolium assay. Cancer Res. 1988;48:584–588. [PubMed] [Google Scholar]
- Arifin DY, Lee LY, Wang CH. Mathematical modeling and simulation of drug release from microspheres: implications to drug delivery systems. Adv Drug Deliv Rev. 2006;58:1274–1325. doi: 10.1016/j.addr.2006.09.007. [DOI] [PubMed] [Google Scholar]
- Augustine R, Nethi SK, Kalarikkal N, et al. Electrospun polycaprolactone (PCL) scaffolds embedded with europium hydroxide nanorods (EHNs) with enhanced vascularization and cell proliferation for tissue engineering applications. J Mater Chem B. 2017;5:4660–4672. doi: 10.1039/c7tb00518k. [DOI] [PubMed] [Google Scholar]
- Bae YH, Park K. Targeted drug delivery to tumors: Myths, reality and possibility. J Control Release. 2011;153:198–205. doi: 10.1016/j.jconrel.2011.06.001. [DOI] [PMC free article] [PubMed] [Google Scholar]
- Bhattacharjee S. DLS and zeta potential—What they are and what they are not? J Control Release. 2016;235:337–351. doi: 10.1016/j.jconrel.2016.06.017. [DOI] [PubMed] [Google Scholar]
- Bugnicourt L, Ladavière C. Interests of chitosan nanoparticles ionically cross-linked with tripolyphosphate for biomedical applications. Prog Polym Sci. 2016;60:1–17. doi: 10.1016/j.progpolymsci.2016.06.002. [DOI] [Google Scholar]
- Calvo P, RemunanLopez C, VilaJato JL, et al. Chitosan and chitosan ethylene oxide propylene oxide block copolymer nanoparticles as novel carriers for proteins and vaccines. Pharm Res. 1997;14:1431–1436. doi: 10.1023/A:1012128907225. [DOI] [PubMed] [Google Scholar]
- Chhikara BS, Parang K. Development of cytarabine prodrugs and delivery systems for leukemia treatment. Expert Opin Drug Deliv. 2010;7:1399–1414. doi: 10.1517/17425247.2010.527330. [DOI] [PubMed] [Google Scholar]
- Essmann U, Perera L, Berkowitz ML, et al. A smooth particle mesh Ewald method. J Chem Phys. 1995;103:8577–8593. doi: 10.1063/1.470117. [DOI] [Google Scholar]
- Galmarini CM, Warren G, Senanayake MT, Vinogradov SV. Efficient overcoming of drug resistance to anticancer nucleoside analogs by nanodelivery of active phosphorylated drugs. Int J Pharm. 2010;395:281–289. doi: 10.1016/j.ijpharm.2010.05.028. [DOI] [PMC free article] [PubMed] [Google Scholar]
- Gowda R, Kardos G, Sharma A, et al. Nanoparticle-based celecoxib and plumbagin for the synergistic treatment of melanoma. Mol Cancer Ther. 2017;16:440–452. doi: 10.1158/1535-7163.MCT-16-0285. [DOI] [PMC free article] [PubMed] [Google Scholar]
- Hamidi M, Azadi A, Rafiei P. Hydrogel nanoparticles in drug delivery. Adv Drug Deliv Rev. 2008;60:1638–1649. doi: 10.1016/j.addr.2008.08.002. [DOI] [PubMed] [Google Scholar]
- Hashad RA, Ishak RAH, Geneidi AS, Mansour S. Methotrexate loading in chitosan nanoparticles at a novel pH: response surface modeling, optimization and characterization. Int J Biol Macromol. 2016;91:630–639. doi: 10.1016/j.ijbiomac.2016.06.014. [DOI] [PubMed] [Google Scholar]
- Hess B, Bekker H, Berendsen HJC, Fraaije JGEM. LINCS: A linear constraint solver for molecular simulations. J Comput Chem. 1997;18:1463–1472. doi: 10.1002/(SICI)1096-987X(199709)18:12<1463. [DOI] [Google Scholar]
- Honary S, Zahir F. Effect of zeta potential on the properties of nano-drug delivery systems—a review (part 1) Trop J Pharm Res. 2013;12:255–264. doi: 10.4314/tjpr.v12i2.19. [DOI] [Google Scholar]
- Joshy KS, George A, Jose J, et al. Novel dendritic structure of alginate hybrid nanoparticles for effective anti-viral drug delivery. Int J Biol Macromol. 2017;103:1265–1275. doi: 10.1016/j.ijbiomac.2017.05.094. [DOI] [PubMed] [Google Scholar]
- Kamat V, Marathe I, Ghormade V, et al. Synthesis of monodisperse chitosan nanoparticles and in situ drug loading using active microreactor. ACS Appl Mater Interfaces. 2015;7:22839–22847. doi: 10.1021/acsami.5b05100. [DOI] [PubMed] [Google Scholar]
- Keawchaoon L, Yoksan R. Preparation, characterization and in vitro release study of carvacrol-loaded chitosan nanoparticles. Colloids Surf B Biointerfaces. 2011;84:163–171. doi: 10.1016/j.colsurfb.2010.12.031. [DOI] [PubMed] [Google Scholar]
- Kojima H, Iida M, Miyazaki H, et al. Enhancement of cytarabine sensitivity in squamous cell carcinoma cell line transfected with deoxycytidine kinase. ArchOtolarHead Neck Surg. 2002;128:708–713. doi: 10.1001/archotol.128.6.708. [DOI] [PubMed] [Google Scholar]
- Korsmeyer RW, Gurny R, Doelker E, et al. Mechanisms of solute release from porous hydrophilic polymers. Int J Pharm. 1983;15:25–35. doi: 10.1016/0378-5173(83)90064-9. [DOI] [Google Scholar]
- Korsmeyer RW, Von Meerwall E, Peppas NA. Solute and penetrant diffusion in swellable polymers. II. Verification of theoretical models. J Polym Sci Part B Polym Phys. 1986;24:409–434. doi: 10.1002/polb.1986.090240215. [DOI] [Google Scholar]
- Liu Y, Wang W, Yang J, et al. pH-sensitive polymeric micelles triggered drug release for extracellular and intracellular drug targeting delivery. Asian J Pharm Sci. 2013;8:159–167. doi: 10.1016/j.ajps.2013.07.021. [DOI] [Google Scholar]
- Liu J, Zhao D, He W, et al. Nanoassemblies from amphiphilic cytarabine prodrug for leukemia targeted therapy. J Colloid Interface Sci. 2017;487:239–249. doi: 10.1016/j.jcis.2016.10.041. [DOI] [PubMed] [Google Scholar]
- Maeda H, Wu J, Sawa T, et al. Tumor vascular permeability and the EPR effect in macromolecular therapeutics: a review. J Control Release. 2000;65:271–284. doi: 10.1016/S0168-3659(99)00248-5. [DOI] [PubMed] [Google Scholar]
- Martyna GJ, Klein ML, Tuckerman M. Nosé-Hoover chains: the canonical ensemble via continuous dynamics. J Chem Phys. 1992;97:2635–2643. doi: 10.1063/1.463940. [DOI] [Google Scholar]
- Miyamoto S, Kollman PA. Settle: an analytical version of the SHAKE and RATTLE algorithm for rigid water models. J Comput Chem. 1992;13:952–962. doi: 10.1002/jcc.540130805. [DOI] [Google Scholar]
- Parrinello M, Rahman A, Parrinello MRa. Crystal structure and pair potentials: a molecular_dynamics study. Phys Rev Lett. 1980;45:1196–1199. doi: 10.1103/PhysRevLett.45.1196. [DOI] [Google Scholar]
- Posocco B, Dreussi E, De Santa J, et al. Polysaccharides for the delivery of antitumor drugs. Materials (Basel) 2015;8:2569–2615. doi: 10.3390/ma8052569. [DOI] [Google Scholar]
- Prabaharan M. Chitosan-based nanoparticles for tumor-targeted drug delivery. Int J Biol Macromol. 2015;72:1313–1322. doi: 10.1016/j.ijbiomac.2014.10.052. [DOI] [PubMed] [Google Scholar]
- Rajitha P, Gopinath D, Biswas R, et al. Chitosan nanoparticles in drug therapy of infectious and inflammatory diseases. Expert Opin Drug Deliv. 2016;13:1177–1194. doi: 10.1080/17425247.2016.1178232. [DOI] [PubMed] [Google Scholar]
- Schüttelkopf AW, Van Aalten DMF. PRODRG: a tool for high-throughput crystallography of protein-ligand complexes. Acta Crystallogr Sect D Biol Crystallogr. 2004;60:1355–1363. doi: 10.1107/S0907444904011679. [DOI] [PubMed] [Google Scholar]
- Singh S, Sharma A, Robertson GP. Realizing the clinical potential of cancer nanotechnology by minimizing toxicologic and targeted delivery concerns. Cancer Res. 2012;72:5663–5668. doi: 10.1158/0008-5472.CAN-12-1527. [DOI] [PMC free article] [PubMed] [Google Scholar]
- Sinha VR, Singla AK, Wadhawan S, et al. Chitosan microspheres as a potential carrier for drugs. Int J Pharm. 2004;274:1–33. doi: 10.1016/j.ijpharm.2003.12.026. [DOI] [PubMed] [Google Scholar]
- Thomas X. Chemotherapy of acute leukemia in adults. Expert Opin Pharmacother. 2009;10:221–237. doi: 10.1517/14656560802618746. [DOI] [PubMed] [Google Scholar]
- Vivek R, Nipun Babu V, Thangam R, et al. PH-responsive drug delivery of chitosan nanoparticles as Tamoxifen carriers for effective anti-tumor activity in breast cancer cells. Colloids Surf B Biointerfaces. 2013;111:117–123. doi: 10.1016/j.colsurfb.2013.05.018. [DOI] [PubMed] [Google Scholar]
- Yadav P, Bandyopadhyay A, Chakraborty A, Sarkar K. Enhancement of anticancer activity and drug delivery of chitosan-curcumin nanoparticle via molecular docking and simulation analysis. Carbohydr Polym. 2018;182:188–198. doi: 10.1016/j.carbpol.2017.10.102. [DOI] [PubMed] [Google Scholar]
- Yang Y, Wang S, Wang Y, et al. Advances in self-assembled chitosan nanomaterials for drug delivery. Biotechnol Adv. 2014;32:1301–1316. doi: 10.1016/j.biotechadv.2014.07.007. [DOI] [PubMed] [Google Scholar]
- Zhang H, Mardyani S, Chan WCW, Kumacheva E. Design of biocompatible chitosan microgels for targeted pH-mediated intracellular release of cancer therapeutics. Biomacromol. 2006;7:1568–1572. doi: 10.1021/bm050912z. [DOI] [PubMed] [Google Scholar]
Associated Data
This section collects any data citations, data availability statements, or supplementary materials included in this article.


