

Myeloid-derived suppressor cells (MDSCs) are a heterogeneous population of immature monocytes and granulocytes. While neutrophils (polymorphonuclear leukocytes [PMNs]) are classically identified as highly differentiated cells specialized for antimicrobial defense, our laboratory has reported minor contributions of PMNs to the immune response during Staphylococcus aureus biofilm infection.
KEYWORDS: biofilm, myeloid-derived suppressor cells, monocytes, neutrophils, orthopedic infection, Staphylococcus aureus
ABSTRACT
Myeloid-derived suppressor cells (MDSCs) are a heterogeneous population of immature monocytes and granulocytes. While neutrophils (polymorphonuclear leukocytes [PMNs]) are classically identified as highly differentiated cells specialized for antimicrobial defense, our laboratory has reported minor contributions of PMNs to the immune response during Staphylococcus aureus biofilm infection. However, these two cell types can be difficult to differentiate because of shared surface marker expression. Here we describe a more refined approach to distinguish MDSCs from PMNs utilizing the integrin receptor CD11b combined with conventional Ly6G and Ly6C expression. This approach separated the Ly6G+ Ly6C+ population that we previously identified in a mouse model of S. aureus orthopedic implant infection into two subsets, namely, CD11bhigh Ly6G+ Ly6C+ MDSCs and CD11blow Ly6G+ Ly6C+ PMNs, which was confirmed by characteristic nuclear morphology using cytospins. CD11bhigh Ly6G+ Ly6C+ MDSCs suppressed T cell proliferation throughout the 28-day infection period, whereas CD11blow Ly6G+ Ly6C+ PMNs had no effect early (day 3 postinfection), although this population acquired suppressive activity at later stages of biofilm development. To further highlight the distinctions between biofilm-associated MDSCs and PMNs versus monocytes, transcriptional profiles were compared by transcriptome sequencing (RNA-Seq). A total of 6,466 genes were significantly differentially expressed in MDSCs versus monocytes, whereas only 297 genes were significantly different between MDSCs and PMNs. A number of genes implicated in cell cycle regulation were identified, and in vivo ethynyldeoxyuridine (EdU) labeling revealed that approximately 50% of MDSCs proliferated locally at the site of S. aureus biofilm infection. Based on their similar transcriptomic profiles to those of PMNs, biofilm-associated MDSCs are of a granulocytic lineage and can be classified as granulocytic MDSCs (G-MDSCs).
INTRODUCTION
Myeloid-derived suppressor cells (MDSCs) are a heterogeneous population of myeloid progenitor cells that share attributes with monocytes and neutrophils (polymorphonuclear leukocytes [PMNs]) (1–3). The role of MDSCs in cancer has been well documented, and their involvement has now been expanded to several other pathological conditions, including bacterial, parasitic, and viral infections; acute and chronic inflammation; and traumatic stress (4–8). MDSCs can be activated in response to a wide variety of cytokines, which has made deciphering the signals required for their induction difficult to ascertain and often context specific (3). In cancer, the functional attributes of MDSCs are shaped by factors produced by both the tumor as well as normal host cells (9). This paradigm is likely also true for other pathologies, including infectious diseases. For example, our laboratory has established a critical role for MDSCs in promoting Staphylococcus aureus biofilm persistence, which is influenced by both bacterium- and host-derived products (10–13).
Despite their degree of heterogeneity, MDSCs in mice express both Gr-1 and CD11b but lack markers of mature myeloid cells (3, 14). Although the Gr-1+ CD11b+ population as a whole displays properties characteristic of MDSCs, this surface marker combination makes it difficult to discern the phenotype of the suppressive population under a given pathological condition given the fact that the Gr-1 antibody (Ab) reacts with both Ly6G and Ly6C (15), markers of granulocytes and monocytes, respectively. Therefore, efforts have recently been made to use differential Ly6G and Ly6C expression to separate MDSCs into two main subsets, namely, granulocytic and monocytic MDSCs (G-MDSCs and M-MDSCs, respectively). In general, G-MDSCs are classified as CD11b+ Ly6G+ Ly6C+, whereas M-MDSCs are CD11b+ Ly6G− Ly6C+, although there is some variability in the degrees to which these markers are expressed (1, 8, 14, 16, 17). In addition to their distinct surface marker expression, these two subsets have been reported to possess alternate mechanisms of inhibiting T cell responses, in general utilizing nitric oxide (NO) (M-MDSCs) and reactive oxygen species (ROS) (G-MDSCs) to induce immunosuppression (18, 19).
During infection, it is thought that MDSCs in the bone marrow are recruited to sites of inflammation to replace damaged or exhausted cells (7, 13). However, upon arrival, factors within the microenvironment, host and/or pathogen derived, arrest MDSCs in an immature state, and local proinflammatory signals lead to their acquisition of immunosuppressive properties (16). Our laboratory was the first to demonstrate a role for MDSCs in S. aureus biofilms, which has subsequently been confirmed by other groups using distinct S. aureus infection models (12, 20–23). In our studies, Ly6G+ Ly6C+ MDSCs were found to infiltrate S. aureus biofilms and establish an anti-inflammatory milieu leading to persistent infection (10, 12). This heterogeneous cell population expressed genes typical of MDSCs that had been described for other pathological conditions, including Arg-1, inducible nitric oxide synthase (iNOS), and interleukin-10 (IL-10), and was capable of inhibiting T cell proliferation (10, 12). In our initial report, PMN-like cells were characterized as Ly6Glow Ly6Clow and did not display T cell-suppressive activity. However, appreciating their known heterogeneity, we sought to further refine our analysis of MDSCs during S. aureus orthopedic biofilm infection by separating Ly6G+ Ly6C+ MDSCs and PMNs based on CD11b expression. This approached revealed that immunosuppressive MDSCs were CD11bhigh, whereas PMNs were CD11blow and resembled peripheral blood PMNs. Furthermore, while CD11bhigh MDSCs were able to suppress T cell proliferation throughout a 1-month infection period, CD11blow PMNs had no effect early (i.e., day 3) but acquired suppressive activity between 7 and 28 days following infection. To further demonstrate the distinctions between biofilm-associated MDSCs and PMNs at the site of infection, transcriptional profiles of MDSCs were compared to those of both PMNs and monocytes by transcriptome sequencing (RNA-Seq) at day 7 postinfection, a time point corresponding to biofilm establishment and significant MDSC suppressive activity. A total of 6,466 genes were significantly differentially expressed in MDSCs versus monocytes, which demonstrates the distinct natures of these two populations. However, only 297 genes were significantly different between MDSCs and PMNs, highlighting the similarities between these two cell types and supporting the concept that MDSCs recruited to the site of S. aureus biofilm infection are G-MDSCs. Interestingly, RNA-Seq identified significant increases in the levels of several cell cycle-associated genes, which was corroborated by in vivo ethynyldeoxyuridine (EdU) labeling and revealed dramatic MDSC proliferation at the site of biofilm infection. Collectively, these findings reveal the complexity of MDSC infiltrates associated with biofilm infections and highlight a previously unappreciated mechanism for MDSC expansion by local cell proliferation.
RESULTS
CD11b expression reveals subpopulations within Ly6G+ Ly6C+ infiltrates during S. aureus biofilm infection.
Our laboratory has shown that Ly6G+ Ly6C+ MDSCs accumulate at a significantly higher rate than PMNs, monocytes, and macrophages during S. aureus orthopedic infection and are responsible, in part, for bacterial persistence (10–12). However, we have recently identified a more refined approach for distinguishing suppressive MDSCs from PMNs that incorporates the integrin receptor CD11b. In agreement with our previous reports, Ly6G+ Ly6C+ cells were the predominant CD45+ leukocyte infiltrates in S. aureus biofilm-infected tissues at days 3, 7, 14, and 28 postinfection (Fig. 1A). However, when Ly6G+ Ly6C+ cells were assessed for their levels of CD11b expression, two populations were evident, namely, CD11bhigh Ly6G+ Ly6C+ and CD11blow Ly6G+ Ly6C+ cells (Fig. 1B). To demonstrate the uniqueness of the CD11bhigh Ly6G+ Ly6C+ population in biofilm-infected tissue, we compared staining patterns with those in peripheral blood, which revealed distinct differences (Fig. 1B). Specifically, CD11bhigh Ly6G+ Ly6C+ cells were observed only in S. aureus-infected tissue, whereas CD11blow Ly6G+ Ly6C+ cells were present in both the tissue and blood (Fig. 1B, D, and E). Cytospins of each population confirmed the heterogeneity of CD11bhigh Ly6G+ Ly6C+ cells with granulocytic and monocytic morphologies, including cells with ringed nuclei (Fig. 1G), similar to what we have previously reported as MDSCs (12). Since MDSCs are not abundant in the blood (Fig. 1D), it was not possible to obtain sufficient cell numbers to acquire cytospin images for comparisons of cellular morphology (Fig. 1 and data not shown). Conversely, CD11blow Ly6G+ Ly6C+ cells displayed a typical granulocytic morphology with hypersegmented nuclei more reflective of mature PMNs (Fig. 1H), which was confirmed by their similarity to peripheral blood PMNs (Fig. 1J). Quantification of nuclear morphology revealed that tissue-associated MDSCs consisted of 55% banded and 45% hypersegmented cells, whereas tissue PMNs were typified by 11% banded and 89% hypersegmented cells, further supporting the distinctions between the cell populations. Collectively, these findings allowed us to identify CD11bhigh Ly6G+ Ly6C+ cells as MDSCs and CD11blow Ly6G+ Ly6C+ cells as PMNs. Monocyte numbers in implant-associated tissue and blood were determined by gating on Ly6G− Ly6C+ cells (Fig. 1A, inset C) and subsequently depicting them by Ly6C versus F4/80 expression (Fig. 1C). Monocytes were more abundant in the peripheral blood than in implant-associated tissue, and the presence of F4/80+ cells was also low in the tissue (Fig. 1F). Cytospins of the Ly6G− Ly6C+ F4/80− population from infected tissue displayed large rounded nuclei, characteristic of monocytes (Fig. 1I), which was confirmed based on similarities to peripheral blood monocytes (Fig. 1K). The relative percentages of each leukocyte population in biofilm-associated tissues were similar to absolute cell numbers across the 28-day infection period (see Fig. S1 in the supplemental material).
FIG 1.

Differential surface marker expression identifies three distinct leukocyte populations in tissues during S. aureus orthopedic biofilm infection. Implant-associated tissues and blood were collected at days 3, 7, 14, and 28 postinfection and analyzed by flow cytometry. (A) Representative contour plots of Ly6G and Ly6C staining demonstrate that Ly6G+ Ly6C+ (inset B) and Ly6G− Ly6C+ (inset C) cells are present in both infected tissue and blood. (B) CD11b expression levels of Ly6G+ Ly6C+ cells identified in inset B, where the horizontal line depicts the demarcation between CD11bhigh and CD11blow cells. (C) Representative contour plots of Ly6C and F4/80 expression on Ly6G− Ly6C+ cells from inset C. (D to F) Quantification of CD11bhigh Ly6G+ Ly6C+ MDSCs (D), CD11blow Ly6G+ Ly6C+ PMNs (E), and Ly6G− Ly6C+ F4/80− monocytes (F) in tissue and blood at the indicated time points postinfection. (G to K) Cytospin preparations of FACS-purified tissue MDSCs (G), PMNs (H), and monocytes (I) and peripheral blood PMNs (J) and monocytes (K) at day 14 postinfection (magnification, ×40). A sufficient number of MDSCs could not be recovered from the blood for cytospin preparation (not available).
To further investigate the distinction between CD11bhigh MDSCs and CD11blow PMNs, we next examined their ability to suppress polyclonal CD4+ T cell proliferation. CD11bhigh Ly6G+ Ly6C+ MDSCs significantly inhibited CD4+ T cell proliferation at a 1:1 ratio at days 3, 7, 14, and 28 postinfection (Fig. 2A). In contrast, CD11blow Ly6G+ Ly6C+ PMNs were unable to block CD4+ T cell proliferation at day 3 postinfection but interestingly acquired suppressive activity at later intervals (Fig. 2A). This was unique to the infection site, since blood PMNs did not inhibit T cell proliferation at any time point (Fig. 2B), revealing the importance of signals present in the biofilm milieu for inducing PMN-suppressive activity. The timing of PMN acquisition of suppressive activity coincides with the transition of S. aureus growth from a planktonic (day 3) to a biofilm (day 7) state in the orthopedic implant infection model. This was demonstrated by leveraging antibiotic resistance as a functional definition of biofilm formation. Specifically, when antibiotic treatment was initiated at day 3 postinfection, the majority of mice had no detectable bacteria in implant-associated tissues compared to vehicle-treated animals (Fig. S2). In contrast, when antibiotic administration was delayed until day 7, 86% of mice remained infected, although an overall decrease in the bacterial burden was still observed (Fig. S2). This is reflective of biofilm formation, although antibiotic recalcitrance may become more pronounced at later stages of infection. The finding that PMNs were suppressive when biofilm establishment has occurred agrees with our previous work demonstrating that monocyte/macrophage anti-inflammatory activity also manifests at this interval (10–12), reflective of a general immunosuppressive milieu. We were unable to make comparisons between the suppressive activities of MDSCs and PMNs over time, since CD4+ T cells were isolated from the spleen of a different naive mouse at each time point. Biofilm-associated monocytes had no effect on T cell proliferation until day 28 postinfection (Fig. 2A), again likely as a consequence of exposure to a chronic anti-inflammatory milieu, whereas peripheral blood monocytes were not suppressive at any time point examined (Fig. 2B).
FIG 2.

CD11bhigh Ly6G+ Ly6C+ MDSCs inhibit T cell proliferation throughout the course of S. aureus orthopedic biofilm infection. CD11bhigh Ly6G+ Ly6C+ MDSCs, CD11blow Ly6G+ Ly6C+ PMNs, and Ly6G− Ly6C+ F4/80− monocytes were purified by FACS analysis from implant-associated tissue (A) and blood (B) at days 3, 7, 14, and 28 postinfection for T cell proliferation assays at a 1:1 ratio (T cells to MDSCs, PMNs, or monocytes). Results are expressed as percentages of proliferation with T cells only and CD3/CD28-stimulated T cells (+ Control) as controls. A sufficient number of MDSCs could not be recovered from blood for this assay (not sufficient [NS]). Results are combined from three independent experiments, with significant differences denoted by asterisks (*, P < 0.05; **, P < 0.01; ***, P < 0.001; ****, P < 0.0001 [by one-way ANOVA]).
Transcriptional profiling of leukocyte infiltrates reveals that MDSCs have a granulocytic phenotype during S. aureus biofilm infection.
We next compared gene expression profiles of MDSCs with those of both PMNs and monocytes recovered from S. aureus orthopedic biofilm infections to better understand the similarities and differences of MDSCs compared to their effector cell counterparts. RNA-Seq was performed on biofilm-associated MDSCs, PMNs, and monocytes by using the gating strategy shown in Fig. 1 at day 7 postinfection, which represents the point when biofilm establishment has occurred and also when MDSCs and PMNs are both suppressive (Fig. 2A). Overall, RNA-Seq revealed that 297 genes were significantly differentially expressed in MDSCs versus PMNs, whereas a much larger number of genes (6,466) was differentially regulated in MDSCs versus monocytes. The top and bottom 15 differentially expressed genes between MDSCs and PMNs (Tables 1 and 2, respectively) and between MDSCs and monocytes (Tables 3 and 4, respectively) are presented, and the complete data set can be found in the GEO database. From a global perspective, the transcriptional similarities between MDSCs and PMNs and divergence from monocytes support our previous work suggesting their phenotype as G-MDSCs instead of M-MDSCs (10–12), which was visualized by the use of a covariance matrix (Fig. 3). Although additional correlation values below 0.5 were statistically significant, these were at such a low abundance that they were not considered biologically relevant. The main objective of this analysis was to discern how these cell populations were similar to or different from one another in terms of their expression correlations, which was revealed by the covariance matrix (Fig. 3). A total of 4,367 genes were significantly differentially expressed between monocytes and PMNs; however, this comparison was not a focus of this study and is not discussed in detail, although the data set has been deposited in the GEO database.
TABLE 1.
Top 15 differentially expressed genes in MDSCs versus PMNs
| Genea | Log2 fold change | P value |
|---|---|---|
| Tgm1 | 2.713125 | 5.21E−05 |
| Cnnm2 | 2.644186 | 0.000267 |
| Tagap | 2.542028 | 1.15E−09 |
| Tinf2 | 2.514631 | 6.76E−07 |
| Egr1 | 2.466032 | 0.000133 |
| G0s2 | 2.272992 | 0.000360 |
| Nr4a3 | 2.259293 | 5.49E−08 |
| Cxcl10 | 2.161131 | 1.43E−05 |
| Crem | 2.159274 | 0.000289 |
| Lmnb1 | 2.109289 | 3.85E−06 |
| Hdc | 2.106989 | 2.93E−05 |
| F3 | 2.049423 | 0.000141 |
| Il1b | 2.030310 | 0.000927 |
| Il1r2 | 1.996854 | 0.000617 |
| Arg1 | 1.984264 | 7.32E−05 |
Tgm1, transglutaminase 1; Cnnm2, cyclin and CBS domain divalent metal cation transport mediator 2; Tagap, T cell activation Rho GTPase-activating protein; Tinf2, TERF1-interacting nuclear factor 2; Egr1, early growth response protein 1; G0s2, G0/G1 switch gene 2; Nr4a3, nuclear receptor subfamily 4 group A member 3; CXCL10, interferon-induced protein 10; Crem, cAMP-responsive element modulator; Lmnb1, laminin B1; Hdc, histidine decarboxylase; F3, tissue factor; IL-1b, interleukin-1β; IL-1r2, interleukin-1 receptor 2; Arg-1, arginase-1.
TABLE 2.
Bottom 15 differentially expressed genes in MDSCs versus PMNs
| Genea | Log2 fold change | P value |
|---|---|---|
| Itgb2l | −3.378811 | 0.003034 |
| Camp | −3.250741 | 0.009180 |
| Ngp | −3.172833 | 0.011159 |
| Adpgk | −3.166016 | 0.002688 |
| I830127L07Rik | −3.013401 | 0.006003 |
| Serpinb1a | −2.981732 | 0.006800 |
| Chil3 | −2.855865 | 0.017824 |
| Golim4 | −2.431940 | 0.006071 |
| Asb7 | −2.376581 | 0.007362 |
| Rflnb | −2.304874 | 0.015854 |
| Fmo5 | −2.114980 | 0.015252 |
| Mmp8 | −2.092519 | 0.020018 |
| Mlec | −1.904410 | 0.025731 |
| Megf9 | −1.868016 | 0.035768 |
| Abcd2 | −1.855372 | 0.027328 |
Itgb2l, integrin beta 2-like; Camp, cathelicidin antimicrobial peptide; Ngp, neutrophilic granule protein; Adpgk, ADP-dependent glucokinase; I830127L07Rik, mouse pseudogene; Serpinb1a, alpha 1-antitrypsin; Chil3, chitinase-like 3; Golim4, Golgi integral membrane protein 4; Asb7, ankyrin repeat- and SOCS box-containing 7; Rflnb, refilin B; Fmo5, flavin-containing monooxygenase 5; Mmp8, matrix metalloproteinase 8; Mlec, malectin; Megf9, multiple epidermal growth factor-like domains 9; Abcd2, ATP-binding cassette subfamily D member 2.
TABLE 3.
Top 15 differentially expressed genes in MDSCs versus monocytes
| Genea | Log2 fold change | P value |
|---|---|---|
| Gm5416 | 9.663465 | 9.35E−13 |
| Gm10052 | 9.431301 | 2.57E−07 |
| Asprv1 | 9.361362 | 2.75E−36 |
| Prok2 | 9.316446 | 5.63E−25 |
| Mrgpra2a | 9.296159 | 3.92E−34 |
| Gm10240 | 8.998541 | 0.014474 |
| Gm13370 | 8.998541 | 0.014474 |
| Rufy4 | 8.494619 | 1.59E−19 |
| Gm20425 | 8.440936 | 0.000506 |
| Mmp9 | 8.403597 | 1.42E−33 |
| G0s2 | 8.314337 | 4.00E−44 |
| Gm5526 | 8.170089 | 1.55E−10 |
| Stfa2l1 | 8.135118 | 4.48E−32 |
| Gm9992 | 7.896302 | 3.96E−07 |
| Ankrd33b | 7.866216 | 2.16E−52 |
Gm5416, predicted gene 5416; Gm10052, predicted gene 10052; Asprv1, aspartic peptidase, retroviral-like 1; Prok2, prokineticin 2; Mrgpra2a, Mas-related G-protein-coupled receptor member A2; Gm10240, predicted gene 10240; Gm13370, predicted gene 133370; Rufy4, RUN and FYVE domain-containing 4; Gm20425, predicted gene 20425; Mmp9, matrix metalloproteinase 9; G0s2, G0/G1 switch gene 2; Gm5526, predicted gene 5526; Stfa2l1, stefin A2-like 1; Gm9992, predicted gene 9992; Ankrd33b, ankyrin repeat domain 33B.
TABLE 4.
Bottom 15 differentially expressed genes in MDSCs versus monocytes
| Genea | Log2 fold change | P value |
|---|---|---|
| Nanp | −8.67336 | 2.26E−11 |
| Trbc2 | −8.33047 | 6.12E−22 |
| Ifng | −8.00481 | 3.76E−18 |
| Trbv13-2 | −7.77886 | 9.10E−08 |
| Cd7 | −7.73012 | 2.49E−24 |
| Il2rb | −7.60299 | 8.52E−44 |
| Trbv3 | −7.58556 | 2.87E−07 |
| Ctsw | −7.53901 | 1.02E−30 |
| Gm14288 | −7.53692 | 2.89E−07 |
| Mpo | −7.52577 | 2.03E−15 |
| Trbv13-1 | −7.4224 | 4.47E−06 |
| Ctsg | −7.41349 | 8.63E−26 |
| Nkg7 | −7.40104 | 7.29E−38 |
| Gm10039 | −7.37246 | 8.07E−06 |
| Gimap4 | −7.36843 | 1.18E−27 |
Nanp, N-acetylneuraminic acid phosphatase; Trbc2, T cell receptor beta constant 2; Ifng, interferon gamma; Trbv13-2, T cell receptor beta variable 13; Cd7, cluster of differentiation 7; Il2rb, interleukin-2 receptor beta; Trbv3, T cell receptor beta variable 3; Gm14288, predicted gene 14288; Mpo, myeloperoxidase; Trbv13-1, T cell receptor beta variable 13-1; Ctsg, cathepsin G; Nkg7, natural killer cell granule protein 7; Gm10039, predicted gene 10039; Gimap4, GTPase, IMAP family member 4.
FIG 3.

Cluster analysis reveals transcriptional similarities between MDSCs and PMNs. Pairwise Pearson correlation values were calculated between every pair of gene expression vectors for each sample. To prevent bias from outliers, the top and bottom 25% of genes were removed after scaling by average expression across samples. Correlation values over 0.5 are shown on the heat map, and samples are hierarchically clustered by distance, measured as 1 − correlation.
Of the genes significantly differentially expressed between MDSCs and PMNs, the expression levels of some genes important for cell cycle processes, such as G0s2 (G0/G1 switch gene 2) and early growth response protein 1 (Egr1), were increased in MDSCs (Table 1) (24). Importantly, the expression level of arginase-1 (Arg-1), a factor well characterized for its role in MDSC function, was increased in MDSCs compared to PMNs (Table 1). Arg-1 is involved in l-arginine metabolism and acts as a mechanism to dictate nutrient availability for other leukocyte populations (25). Specifically, Arg-1 competes with iNOS for l-arginine, regulating an important anti-inflammatory-versus-proinflammatory axis as well as T cell proliferation by depleting extracellular l-arginine required for T cell receptor (TCR) expression (25, 26). Other genes implicated in immune suppression or alteration of immune responses were also enriched in MDSCs compared to PMNs (Table 1). For example, Nr4a3 (Nor-1) is a transcription factor belonging to the nuclear hormone receptor superfamily whose expression has been shown to regulate inflammatory gene expression (27). The expression of another family member, Nr4a1 (Nur77), was also significantly increased in MDSCs but fell outside the top 15 differentially expressed genes.
Of the 297 differentially expressed genes in MDSCs versus PMNs, fewer showed significantly decreased expression (i.e., total of 22) (Table 2 and data not shown). Importantly, the expression levels of cathelicidin antimicrobial peptide (Camp) and neutrophil granule protein (Ngp), which are primary granule components in mature PMNs known to mediate the killing of a broad range of bacteria (28), were significantly reduced in MDSCs, supporting their immature phenotype (Table 2). The expression levels of other molecules involved in regulating enzymatic activity, including matrix metalloproteinase 8 (Mmp8) and a leukocyte elastase inhibitor (Serpinb2a), were also decreased in MDSCs (Table 2).
Although there were relatively few differentially expressed genes between MDSCs and PMNs, distinctions between these two cell types were evident in “cytokine signaling in immune system” and “signaling by interleukins,” as identified by the DAVID functional annotation tool (Fig. 4). These transcriptomic data highlight two important features of S. aureus biofilm-associated MDSCs. First, based on their similar transcriptional profile to that of PMNs, biofilm-associated MDSCs are of a granulocytic lineage and can be classified as G-MDSCs. Second, these MDSCs have reduced expression of granule components characteristic of mature effector cells concomitant with increased expression of genes that can circumvent immune responses normally capable of bacterial clearance, both of which are features of an immature, suppressive population.
FIG 4.

Pathway analysis of significantly differently expressed genes in MDSCs and PMNs. Differentially expressed genes between MDSCs and PMNs, as determined by a P value of <0.05, were used as a seed list for reactome pathway enrichment. The top 20 enrichments, as determined by their P values, are shown. The length of the bar corresponds to the number of overlapping genes in the enriched pathways.
In contrast to PMNs, the transcriptional profile of MDSCs versus monocytes was much more diverse, with over 6,000 genes differentially expressed, further supporting the finding that biofilm-associated MDSCs are more granulocytic than monocytic in nature (Table 3). Since many of the top 15 differentially expressed genes were predicted genes (i.e., Gm), we expanded our analysis beyond the top 15 hits. Interestingly, the levels of several proteins of the calcium-binding S100 family were increased in MDSCs compared to monocytes (i.e., S100A8, S100A2, and S100A7A). S100A8 is an inflammatory mediator released from myeloid cells in response to cell damage, infection, or inflammation and primarily functions as a danger signal (29). Furthermore, it has been shown that S100A8/A9 proteins not only induce MDSC expansion and promote migration but also are secreted by MDSCs to potentiate these activities (30). Additional evidence of biofilm-associated MDSCs regulating immune responses includes the increased expression of NF-κB inhibitor subunits (Nfkbid, Nfkbia, NFkbiz, and Nfkbib) compared to that in monocytes. These genes inhibit NF-κB signaling by masking nuclear localization signals or retaining NF-κB in the cytoplasm (31–33). The expression levels of Nr4a3 and Trem1 were also increased in MDSCs, similar to the MDSC-versus-PMN analysis. Finally, more C-type lectins were differentially expressed between MDSCs and monocytes than between MDSCs and PMNs. Among them, the expression levels of Clec4d, Clec4e, Clec7a, Clec1a, Siglecf, and Siglece were significantly increased in MDSCs.
A number of cell cycle-associated and granule enzyme genes were significantly differentially expressed in MDSCs versus monocytes (Fig. 5 and data not shown). In general, granule enzymes are more characteristic of mature myeloid populations, and their increased expression in monocytes and PMNs compared to MDSCs corroborates the immature phenotype of the latter. In addition, several inflammatory mediators were significantly induced in monocytes versus MDSCs (Table 4), which depicts the effector phenotype of monocytes in the context of bacterial infection.
FIG 5.

Pathway analysis of significantly differently expressed genes in MDSCs and monocytes. Differentially expressed genes between MDSCs and monocytes, as determined by a P value of <0.05, were used as a seed list for reactome pathway enrichment. The top 12 enrichments, as determined by their P values, are shown. The length of the bar corresponds to the number of overlapping genes in the enriched pathways. TGF-beta, transforming growth factor beta.
Evidence of leukocyte proliferation at the site of S. aureus orthopedic biofilm infection.
Based on the finding that leukocytes recovered from S. aureus biofilm-infected implants expressed several cell cycle-associated genes, the degree of cell proliferation was assessed in vivo by EdU labeling. This was also of interest because it is unknown whether the predominance of MDSCs in biofilms results from their active recruitment by chemokines and/or if these cells proliferate at the site of infection. The percentages of EdU-positive (EdU+) MDSCs, PMNs, and monocytes were determined from the total CD45+ leukocyte population after a single EdU injection at day 7 postinfection. This interval was selected to confirm the RNA-Seq findings that were analyzed at the same time point. All cell types demonstrated evidence of proliferation, as assessed by EdU incorporation (Fig. 6). Interestingly, nearly half of the total MDSC population was EdU+, whereas approximately 30% of PMNs had incorporated EdU within the 3-h labeling period, again supporting the distinction between the two cell types (Fig. 6). Interestingly, nearly all monocytes at the site of S. aureus orthopedic biofilm infection were proliferative at day 7 (Fig. 6); however, this population constitutes only 5% to 7% of the total CD45+ leukocyte infiltrate during infection and is dramatically outnumbered by MDSCs and PMNs. Importantly, EdU staining was negligible in cells from the blood and bone marrow of infected animals (data not shown). This indicates that the proliferation of MDSCs, PMNs, and monocytes is unique to the site of S. aureus biofilm infection and does not result from the influx of blood or bone marrow progenitor cells into implant-associated tissue.
FIG 6.
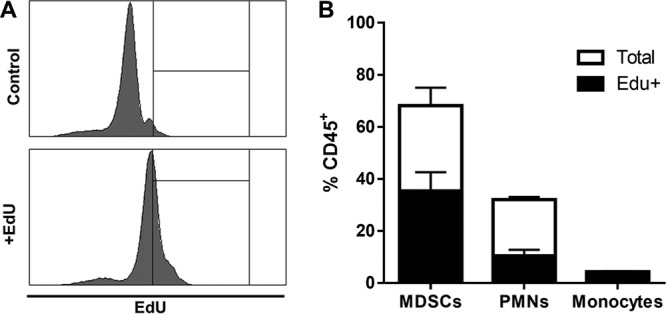
Local leukocyte proliferation is evident at the site of S. aureus orthopedic biofilm infection. Mice received one injection of 2.5 µg EdU at day 7 postinfection, whereupon animals were sacrificed 3 h later for measurement of EdU incorporation by flow cytometry. Shown are representative histograms for CD45+ cells from control and EdU-injected mice at day 7 (A) and quantification of the percentages of MDSCs, PMNs, and monocytes with EdU incorporation out of the total percentage of the CD45+ infiltrate (B). Results are combined from three independent experiments.
DISCUSSION
It is well known that S. aureus produces several molecules that inhibit PMN functions, such as recruitment and phagocytosis (34). Indeed, our laboratory has reported minor contributions of PMNs to the immune response during S. aureus biofilm infection, suggesting that biofilms also circumvent significant PMN recruitment by a currently unknown mechanism(s) (11, 12, 35). Rather, MDSCs are beginning to be recognized as an important player in the pathogenesis of several types of S. aureus infection, including biofilms (10–12, 20–23). Whereas PMNs are classically identified as highly differentiated cells specialized for defense against bacterial infection, MDSCs are a heterogeneous population of immature myeloid cells with suppressive immunoregulatory properties that allow S. aureus biofilm persistence (10–12). Recently, gene expression profiling of MDSCs and PMNs has been performed to discriminate between these cell types, but this has been limited to the context of cancer, comparing splenic MDSCs to tumor-associated neutrophils (TANs) or splenic MDSCs to tumor-associated MDSCs (36, 37). To date, no studies have examined the relationship between MDSCs and PMNs during S. aureus infection, which was the focus of this study. Our transcriptional profiling approach revealed a much smaller number of differentially expressed genes between MDSCs and PMNs than in previous tumor studies (36, 37). However, this could be due to differences in disease models (i.e., infection versus tumor) or the fact that cells from two distinct compartments were compared in the context of tumors (i.e., spleen versus tumor), whereas our study recovered leukocytes from the same tissue site. In addition, RNA-Seq was performed only on biofilm-associated MDSCs and PMNs at day 7 postinfection. More-dramatic differences in transcriptional profiles may be evident at other time points; however, this was beyond the scope of the present study.
The immune response during S. aureus orthopedic biofilm infection is highly localized to implant-associated tissues and does not elicit detectable systemic inflammation. Indeed, MDSCs isolated from the spleens of S. aureus-infected animals do not suppress T cell proliferation (12), and we show here that MDSCs are not prominent in the peripheral blood during biofilm infection in the mouse, which differs from many tumor models (9). Therefore, the differences between cell types reported in the present study are likely a result of mediators present in the biofilm milieu, the identities of which remain to be determined. Our data show that CD11bhigh Ly6G+ Ly6C+ MDSCs are the predominant CD45+ leukocyte population in S. aureus biofilm-infected tissues. These cells have a heterogeneous nuclear morphology and are able to suppress T cell proliferation throughout the course of S. aureus biofilm infection. Our finding that biofilm-associated MDSCs were CD11bhigh differs from a previous report where tumor-infiltrating MDSCs were defined as CD11blow (37). Many phenotypes and functions of MDSCs are context dependent (3, 9); therefore, it is not unexpected that MDSC surface marker expression would differ slightly between tumors and S. aureus biofilms. MDSCs have also been reported in other S. aureus infection models, including sepsis and abscesses, and while those studies used CD11b to identify MDSCs, they have not been defined as having high or low CD11b expression (20, 21). The similarities between G-MDSCs and PMNs emphasize the need to study MDSCs in a comprehensive manner to understand their functions in distinct biological settings. In contrast to MDSCs, CD11blow Ly6G+ Ly6C+ PMNs do not acquire T cell-suppressive activity until biofilm formation has occurred (i.e., day 7), which agrees with our previous work demonstrating that monocyte/macrophage anti-inflammatory activity also manifests at this interval (10–12), reflective of a general immunosuppressive milieu. Defining the degree of plasticity and transition of G-MDSCs to PMNs in vivo is an area of extreme interest; however, a fate-mapping approach that would reliably differentiate between the two cell types does not currently exist.
The finding that transcriptional profiles of biofilm-associated MDSCs and PMNs were very similar (i.e., only 297 differentially expressed genes) provided evidence supporting the granulocytic nature of MDSCs (i.e., G-MDSCs) as opposed to M-MDSCs. This is in agreement with what is observed during human prosthetic joint infection, where significant increases in the numbers of G-MDSCs are observed compared to aseptic revisions (38). Further evidence of the functional importance of MDSCs compared to PMNs was demonstrated in our previous study, where treatment of mice with a Ly6G antibody, which depletes both MDSCs and PMNs, led to significant reductions in biofilm burdens (12). This was attributed to less immune inhibition of monocytes/macrophages by MDSCs, since treatment with a Gr-1 antibody, which depletes MDSCs, PMNs, as well as effector monocytes, caused significant increases in biofilm burdens. Collectively, these studies demonstrate that although PMNs are associated with S. aureus biofilm infections, their functional role is not yet understood.
One question that remains is identifying the signal(s) that leads to the preferential accumulation of MDSCs during S. aureus biofilm infection. One likely mechanism is via MDSC-targeted chemokines. Indeed, the transcriptomic data in this study revealed that the major differences between MDSCs and PMNs were in the categories of cytokine signaling and, more specifically, signaling by interleukins. However, our EdU data also suggest that cellular proliferation at the site of infection may also play a role. Remarkably, EdU labeling revealed that approximately 50% of MDSCs associated with biofilms at day 7 postinfection arise from local division. The mediators responsible for this are not known; however, the levels of several factors implicated in MDSC expansion are elevated in the biofilm milieu, including granulocyte colony-stimulating factor (G-CSF), IL-6, and vascular endothelial growth factor (VEGF) (12, 38). Interestingly, a mature F4/80+ macrophage population is limited during S. aureus orthopedic biofilm infection, even though monocytes display significantly increased expression levels of several cell cycle genes and are dividing at the site of infection, as shown by EdU labeling. This could indicate that the monocyte population is overwhelmed by the biofilm and, although dividing, simply cannot sustain the bacterial load and immunosuppressive milieu dominated by MDSCs. This is supported by our previous work that revealed an important role for biofilm-derived toxins (i.e., leukocidin A/B and alpha-toxin) in mediating macrophage depletion at the infection site (39).
The role of MDSCs during S. aureus biofilm infection is only beginning to be understood, and a more thorough means to differentiate these cells from their mature effector counterparts is critical. By demonstrating that MDSCs express higher levels of the integrin receptor CD11b than PMNs, we have established that both cell types share a granulocytic phenotype and yet have a number of genes significantly differentially expressed between them. Further studies to elucidate the mechanisms by which MDSCs alter the immune response during biofilm infection may lead to novel immune-mediated approaches to treat these chronic infections.
MATERIALS AND METHODS
Mice.
Equal numbers of male and female C57BL/6 mice (8 weeks old) were used throughout this study and were purchased from Charles River Laboratories (Wilmington, MA). This study was conducted in strict accordance with the recommendations in the Guide for the Care and Use of Laboratory Animals of the U.S. National Institutes of Health (40). The animal use protocol was approved by the Institutional Animal Care and Use Committee of the University of Nebraska Medical Center (approval number 09-049-06).
Mouse model of S. aureus orthopedic implant biofilm infection.
To model infectious complications in patients following arthroplasty, a mouse model of S. aureus orthopedic implant biofilm infection was used as previously described (10–12). Briefly, an orthopedic-grade K-wire (0.6-mm diameter, nitinol nickel-titanium; Custom Wire Technologies, Port Washington, WI, USA) was inserted into the intramedullary canal of the femur, and a total of 1,000 CFU of S. aureus USA300 LAC 13C was inoculated at the implant tip (41). For pain relief, animals received buprenorphine (Buprenex; Reckitt Benckiser Health Care, Hull, North Humberside, United Kingdom) (0.1 mg/kg of body weight subcutaneously [s.c.]) immediately after infection and 24 h later. After this interval, mice exhibited normal ambulation and no discernible pain behaviors. For antibiotic experiments, mice received a combination of rifampin (25 mg/kg) and daptomycin (5 mg/kg) intraperitoneally (i.p.) once daily, beginning at day 3 or 7 postinfection and continuing for 1 week.
Flow cytometry.
To characterize leukocytes associated with soft tissue surrounding the knee joint of S. aureus-infected implants, tissues were excised, dissociated by using the blunt end of a plunger from a 3-ml syringe, and passed through the 35-µm filter of a 5-ml snap cap fluorescence-activated cell sorter (FACS) tube (BD Biosciences, San Diego, CA). The resulting filtrate was washed with 1× phosphate-buffered saline (PBS), and cells were collected by centrifugation (300 × g for 5 min). Blood was collected via cardiac puncture following euthanasia. For all samples, red blood cells (RBCs) were lysed by using RBC lysis buffer (BioLegend, San Diego, CA). After lysis, tissue and blood leukocytes were incubated with TruStain fcX (BioLegend) to minimize nonspecific Ab binding. Cells were then stained with CD11b-fluorescein isothiocyanate (FITC), CD45-allophycocyanin (APC), Ly6G-phycoerythrin (PE), Ly6C-peridinin chlorophyll protein (PerCP)-Cy5.5, and F4/80-PE-Cy7 (BioLegend and BD Biosciences, San Diego, CA). Dead cells were excluded by using a Live/Dead fixable blue dead cell stain kit (Invitrogen, Eugene, OR) according to the manufacturer’s instructions. Analysis was performed by using BD FACSDiva software, where single cells were gated from the total events using forward scatter-area (FSC-A) versus forward scatter-height (FSC-H), followed by the exclusion of dead cells. Results are presented as percentages of live, CD45+ leukocytes.
Morphological analysis.
To further characterize CD11bhigh Ly6G+ Ly6C+ MDSCs, CD11blow Ly6G+ Ly6C+ PMNs, and Ly6G− Ly6C+ monocytes, populations from infected tissues (MDSCs, PMNs, and monocytes) or peripheral blood (PMNs and monocytes) were adhered to glass slides by cytocentrifugation (Cytopro; Wescor, Logan, UT) and stained with Wright-Giemsa stain according to the manufacturer’s instructions (ThermoFisher Scientific, Kalamazoo, MI). Images were obtained by using a Ventana iScan HT high-throughput bright-field scanner and analyzed with Ventana Image Viewer (Ventana Medical Systems, Inc., Tucson, AZ).
Polyclonal T cell proliferation assays.
To determine the suppressive capacities of MDSCs, PMNs, and monocytes recovered from S. aureus orthopedic implant infections compared to peripheral blood, T cell proliferation assays were performed as previously described (10–12). Briefly, leukocytes were collected from the soft tissue surrounding the infected knee joint (MDSCs, PMNs, and monocytes) or blood (PMNs and monocytes) by FACS analysis at days 3, 7, 14, and 28, as described above. CD4+ T cells were isolated from the spleens of naive mice by using a CD4+ T cell isolation kit (Miltenyi Biotec, Auburn, CA) and immediately labeled with eFluor 670 cell proliferation dye (eBioscience, ThermoFisher), according to the manufacturer’s instructions. Labeled CD4+ T cells were plated at 105 cells/well in a 96-well round-bottom plate in RPMI 1640 medium supplemented with 10% fetal bovine serum (FBS) and 100 ng/ml IL-2 (Invitrogen, Frederick, MD). FACS-purified CD11bhigh Ly6G+ Ly6C+ MDSCs, CD11blow Ly6G+ Ly6C+ PMNs, or Ly6G− Ly6C+ monocytes were added at 1:1 ratios to CD4+ T cells subjected to polyclonal stimulation with CD3/CD28 Dynabeads (Life Technologies, Oslo, Norway), since TCR immunodominant epitopes for S. aureus are not defined. Cells were incubated for 72 h, whereupon the extent of T cell proliferation was determined by flow cytometry.
Assessment of leukocyte proliferation in vivo.
To assess the proliferative capacities of MDSC, PMN, and monocyte populations at the site of S. aureus orthopedic biofilm infection compared to the blood and bone marrow, mice received a single i.p. injection of 2.5 mg EdU (Invitrogen) at day 7 postinfection. Mice were sacrificed 3 h following EdU injection, and the amount of EdU incorporation was measured by using a PacificBlue Click-iT Plus EdU flow cytometry assay kit (Invitrogen), according to the manufacturer’s protocol, in combination with the antibody panel described above. Results were analyzed by using BD FACSDiva software.
RNA sequencing. (i) Cell recovery and RNA isolation.
At day 7 postinfection, cells were isolated from S. aureus-infected implant-associated tissue and stained for FACS analysis as described above. CD11bhigh Ly6G+ Ly6C+ MDSCs, CD11blow Ly6G+ Ly6C+ PMNs, and Ly6G− Ly6C+ monocytes were purified by FACS analysis from the total live, CD45+ population, and RNA was isolated from each cell type by using an RNeasy microkit (Qiagen, Germantown, MD) according to the manufacturer’s instructions. Totals of four MDSC, three PMN, and three monocyte samples were obtained from independent biofilm infection experiments for RNA-Seq analysis.
(ii) NGS library preparation.
RNA sequencing libraries were prepared with 250 ng of total RNA by using a ScriptSeq complete kit—low-input protocol (Illumina, San Diego, CA). The RNA-Seq libraries were denatured with 0.2 N NaOH, and 1.2 pM of each library was sequenced on a NextSeq500 instrument (Illumina, San Diego, CA). The libraries were subjected to 75-bp paired-end sequencing at a depth of 20 million paired reads per sample.
(iii) Differential expression.
The Illumina reads were checked for quality and subsequently trimmed. The resulting paired fastq files were sorted and mapped against the Ensembl GRCm38.p5 primary-assembly cDNA library by using Salmon (42) with Quasi indexing and default parameters. Nonalignment methods, such as Salmon, allow accurate isoform-level differential expression determination with gene counts comparable to those of alignment methods. Isoform counts were summed to gene counts by using mapping information from the same Ensembl library. The Ensembl 91 application program interface (API) was used to convert Ensembl mouse identifications to gene symbols. DESeq2 was used to determine differential expression between conditions, since it corrects small dispersion estimates and controls the false discovery rate (FDR) given our limited sample size (43). We used the FDR P value correction estimates provided by the Wald test of DESeq2 to determine significantly differentially expressed genes between each combination of MDSCs, PMNs, and monocytes. Genes with a P value of <0.05 were considered differentially expressed.
(iv) Gene list enrichment.
Differentially expressed gene lists underwent enrichment via the DAVID functional annotation tool (44). DAVID uses the hypergeometric function or Fisher’s exact test to generate independent P values for annotation terms and construct functional annotation categories based on enrichment hits. We used available mouse gene symbols converted from the Ensembl GRCm38.p5 primary-assembly cDNA library as a background for the analysis. Annotation terms with an FDR-adjusted P value of <0.05 were considered significant.
Statistics.
Significant differences between groups for flow cytometry analysis, T cell proliferation assays, and EdU incorporation studies were determined by using unpaired two-tailed Student’s t test or one-way analysis of variance (ANOVA) with Bonferroni’s multiple-comparison post hoc analysis using GraphPad Prism version 6 (GraphPad, La Jolla, CA). A P value of <0.05 was considered statistically significant.
Accession number(s).
The RNA-Seq data generated have been deposited in the GEO database (accession number GSE118796).
Supplementary Material
ACKNOWLEDGMENTS
This work was supported by NIH National Institute of Allergy and Infectious Diseases (NIAID) grant 2P01AI083211 (project 4 to T.K.). The University of Nebraska DNA Sequencing Core receives partial support from the National Institute for General Medical Science (NIGMS) (INBRE-P20GM103427-14 and COBRE-1P30GM110768-01) as well as a support grant from The Fred and Pamela Buffett Cancer Center (P30CA036727).
The contents of this publication are the sole responsibility of the authors and do not necessarily represent the official views of the NIH or NIGMS.
We thank Rachel Fallet for managing the mouse colony and Craig Semerad, Victoria Smith, and Samantha Wall in the UNMC Flow Cytometry Core Facility for assistance with FACS analysis.
Footnotes
Supplemental material for this article may be found at https://doi.org/10.1128/IAI.00684-18.
REFERENCES
- 1.Haile LA, Greten TF, Korangy F. 2012. Immune suppression: the hallmark of myeloid derived suppressor cells. Immunol Invest 41:581–594. doi: 10.3109/08820139.2012.680635. [DOI] [PMC free article] [PubMed] [Google Scholar]
- 2.Serafini P, Borrello I, Bronte V. 2006. Myeloid suppressor cells in cancer: recruitment, phenotype, properties, and mechanisms of immune suppression. Semin Cancer Biol 16:53–65. doi: 10.1016/j.semcancer.2005.07.005. [DOI] [PubMed] [Google Scholar]
- 3.Condamine T, Gabrilovich DI. 2011. Molecular mechanisms regulating myeloid-derived suppressor cell differentiation and function. Trends Immunol 32:19–25. doi: 10.1016/j.it.2010.10.002. [DOI] [PMC free article] [PubMed] [Google Scholar]
- 4.Zhang C, Lei GS, Shao S, Jung HW, Durant PJ, Lee CH. 2012. Accumulation of myeloid-derived suppressor cells in the lungs during Pneumocystis pneumonia. Infect Immun 80:3634–3641. doi: 10.1128/IAI.00668-12. [DOI] [PMC free article] [PubMed] [Google Scholar]
- 5.Delano MJ, Scumpia PO, Weinstein JS, Coco D, Nagaraj S, Kelly-Scumpia KM, O’Malley KA, Wynn JL, Antonenko S, Al-Quran SZ, Swan R, Chung CS, Atkinson MA, Ramphal R, Gabrilovich DI, Reeves WH, Ayala A, Phillips J, Laface D, Heyworth PG, Clare-Salzler M, Moldawer LL. 2007. MyD88-dependent expansion of an immature GR-1(+)CD11b(+) population induces T cell suppression and Th2 polarization in sepsis. J Exp Med 204:1463–1474. doi: 10.1084/jem.20062602. [DOI] [PMC free article] [PubMed] [Google Scholar]
- 6.Hammami A, Abidin BM, Charpentier T, Fabie A, Duguay AP, Heinonen KM, Stager S. 2017. HIF-1alpha is a key regulator in potentiating suppressor activity and limiting the microbicidal capacity of MDSC-like cells during visceral leishmaniasis. PLoS Pathog 13:e1006616. doi: 10.1371/journal.ppat.1006616. [DOI] [PMC free article] [PubMed] [Google Scholar]
- 7.Medina E, Hartl D. 26 June 2018. Myeloid-derived suppressor cells in infection: a general overview. J Innate Immun doi: 10.1159/000489830. [DOI] [PMC free article] [PubMed] [Google Scholar]
- 8.Lai D, Qin C, Shu Q. 2014. Myeloid-derived suppressor cells in sepsis. Biomed Res Int 2014:598654. doi: 10.1155/2014/598654. [DOI] [PMC free article] [PubMed] [Google Scholar]
- 9.Tcyganov E, Mastio J, Chen E, Gabrilovich DI. 2018. Plasticity of myeloid-derived suppressor cells in cancer. Curr Opin Immunol 51:76–82. doi: 10.1016/j.coi.2018.03.009. [DOI] [PMC free article] [PubMed] [Google Scholar]
- 10.Heim CE, Vidlak D, Kielian T. 2015. Interleukin-10 production by myeloid-derived suppressor cells contributes to bacterial persistence during Staphylococcus aureus orthopedic biofilm infection. J Leukoc Biol 98:1003–1013. doi: 10.1189/jlb.4VMA0315-125RR. [DOI] [PMC free article] [PubMed] [Google Scholar]
- 11.Heim CE, Vidlak D, Scherr TD, Hartman CW, Garvin KL, Kielian T. 2015. IL-12 promotes myeloid-derived suppressor cell recruitment and bacterial persistence during Staphylococcus aureus orthopedic implant infection. J Immunol 194:3861–3872. doi: 10.4049/jimmunol.1402689. [DOI] [PMC free article] [PubMed] [Google Scholar]
- 12.Heim CE, Vidlak D, Scherr TD, Kozel JA, Holzapfel M, Muirhead DE, Kielian T. 2014. Myeloid-derived suppressor cells contribute to Staphylococcus aureus orthopedic biofilm infection. J Immunol 192:3778–3792. doi: 10.4049/jimmunol.1303408. [DOI] [PMC free article] [PubMed] [Google Scholar]
- 13.Scherr TD, Heim CE, Morrison JM, Kielian T. 2014. Hiding in plain sight: interplay between staphylococcal biofilms and host immunity. Front Immunol 5:37. doi: 10.3389/fimmu.2014.00037. [DOI] [PMC free article] [PubMed] [Google Scholar]
- 14.Bronte V, Brandau S, Chen SH, Colombo MP, Frey AB, Greten TF, Mandruzzato S, Murray PJ, Ochoa A, Ostrand-Rosenberg S, Rodriguez PC, Sica A, Umansky V, Vonderheide RH, Gabrilovich DI. 2016. Recommendations for myeloid-derived suppressor cell nomenclature and characterization standards. Nat Commun 7:12150. doi: 10.1038/ncomms12150. [DOI] [PMC free article] [PubMed] [Google Scholar]
- 15.Fleming TJ, Fleming ML, Malek TR. 1993. Selective expression of Ly-6G on myeloid lineage cells in mouse bone marrow RB6-8C5 mAb to granulocyte-differentiation antigen (Gr-1) detects members of the Ly-6 family. J Immunol 151:2399–2408. [PubMed] [Google Scholar]
- 16.Dai J, El Gazzar M, Li GY, Moorman JP, Yao ZQ. 2015. Myeloid-derived suppressor cells: paradoxical roles in infection and immunity. J Innate Immun 7:116–126. doi: 10.1159/000368233. [DOI] [PMC free article] [PubMed] [Google Scholar]
- 17.Talmadge JE, Gabrilovich DI. 2013. History of myeloid-derived suppressor cells. Nat Rev Cancer 13:739–752. doi: 10.1038/nrc3581. [DOI] [PMC free article] [PubMed] [Google Scholar]
- 18.Corzo CA, Cotter MJ, Cheng P, Cheng F, Kusmartsev S, Sotomayor E, Padhya T, McCaffrey TV, McCaffrey JC, Gabrilovich DI. 2009. Mechanism regulating reactive oxygen species in tumor-induced myeloid-derived suppressor cells. J Immunol 182:5693–5701. doi: 10.4049/jimmunol.0900092. [DOI] [PMC free article] [PubMed] [Google Scholar]
- 19.Raber PL, Thevenot P, Sierra R, Wyczechowska D, Halle D, Ramirez ME, Ochoa AC, Fletcher M, Velasco C, Wilk A, Reiss K, Rodriguez PC. 2014. Subpopulations of myeloid-derived suppressor cells impair T cell responses through independent nitric oxide-related pathways. Int J Cancer 134:2853–2864. doi: 10.1002/ijc.28622. [DOI] [PMC free article] [PubMed] [Google Scholar]
- 20.Tebartz C, Horst SA, Sparwasser T, Huehn J, Beineke A, Peters G, Medina E. 2015. A major role for myeloid-derived suppressor cells and a minor role for regulatory T cells in immunosuppression during Staphylococcus aureus infection. J Immunol 194:1100–1111. doi: 10.4049/jimmunol.1400196. [DOI] [PubMed] [Google Scholar]
- 21.Skabytska Y, Wolbing F, Gunther C, Koberle M, Kaesler S, Chen KM, Guenova E, Demircioglu D, Kempf WE, Volz T, Rammensee HG, Schaller M, Rocken M, Gotz F, Biedermann T. 2014. Cutaneous innate immune sensing of Toll-like receptor 2-6 ligands suppresses T cell immunity by inducing myeloid-derived suppressor cells. Immunity 41:762–775. doi: 10.1016/j.immuni.2014.10.009. [DOI] [PubMed] [Google Scholar]
- 22.Ledo C, Gonzalez CD, Poncini CV, Mollerach M, Gomez MI. 2018. TNFR1 signaling contributes to T cell anergy during Staphylococcus aureus sepsis. Front Cell Infect Microbiol 8:259. doi: 10.3389/fcimb.2018.00259. [DOI] [PMC free article] [PubMed] [Google Scholar]
- 23.Szabo PA, Goswami A, Memarnejadian A, Mallett CL, Foster PJ, McCormick JK, Haeryfar SM. 2016. Swift intrahepatic accumulation of granulocytic myeloid-derived suppressor cells in a humanized mouse model of toxic shock syndrome. J Infect Dis 213:1990–1995. doi: 10.1093/infdis/jiw050. [DOI] [PMC free article] [PubMed] [Google Scholar]
- 24.Yamada T, Park CS, Lacorazza HD. 2013. Genetic control of quiescence in hematopoietic stem cells. Cell Cycle 12:2376–2383. doi: 10.4161/cc.25416. [DOI] [PMC free article] [PubMed] [Google Scholar]
- 25.Rath M, Muller I, Kropf P, Closs EI, Munder M. 2014. Metabolism via arginase or nitric oxide synthase: two competing arginine pathways in macrophages. Front Immunol 5:532. doi: 10.3389/fimmu.2014.00532. [DOI] [PMC free article] [PubMed] [Google Scholar]
- 26.Rodriguez PC, Quiceno DG, Ochoa AC. 2007. l-Arginine availability regulates T-lymphocyte cell-cycle progression. Blood 109:1568–1573. doi: 10.1182/blood-2006-06-031856. [DOI] [PMC free article] [PubMed] [Google Scholar]
- 27.Zhao Y, Howatt DA, Gizard F, Nomiyama T, Findeisen HM, Heywood EB, Jones KL, Conneely OM, Daugherty A, Bruemmer D. 2010. Deficiency of the NR4A orphan nuclear receptor NOR1 decreases monocyte adhesion and atherosclerosis. Circ Res 107:501–511. doi: 10.1161/CIRCRESAHA.110.222083. [DOI] [PMC free article] [PubMed] [Google Scholar]
- 28.Kosciuczuk EM, Lisowski P, Jarczak J, Strzalkowska N, Jozwik A, Horbanczuk J, Krzyzewski J, Zwierzchowski L, Bagnicka E. 2012. Cathelicidins: family of antimicrobial peptides. A review. Mol Biol Rep 39:10957–10970. doi: 10.1007/s11033-012-1997-x. [DOI] [PMC free article] [PubMed] [Google Scholar]
- 29.Ryckman C, Vandal K, Rouleau P, Talbot M, Tessier PA. 2003. Proinflammatory activities of S100: proteins S100A8, S100A9, and S100A8/A9 induce neutrophil chemotaxis and adhesion. J Immunol 170:3233–3242. doi: 10.4049/jimmunol.170.6.3233. [DOI] [PubMed] [Google Scholar]
- 30.Sinha P, Okoro C, Foell D, Freeze HH, Ostrand-Rosenberg S, Srikrishna G. 2008. Proinflammatory S100 proteins regulate the accumulation of myeloid-derived suppressor cells. J Immunol 181:4666–4675. doi: 10.4049/jimmunol.181.7.4666. [DOI] [PMC free article] [PubMed] [Google Scholar]
- 31.Kuwata H, Matsumoto M, Atarashi K, Morishita H, Hirotani T, Koga R, Takeda K. 2006. IkappaBNS inhibits induction of a subset of Toll-like receptor-dependent genes and limits inflammation. Immunity 24:41–51. doi: 10.1016/j.immuni.2005.11.004. [DOI] [PubMed] [Google Scholar]
- 32.Yamazaki S, Muta T, Takeshige K. 2001. A novel IkappaB protein, IkappaB-zeta, induced by proinflammatory stimuli, negatively regulates nuclear factor-kappaB in the nuclei. J Biol Chem 276:27657–27662. doi: 10.1074/jbc.M103426200. [DOI] [PubMed] [Google Scholar]
- 33.Schuster M, Annemann M, Plaza-Sirvent C, Schmitz I. 2013. Atypical IkappaB proteins—nuclear modulators of NF-kappaB signaling. Cell Commun Signal 11:23. doi: 10.1186/1478-811X-11-23. [DOI] [PMC free article] [PubMed] [Google Scholar]
- 34.McGuinness WA, Kobayashi SD, DeLeo FR. 2016. Evasion of neutrophil killing by Staphylococcus aureus. Pathogens 5:E32. doi: 10.3390/pathogens5010032. [DOI] [PMC free article] [PubMed] [Google Scholar]
- 35.Hanke ML, Heim CE, Angle A, Sanderson SD, Kielian T. 2013. Targeting macrophage activation for the prevention and treatment of Staphylococcus aureus biofilm infections. J Immunol 190:2159–2168. doi: 10.4049/jimmunol.1202348. [DOI] [PMC free article] [PubMed] [Google Scholar]
- 36.Fridlender ZG, Sun J, Mishalian I, Singhal S, Cheng G, Kapoor V, Horng W, Fridlender G, Bayuh R, Worthen GS, Albelda SM. 2012. Transcriptomic analysis comparing tumor-associated neutrophils with granulocytic myeloid-derived suppressor cells and normal neutrophils. PLoS One 7:e31524. doi: 10.1371/journal.pone.0031524. [DOI] [PMC free article] [PubMed] [Google Scholar]
- 37.Youn JI, Collazo M, Shalova IN, Biswas SK, Gabrilovich DI. 2012. Characterization of the nature of granulocytic myeloid-derived suppressor cells in tumor-bearing mice. J Leukoc Biol 91:167–181. doi: 10.1189/jlb.0311177. [DOI] [PMC free article] [PubMed] [Google Scholar]
- 38.Heim CE, Vidlak D, Odvody J, Hartman CW, Garvin KL, Kielian T. 2018. Human prosthetic joint infections are associated with myeloid-derived suppressor cells (MDSCs): implications for infection persistence. J Orthop Res 36:1605–1613. doi: 10.1002/jor.23806. [DOI] [PMC free article] [PubMed] [Google Scholar]
- 39.Scherr TD, Hanke ML, Huang O, James DB, Horswill AR, Bayles KW, Fey PD, Torres VJ, Kielian T. 2015. Staphylococcus aureus biofilms induce macrophage dysfunction through leukocidin AB and alpha-toxin. mBio 6:e01021-15. doi: 10.1128/mBio.01021-15. [DOI] [PMC free article] [PubMed] [Google Scholar]
- 40.National Research Council. 2011. Guide for the care and use of laboratory animals, 8th ed National Academies Press, Washington, DC. [Google Scholar]
- 41.Thurlow LR, Hanke ML, Fritz T, Angle A, Aldrich A, Williams SH, Engebretsen IL, Bayles KW, Horswill AR, Kielian T. 2011. Staphylococcus aureus biofilms prevent macrophage phagocytosis and attenuate inflammation in vivo. J Immunol 186:6585–6596. doi: 10.4049/jimmunol.1002794. [DOI] [PMC free article] [PubMed] [Google Scholar]
- 42.Patro R, Duggal G, Love MI, Irizarry RA, Kingsford C. 2017. Salmon provides fast and bias-aware quantification of transcript expression. Nat Methods 14:417–419. doi: 10.1038/nmeth.4197. [DOI] [PMC free article] [PubMed] [Google Scholar]
- 43.Love MI, Huber W, Anders S. 2014. Moderated estimation of fold change and dispersion for RNA-seq data with DESeq2. Genome Biol 15:550. doi: 10.1186/s13059-014-0550-8. [DOI] [PMC free article] [PubMed] [Google Scholar]
- 44.Huang DW, Sherman BT, Tan Q, Kir J, Liu D, Bryant D, Guo Y, Stephens R, Baseler MW, Lane HC, Lempicki RA. 2007. DAVID bioinformatics resources: expanded annotation database and novel algorithms to better extract biology from large gene lists. Nucleic Acids Res 35:W169–W175. doi: 10.1093/nar/gkm415. [DOI] [PMC free article] [PubMed] [Google Scholar]
Associated Data
This section collects any data citations, data availability statements, or supplementary materials included in this article.