Abstract
Post-mitotic, differentiated cells exhibit a variety of characteristics that contrast with those of actively growing neoplastic cells, such as the expression of cell-cycle inhibitors and differentiation factors. We hypothesized that the gene expression profiles of these differentiated cells could reveal the identities of genes that may function as tumour suppressors. Here we show, using in vitro and in vivo studies in mice and humans, that the mitochondrial protein LACTB potently inhibits the proliferation of breast cancer cells. Its mechanism of action involves alteration of mitochondrial lipid metabolism and differentiation of breast cancer cells. This is achieved, at least in part, through reduction of the levels of mitochondrial phosphatidylserine decarboxylase, which is involved in the synthesis of mitochondrial phosphatidylethanolamine. These observations uncover a novel mitochondrial tumour suppressor and demonstrate a connection between mitochondrial lipid metabolism and the differentiation program of breast cancer cells, thereby revealing a previously undescribed mechanism of tumour suppression.
There are more than 200 different types of cancer, affecting various parts of the body. Cancer can arise in almost any organ and from any cell type in the body. While the incidence of certain cancers, such as those of the breast, lung and colon, is high, one seldom hears about a diagnosis of heart cancer, skeletal muscle cancer or brain cancer arising from neuronal cells1. Surprisingly, these types of cancer are extremely rare or, in some cases, non-existent. This indicates that some tissue types, and/or a specific subset of cells within these tissues, may already have ways of countering neoplasia, and as such, could provide us with insights into the prevention and/or treatment of cancer. A characteristic of these ‘cancer-resistant’ cell types (for example, adult myocytes and cardiomyocytes) is that they are non-proliferative, terminally differentiated2,3, and preferentially use oxidative phosphorylation over glycolysis as their main pathway for energy production. These biological and biochemical characteristics are in contrast to those of cancer cells, which are proliferative and relatively undifferentiated, and prefer glycolysis to oxidative phosphorylation as their primary mode of ATP generation. This led us to hypothesize that factors that induce or maintain cancer-resistant cells in a non-proliferative, differentiated state that uses oxidative phosphorylation, could have the characteristics of tumour suppressors if expressed in a neoplastic setting. As such, the gene expression profiles of these cells could serve as a source of new tumour suppressors, enabling us to uncover previously undescribed dependencies and vulnerabilities of cancer cells. Here we use the gene expression profiles of differentiated muscle cells of mice and humans to identify a tumour suppressor, LACTB, that can be found in mitochondria and negatively affects the growth of a variety of tumour cells in vivo and in vitro while having a minimal effect on non-tumorigenic cells. The mechanism of action of this tumour suppressor involves, in part, alterations in mitochondrial lipid metabolism, which are accompanied by differentiation of cancer cells and loss of tumorigenicity.
Identification of LACTB as a tumour suppressor
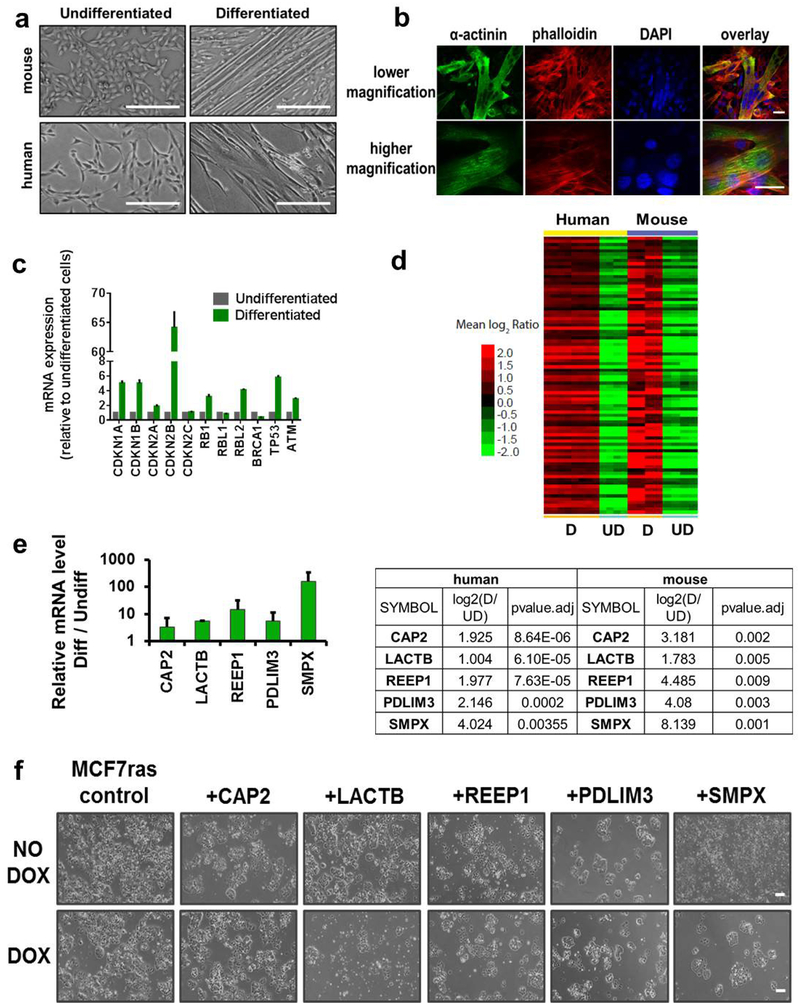
C2C12 mouse muscle progenitors and primary human muscle progenitors were differentiated in vitro according to standard protocols (Extended Data Fig. 1a–c, see Methods). Gene expression microarray analysis was performed to identify mRNAs that were significantly upregulated in differentiated post-mitotic muscle cells of both species relative to undifferentiated, actively cycling cells (Extended Data Fig. 1d and Supplementary Table 1). Five genes (CAP2, LACTB, REEP1, PDLIM3, SMPX; Extended Data Fig. 1e) were chosen for functional validation. The cDNA of each gene was cloned into a doxycycline (DOX)-inducible Tet/ON vector and expressed in a derivative of the MCF7 human breast cancer cell line that carries an introduced HRASG12V oncogene (MCF7-RAS)4. Upon induction with DOX, overexpression of LACTB had a marked negative effect on the ability of cells to proliferate; SMPX overexpression had a modest effect, whereas no significant effect on cell proliferation was found after overexpression of CAP2, REEP1 or PDLIM3 (Extended Data Fig. 1f). Consequently, we focused our attention on the characterization of the functional role of the LACTB protein in cancer cells. LACTB is a mitochondrial protein that is related evolutionarily to bacterial penicillin-binding/B-lactamase proteins5,6. Homologues of the LACTB gene have been shown to be present in the genomes of all chordates that have been examined thus far. In mammals, LACTB has been shown to be ubiquitously expressed, most prominently in skeletal muscle, heart and liver5,7. Such evolutionary conservation indicates an essential, albeit still unknown, cellular function. LACTB has been suggested to promote intra-mitochondrial membrane organization, to regulate complex I of the mitochondrial electron transport chain and to regulate cellular metabolic processes8–11.
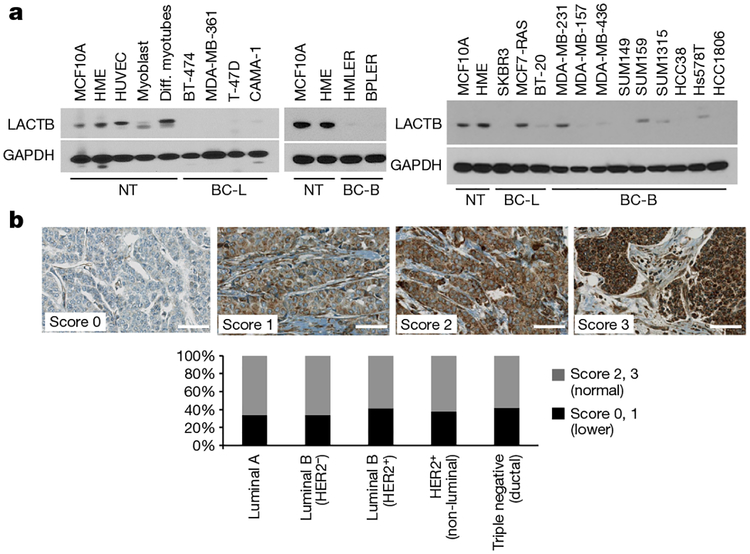
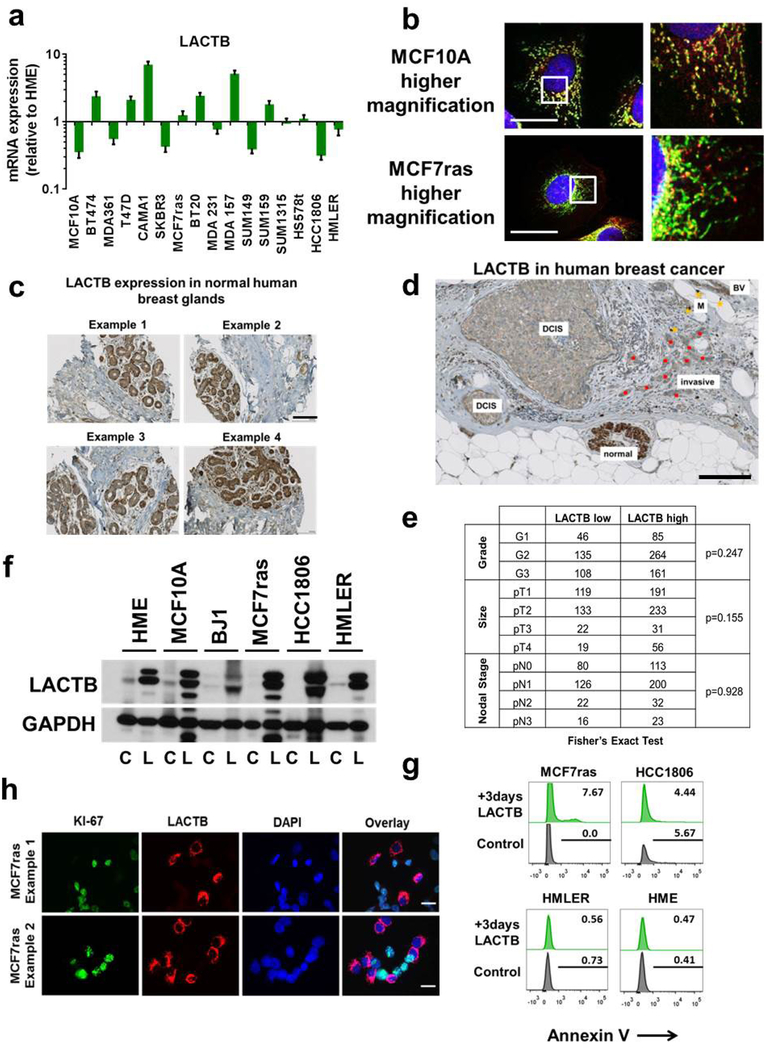
We performed quantitative PCR with reverse transcription (qRT–PCR) analyses to compare the levels of LACTB mRNA in various non-tumorigenic and tumorigenic mammary cell lines. This analysis did not show any correlation between LACTB mRNA expression and the neoplastic cell state (Extended Data Fig. 2a). However, because LACTB protein expression has also been shown to be regulated at the post-transcriptional level8,12,13, we compared the levels of LACTB protein expression in a panel of normal and neoplastic cells. Immunoblot analysis showed a marked reduction in LACTB protein levels in breast cancer cell lines relative to non-tumorigenic mammary cells (Fig. 1a). Out of 18 breast cancer cell lines analysed, 15 showed decreased (albeit never entirely absent) LACTB protein levels, whereas three cell lines (MCF7-RAS, SUM159 and MDA-MB-231) showed LACTB protein levels comparable to those found in non-tumorigenic cell lines (Fig. 1a). However, further analysis showed that in MCF7-RAS cells, the LACTB protein had a staining pattern that was not only mitochondrial, but also had some punctate, non-mitochondrial staining (Extended Data Fig. 2b). The LACTB gene from MCF7-RAS cells also contained a R469K mutation (LACTBR469K) in its C terminus, which is adjacent to one of the three important catalytic and/or substrate-docking domains6. The same mutation was found in the endogenous LACTB sequence of SUM159 cells, whereas the sequence of endogenous LACTB in MDA-MB-231 cells had no apparent somatic mutations. We extended our findings in cell lines to clinical samples by analysing the expression of LACTB protein in normal human breast tissues (n = 120) and in a panel of 714 clinically defined human breast cancer samples. Whereas LACTB was expressed in 100% of normal mammary glands analysed (Extended Data Fig. 2c), expression was significantly downregulated in 34–42% of breast cancer tissues (Fig. 1b and Extended Data Fig. 2d). This downregulation did not correlate with any particular tumour type, grade or size (Fig. 1b and Extended Data Fig. 2e).
Figure 1 |. LACTB downregulation in cancer cells.
a, Western blot of endogenous LACTB protein levels in a panel of non-tumorigenic and breast cancer cell lines. Note that LACTB is substantially decreased in many breast cancer cell lines, but it is never completely absent. Some LACTB is still present upon overexposure of the western blot membrane. NT, non-tumorigenic cells, BC-L, breast cancer luminal cells, BC-B, breast cancer basal cells. Diff. myotubes, differentiated myotubes; HUVEC, human umbilical vein endothelial cells. b, Representative immunohistochemistry images of endogenous LACTB protein levels (brown) in a panel of 714 clinically defined human breast cancer samples. Scores 2 and 3 represent LACTB staining that was considered normal (not downregulated), whereas scores 0 and 1 represent LACTB staining that was considered downregulated. Luminal A (n = 329), luminal B HER2− (luminal B, HER2-negative) (n = 197), luminal B HER2+ (luminal B, HER2-positive) (n = 60), HER2+ (non-luminal, HER2-positive) (n = 37), triple-negative ductal (n = 91) cancer. Scale bar, 50 μm.
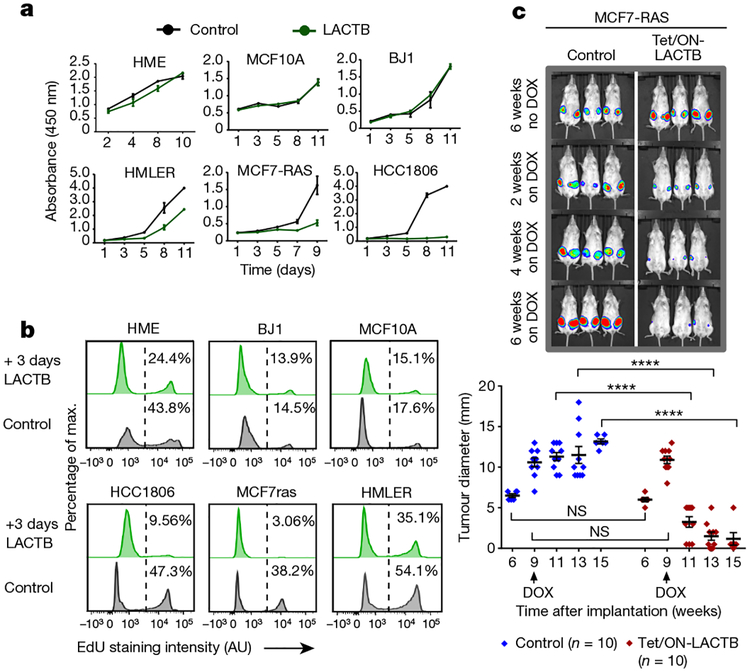
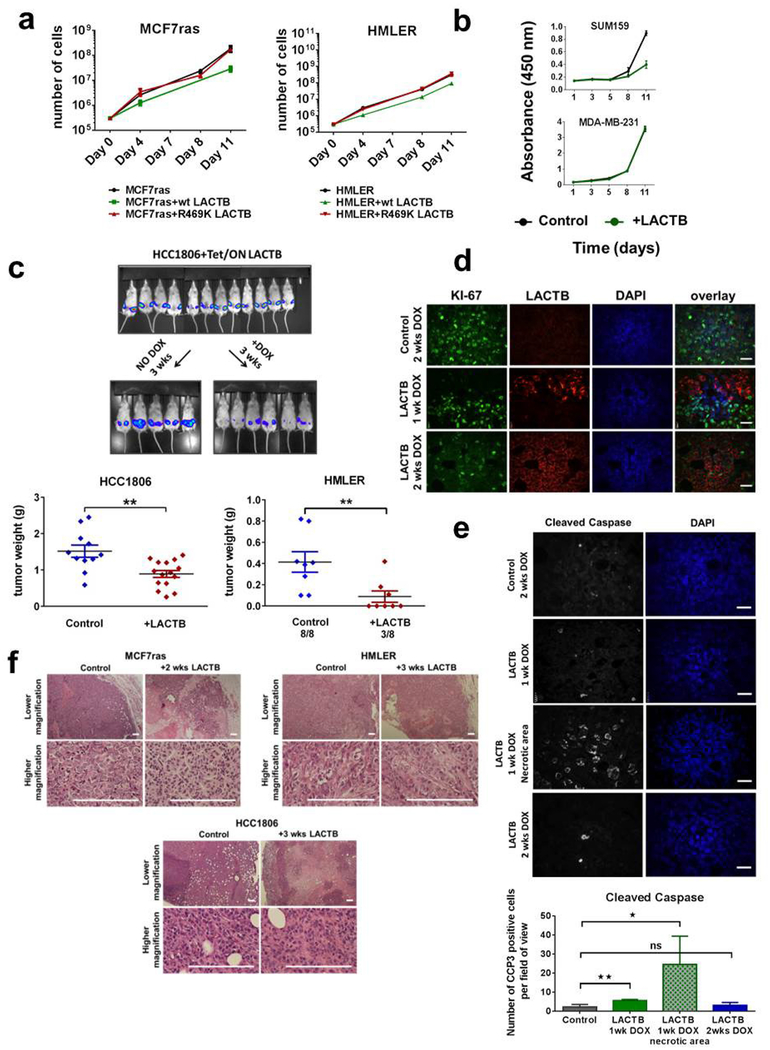
We induced LACTB in a panel of tumorigenic and non-tumorigenic cell lines to assess the biological effects of LACTB expression in cells and measured cell proliferation. Since DOX has been reported to modulate mitochondrial function through its effects on the mitochondrial translation machinery14–16, experiments in this study were always performed by adding DOX to control cells, unless otherwise noted. LACTB overexpression decreased the rate of proliferation in the three breast cancer cell lines tested (HMLER, MCF7-RAS and HCC1806), whereas proliferation of the three non-tumorigenic cell lines (HME, MCF10A and BJ1) was only minimally affected by LACTB overexpression (Fig. 2a and Extended Data Fig. 2f). These results were further confirmed and extended by EdU, annexin V and Ki-67 staining (Fig. 2b and Extended Data Fig. 2g, h) and supported the idea that expression of LACTB caused responsive cells to with draw from the active cell cycle. Of note, the LACTBR469K mutant did not display any negative effect on growth of MCF7-RAS and HMLER cancer cells (Extended Data Fig. 3a) and when wild-type LACTB was expressed in SUM159 and MDA-MB-231 human breast cancer cells, it had a negative effect on the growth of SUM159 cells, but not on the growth of MDA-MB-231 cells (Extended Data Fig. 3b). In summary, these and previous results showed that although a substantial majority of breast cancer cell lines exhibit downregulated or mutated LACTB and are negatively affected by wild-type LACTB induction, there are some breast cancer cell lines (such as MDA-MB-231) that seem to be unaffected by induction of LACTB expression.
Figure 2 |. LACTB-induced effects on proliferation of breast cancer cells.
a, Growth of cells upon LACTB induction. Absorbance is shown in arbitrary units. Three independent experiments were performed. b, DNA synthesis in non-tumorigenic and tumorigenic cell lines upon LACTB induction. Numbers within the graphs represent percentages of gated cells, the dashed line indicates the gate. AU, arbitrary units. The experiment was repeated twice. c, Tumour growth rate upon LACTB induction monitored in vivo by whole mouse imaging and tumour measurements. DOX, doxycycline treatment for the indicated time. Data are mean ± s.e.m. ****P< 0.0001; NS, not significant (P> 0.05). The experiment was repeated twice.
We subsequently determined whether expression of LACTB in already formed tumours could negatively affect further tumour growth. MCF7-RAS, HMLER and HCC1806 tumours in which LACTB had been induced decreased significantly in size within 2–3 weeks of LACTB induction by DOX, with some tumours completely disappearing by 4 weeks of DOX treatment (Fig. 2c and Extended Data Fig. 3c). Ki-67 staining of tissue sections showed a high proliferation index of the MCF7-RAS control tumour cells (80% positive), whereas cells that expressed LACTB had lower Ki-67 expression (15% positive) (Extended Data Fig. 3d). This decrease in proliferation was accompanied by an increase in cleaved caspase staining, which is indicative of apoptosis (Extended Data Fig. 3e). Notably, haema-toxylin and eosin staining of the tumours that expressed the LACTB construct showed a staining pattern that was very different from that of control tumours, particularly for the HMLER and MCF7-RAS tumours and to a lesser degree for the HCC1806 tumours. Control tumours consisted of large, poorly differentiated cells with little cytoplasm, relatively little stroma, and had small areas of central necrosis. By contrast, tumours that expressed inducible LACTB consisted of large areas of necrosis that extended throughout the entire tumour, abundant stroma, and residual cancer cells that were smaller, with a more differentiated, epithelial appearance (Extended Data Fig. 3d, f).
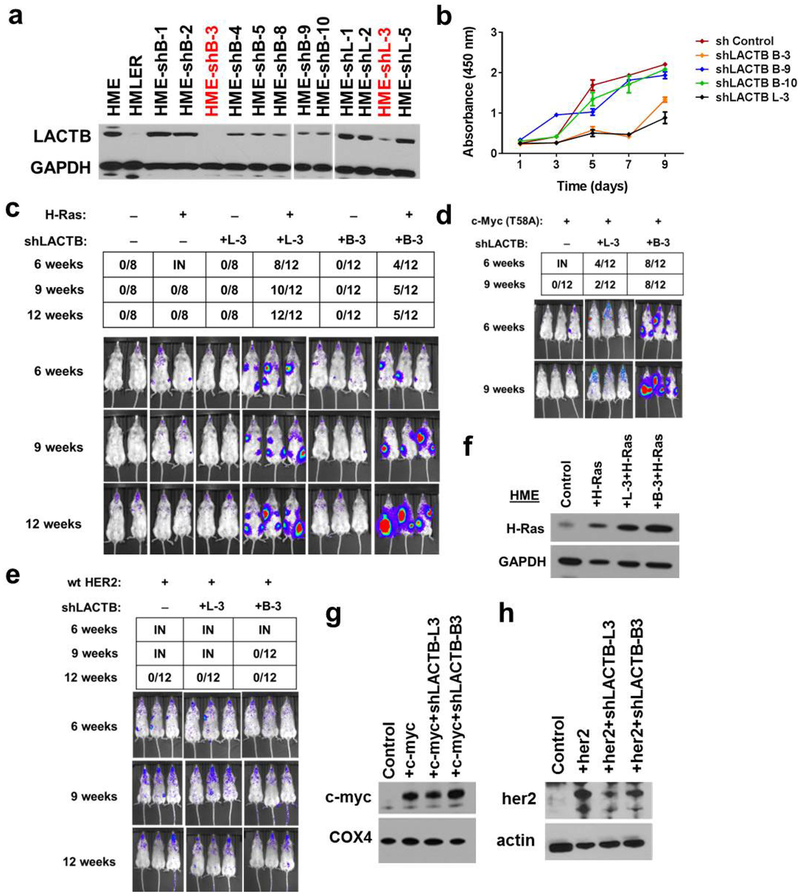
To further investigate whether LACTB played an active role in hindering tumorigenesis, we employed short hairpin RNA (shRNA) to downregulate LACTB expression in HME cells. Two different LACTB shRNAs (L-3 and B-3) were chosen based on their LACTB knockdown efficiencies (86% and 90%, respectively; Extended Data Fig. 4a). Decreased levels of LACTB in HME cells resulted in a twofold reduction in proliferation relative to unmodified HME cells that were propagated in parallel, implying that a minimal level of LACTB is necessary for efficient proliferation of non-transformed cells (Extended Data Fig. 4b). The tumorigenic abilities of the two resulting cell populations were analysed by orthotopic implantation into non-obese diabetic/severe combined immunodeficiency (NOD/SCID) mice. Both cell populations failed to form tumours by 12 weeks after implantation, indicating that LACTB downregulation did not suffice, on its own, to transform these cells into a tumorigenic state (Extended Data Fig. 4c). Because the loss of tumour suppressor gene function often requires concomitant expression of an oncogene for transformation to occur17–20, we tested whether the concomitant knockdown of LACTB and introduction of an HRASG12V oncogene would make HME cells tumorigenic. Indeed, following orthotopic implantation, these cells formed tumours at 6 weeks after injection, whereas HME cells expressing only the introduced HRASG12V oncogene failed to form any tumours by 12 weeks after injection (Extended Data Fig. 4c). We also tested whether decreased levels of LACTB caused tumorigenesis when introduced together with any other oncogene. Tumour growth was also observed when downregulation of LACTB was coupled with upregulation of an active MYCT58A oncogene, but not when coupled with wild-type human HER2 overexpression (Extended Data Fig. 4d–h).
Mechanism of action of LACTB
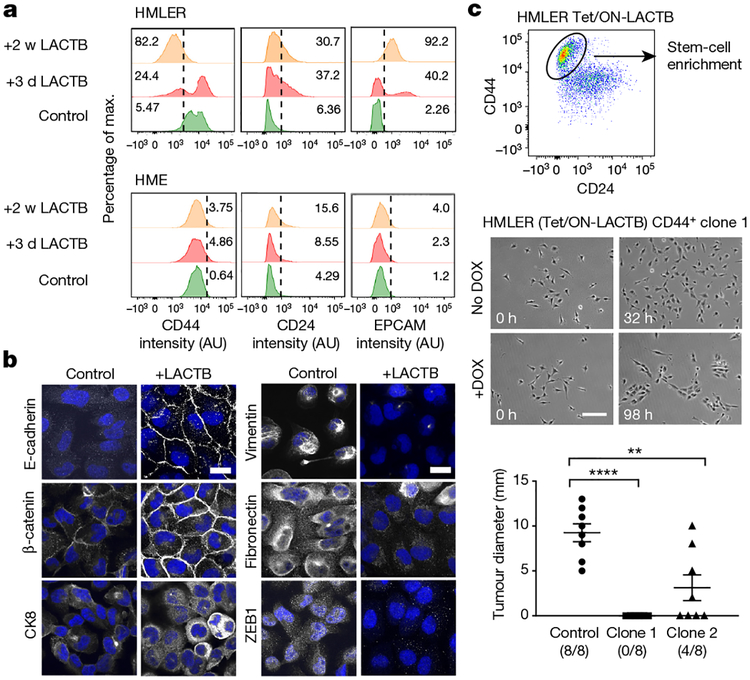
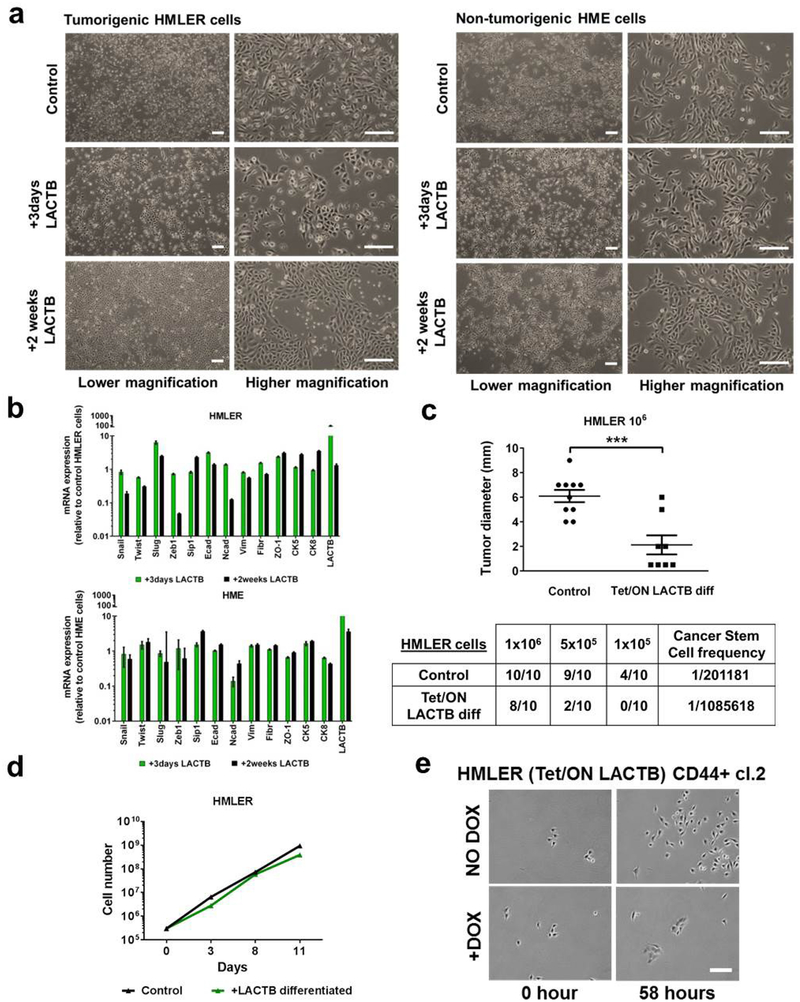
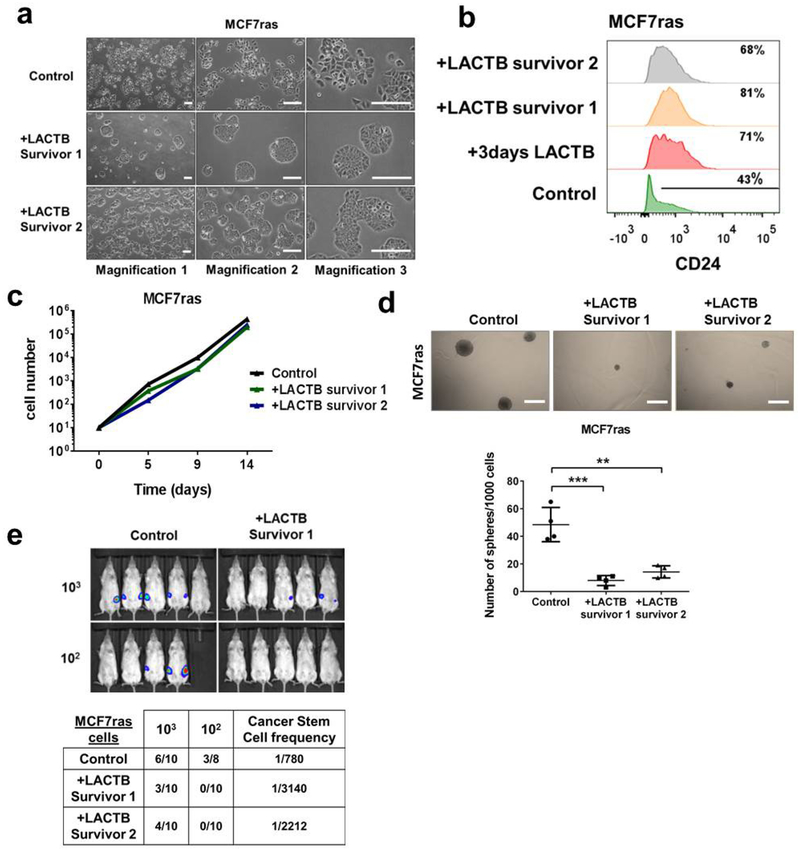
Our in vitro experiments revealed that carcinoma cells (HMLER, MCF7-RAS), which experienced and survived forced LACTB expression, showed more differentiated morphology, which was characterized by tight epithelial cobblestone islands (Extended Data Fig. 5a), increased expression of markers of epithelial differentiation (EPCAM, CD24) and decreased CD44 expression (Fig. 3a). qRT-PCR and immunofluorescence analysis confirmed that the cancer stem-cell marker ZEB1 (refs 21, 22), as well as several mesenchymal markers, were all downregulated in HMLER cells in which LACTB was induced, whereas epithelial markers were upregulated in these cells (Fig. 3b and Extended Data Fig. 5b). Forced overexpression of LACTB in non-tumorigenic HME cells had no discernible effect on their morphology (Extended Data Fig. 5a) or differentiation (Fig. 3a and Extended Data Fig. 5b). When injected at limiting dilutions into fat pads of NOD/SCID mice, a decrease in tumour formation and tumour weight was seen in the more differentiated HMLER cells that experienced chronic LACTB induction relative to control HMLER cells in which LACTB had not been induced (Extended Data Fig. 5c). Of note, the in vitro proliferation rates of these two cell lines were comparable (Extended Data Fig. 5d). To examine whether LACTB expression can directly lead to the induction of epithelial differentiation we used fluorescence-activated cell sorting to collect and single-cell clone the more mesenchymal, cancer stem-cell (CSC)-enriched CD44high CD24low cells from a population of HMLER-Tet/ON-LACTB cells. LACTB expression was then induced in two of the resulting single-cell clones (HMLER-CD44+ clone 1 and clone 2). In both clonal cell populations, those cells in which LACTB was induced proliferated slower, formed small epithelial islands within 3–4 days of LACTB expression, and exhibited decreased tumorigenesis, than the control cells which retained their mesenchymal morphology (Fig. 3c, Extended Data Fig. 5e and Supplementary Videos 1–4). Similar effects on epithelial differentiation coupled with the loss of ability to form tumour spheres and initiate tumours were observed in MCF7-RAS cells forced to express LACTB (Extended Data Fig. 6a–e).
Figure 3 |. LACTB-induced effects on cancer cell differentiation.
a, Flow cytometry analysis of a marker of stem cells (CD44) and markers of epithelial differentiation (CD24, EPCAM) in tumorigenic HMLER and non-tumorigenic HME cells upon LACTB induction. Numbers within the graphs represent percentages of gated cells, the dashed line indicates the gate. b, Immunofluorescence staining of HMLER cells after LACTB induction for two weeks. Epithelial (E-cadherin, β-catenin, cytokeratin 8 (CK8)), mesenchymal (vimentin, fibronectin) and stem-cell (Zeb1) markers are shown in white, DAPI is shown in blue. Scale bars, 30 μm. Representative images of two independent experiments are shown. c, Gating strategy for single-cell clone generation (top). Growth, morphology and tumorigenicity of two single-cell clones after LACTB induction was monitored by live time-lapse imaging (growth and morphology analysis, middle) and orthotopic injections into mice (tumorigenicity analysis, bottom). Time-lapse videos of the growth of clones 1 and 2 can be found in the Supplementary Information. Scale bar, 200 μm. Data are mean ± s.e.m. **P < 0.01; ****P <0.0001.
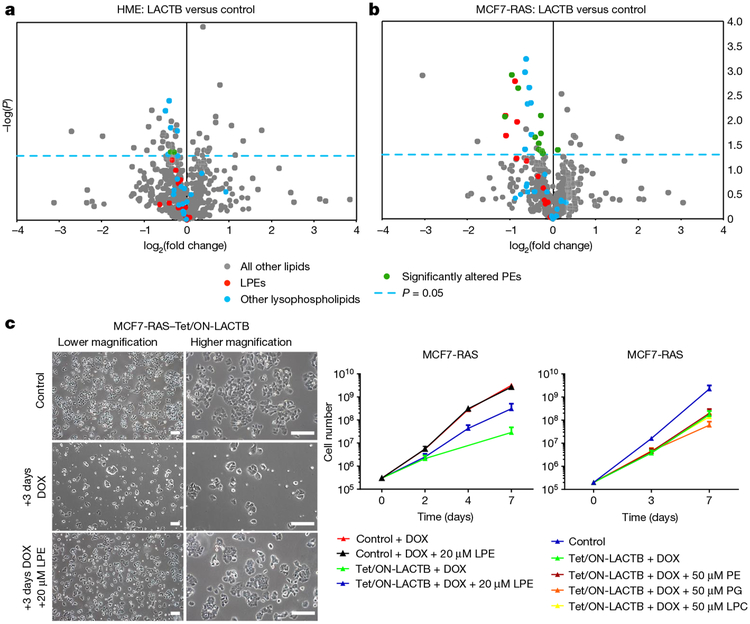
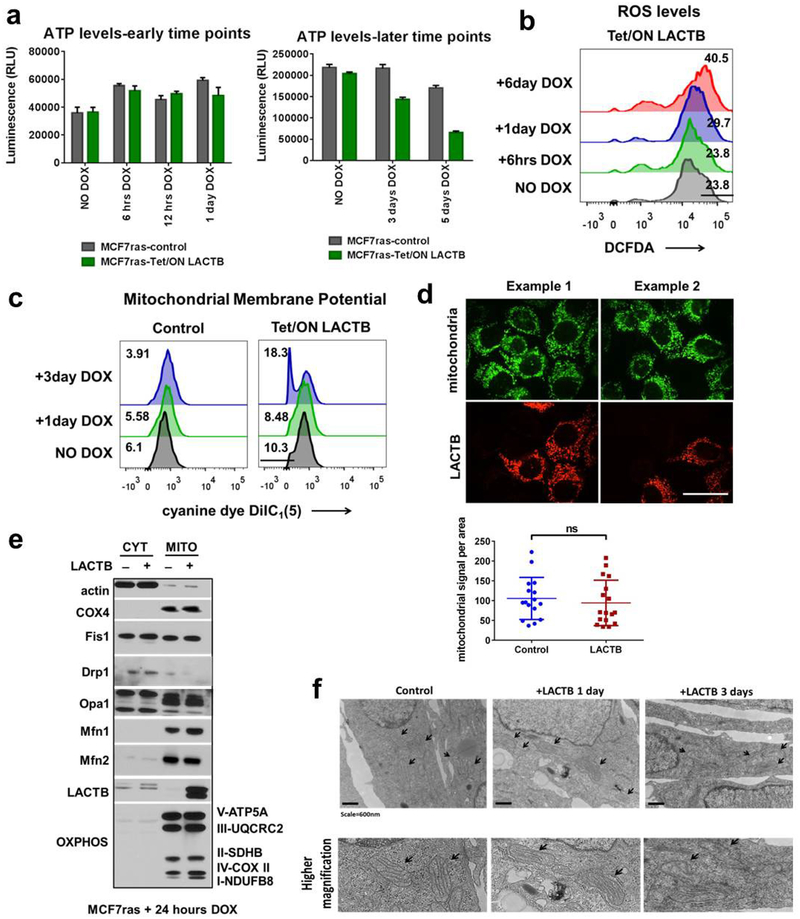
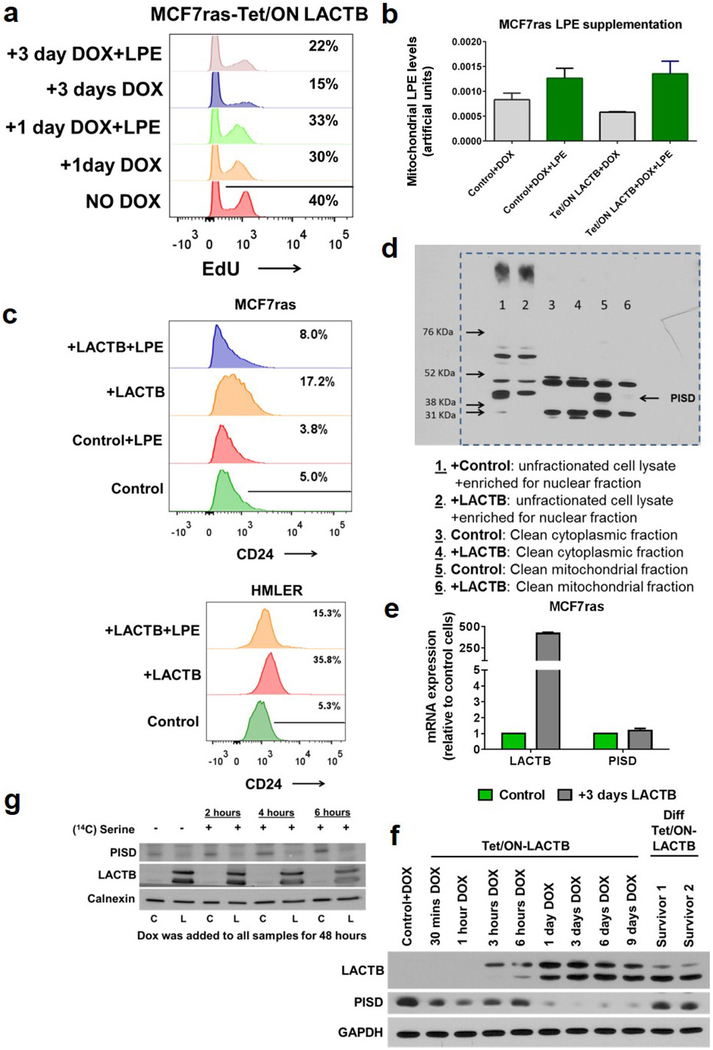
To elucidate the more direct mechanism(s) of action of LACTB, we analysed several mitochondrial processes at early time points (within 1 day) of LACTB induction. These early time points would show the more immediate effects of LACTB on cancer cells, whereas later responses might represent effects that operate further downstream of LACTB expression. As shown in Extended Data Figure 7a–f, we did not detect any significant changes in ATP or ROS production, mitochondrial membrane potential, mitochondrial numbers, localization and structure, or protein levels and localization of markers of mitochondrial fusion and fission in MCF7-RAS cells in which LACTB expression had been induced for up to 24 h. However, when these processes were assessed at later time points (3–6 days), they showed significant changes when compared to the control cells (Extended Data Fig. 7a–c, f and data not shown). Since bioinformatics and transgenic mice studies have linked LACTB to obesity and fatty-acid metabolism10,11, we also analysed mitochondrial lipids. Liquid chromatography-tandem mass spectrometry (LC–MS/MS) analysis of mitochondrial lipids showed a substantial decrease (30–50%) in the quantities of lysophosphatidylethanolamines (LPEs) and phos-phatidylethanolamines (PEs) during the initial induction of LACTB expression (24 h) in the tumorigenic MCF7-RAS cells, but not in non-tumorigenic HME cells (Fig. 4a, b and Supplementary Table 2). In order to determine whether the lower levels of LPE and/or PE species contributed to the negative effect of LACTB on the proliferation of MCF7-RAS cells, we supplemented the culture medium of LACTB-exposed MCF7-RAS cells individually with these two lipid classes. Previous publications23–25 showed that extracellular LPE, but not PE, can be transported efficiently into mitochondria in which the LPE can then be acylated to PE. Supplementation of the growth medium of LACTB-induced MCF7-RAS cancer cells with 20 μ M LPE (but not with 50 μ M PE, phosphatidylglycerol or lysophosphatidylcholine) increased cell proliferation, thereby partially reversing the reduction in cell proliferation induced by LACTB (Fig. 4c). Moreover, EdU staining of MCF7-RAS cells in which LACTB had been induced in the presence of 20 μM LPE showed that these cells had a 50% higher proliferative capacity relative to control MCF7-RAS cells (Extended Data Fig. 8a). LC–MS/MS analysis confirmed the increase of LPE levels in mitochondria following supplementation of LPE in the culture medium (Extended Data Fig. 8b). These data support the idea that a substantial part of the LACTB-induced negative effects on MCF7-RAS cells is mediated by decreased levels of LPE and/or PE. Next, we induced LACTB expression in MCF7-RAS and HMLER cells that were supplemented with 20 μM LPE and analysed the level of CD24 as a marker of cellular differentiation. The level of CD24 in these cancer cells was not increased to that in control cells in which LACTB was induced without LPE addition (Extended Data Figure 8c). These observations indicate that supplementation of these cancer cells with LPE upon LACTB expression can counteract the differentiation-inducing ability of LACTB and that these two effects are interconnected.
Figure 4 |. LACTB-induced changes in mitochondrial phospholipids.
a, b, LC–MS/MS analysis of mitochondrial lipid content of LACTB- induced (24 h of induction) versus control-treated HME (a) and MCF7-RAS (b) cells. The blue, dashed line indicates a P value of 0.05. Dots above this line are significantly changed by LACTB treatment (P < 0.05). Each dot represents a different lipid type. The experiment was repeated twice. c, Proliferation rates of MCF7-RAS and MCF7-RAS–Tet/ON-LACTB cells in the presence of DOX with or without supplementation with LPE, PE, phosphatidylglycerol (PG), or lysophosphatidylcholine (LPC). Representative images are shown on the left. The experiment was repeated three times. Scale bars, 200 μm. Data are mean ± s.e.m. (c).
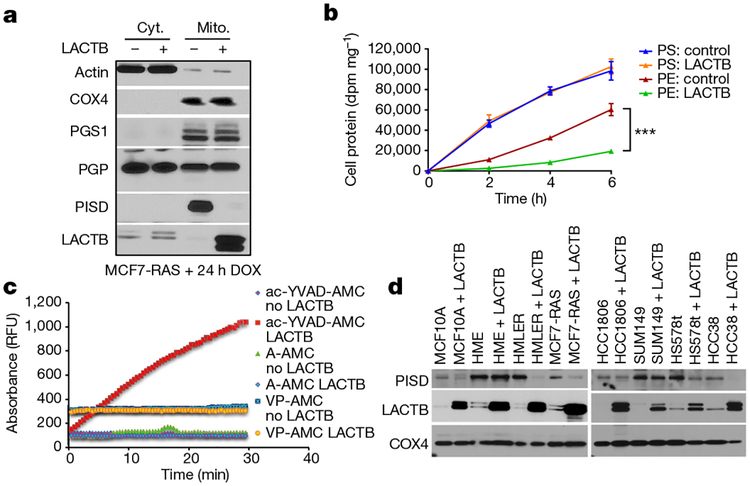
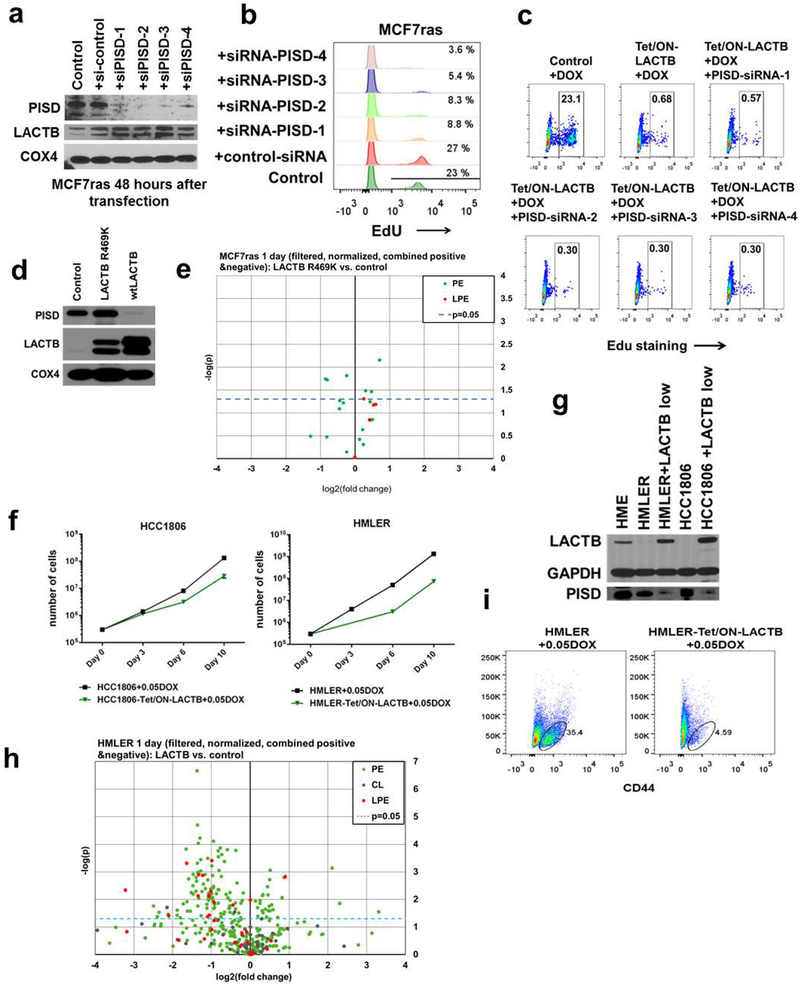
To further identify downstream targets of the activity of LACTB, we hypothesized that LACTB might be modulating the activity of mitochondrial proteins that are involved in phospholipid metabolism, notably LPE and PE biology. One such candidate was mitochondrial phosphatidylserine decarboxylase (PISD), an inner-mitochondrialmembrane enzyme that converts phosphatidylserine (PS) to PE26. Figure 5a and Extended Data Figure 8d show that the induced expression of LACTB was associated with markedly decreased levels in PISD protein (by 60–95%) in mitochondria, whereas other mitochondrial lipid-metabolizing enzymes were unaffected. This effect was the result of a post-transcriptional event (Extended Data Fig. 8e). Further kinetic experiments showed that PISD levels began to decrease at 24 h of induced LACTB expression (Extended Data Fig. 8f). To determine whether LACTB expression directly reduced PISD function in cells, we supplemented MCF7-RAS cells with [3H]serine for up to 6 h and monitored the conversion of PS to PE by PISD in both control MCF7-RAS cells and in MCF7-RAS cells in which LACTB was induced for 2 days. The cells in which LACTB had been induced showed a significantly reduced (by 60–80%) production of [3H]PE from [3H]PS, consistent with our previous observation that the activity and/or stability of PISD is influenced by LACTB (Fig. 5b and Extended Data Fig. 8g). Experiments using short interfering RNA (siRNA) that targeted PISD showed that downregulation of PISD had similar effects on MCF7-RAS cell biology as the induction of LACTB (Extended Data Fig. 9a, b and as previously described25) and that the two effects might operate in the same linear pathway (Extended Data Fig. 9c). Of note, LACTB(R469K) was unable to downregulate PISD (Extended Data Fig. 9d) and LPE/PE lipid species (Extended Data Fig. 9e and Supplementary Table 2) and LACTB overexpression at physiological levels (achieved by titrating down the level of doxycycline) had comparable effects on the biology of cancer cells as higher expression levels of LACTB did (Extended Data Fig. 9f–i)
Figure 5 |. The role of PISD in mechanism of action of LACTB.
a, Western blot analysis of fractionated MCF7-RAS cells and MCF7-RAS–Tet/ON-LACTB-expressing cells after 24 h of DOX treatment. Cyt., cytosolic fraction; Mito., mitochondrial fraction. This membrane was also used in Extended Data Fig. 7e. The signal for the control antibodies is shared between these both Figures. b, Conversion of PS to PE in MCF7-RAS and MCF7-RAS–Tet/ON-LACTB cells treated with DOX for 48 h. The experiment was performed in triplicate. Data are mean ± s.e.m. ***P< 0.001. c, Fluorescent absorbance monitored over time as a measurement of active peptidase activity of LACTB. RFU, relative fluorescence units. d, Western blot analysis of PISD levels in mitochondria isolated from a panel of control and Tet/ON-LACTB non-tumorigenic (HME and MCF10A) and tumorigenic cell lines (all others) after addition of DOX for 24 h.
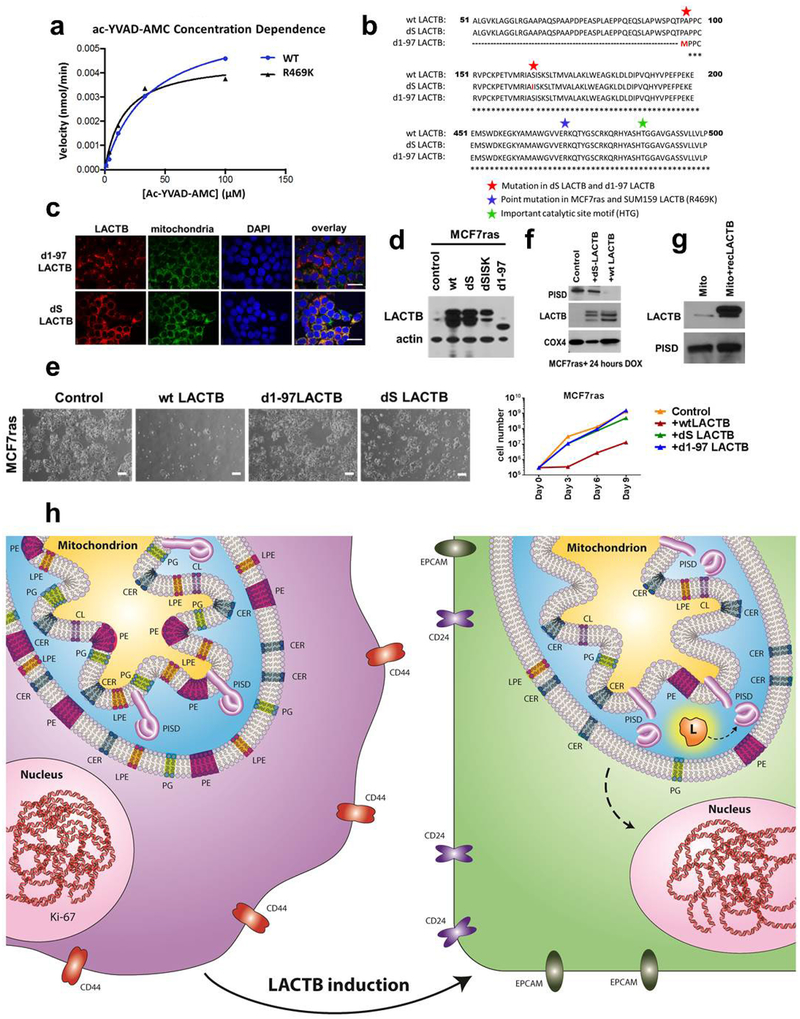
Although LACTB is predicted to be a serine protease on the basis of its structure, proteolytic activity of LACTB has not been directly confirmed. LACTB is inhibited by Z-AAD-CMK27, a known granzyme-B inhibitor, which led us to predict that it might cleave peptide bonds adjacent to aspartic-acid residues. Indeed, LACTB efficiently cleaved the fluorogenic peptide Ac-YVAD-AMC, but not the A-AMC or VP-AMC peptides, indicating that LACTB possesses proteolytic activity and can cleave peptide bonds adjacent to aspartic acid residues (Fig. 5c and Extended Data Fig. 10a). Of note, the LACTBR469K mutant also possesses proteolytic activity (Extended Data Fig. 10a). This suggests the possibility that even though this mutant still has proteolytic activity for the ac-YVAD-AMC peptide in vitro, the in vivo specificity of this mutant might have changed owing to the post-translational modification of the lysine residue. Our mutational and proliferation studies further determined that the proteolytic function and mitochondrial localization are important for the tumour-suppressing effect of LACTB and that the downregulation of PISD in the presence of induced LACTB is dependent on the intact catalytic activity of LACTB (Extended Data Fig. 10b–f). However, in vitro incubation of recombinant LACTB with permeabilized mitochondria isolated from MCF7-RAS did not directly induce the degradation of PISD, suggesting that PISD is not a direct substrate of LACTB (Extended Data Fig. 10g). However, the absence of an effect of LACTB on the PISD protein was difficult to interpret, given that we do not know the precise conditions under which these proteins interact in vivo. Figure 5d shows that PISD levels were reduced in response to LACTB induction in tumorigenic HMLER, HCC38, Hs578T cells and to a lesser degree in HCC1806 cells, but not in SUM149 breast cancer and non-tumorigenic HME and MCF10A mammary cells. These data indicate that the decrease in the amount of PISD induced by LACTB might represent a mechanism of action of LACTB shared by several, but not all, cancer cells and that this reduction in PISD does not occur in the non-tumorigenic cell lines that were tested. The inability of LACTB to downregulate PISD levels in differentiated non-tumorigenic cells (such as HME cells) explains its inability to negatively affect the proliferation of these cells. This implied, in turn, that in tumorigenic cells that had undergone differentiation and loss of tumorigenicity after LACTB induction, the subsequent induction of LACTB might no longer be able to downregulate PISD. Indeed, LACTB was unable to downregulate PISD levels in the already differentiated MCF7-RAS cells (Extended Data Fig. 8f) that were described in Extended Data Fig. 6a–e, thereby further supporting our observation that the actions of LACTB depend on whether it is induced in the context of less-differentiated cancer cells or fully differentiated non-tumorigenic cells.
Discussion
Here we describe a new tumour suppressor protein and a mechanism of the control of the neoplastic state. We show, using in vivo, in vitro and breast cancer tissue studies, that LACTB is a potent inhibitor of proliferation of multiple types of breast cancer cells. LACTB has the ability to change mitochondrial lipid metabolism and, through such reprogramming, to modulate the differentiation state of cancer cells. This is achieved through the LACTB-PISD-LPE/PE signalling axis described here (Extended Data Fig. 10h).
Mitochondrial phospholipids are important building blocks of mitochondrial membranes and perturbation of PEs and/or LPEs might influence diverse processes that are dependent on the proteins within these membranes. Because LPE can also serve as a precursor of PE within mitochondria, our work does not distinguish between the reduction in PE, LPE or both as cause(s) for cancer cell differentiation. Some reports have previously linked LPE to cell differentiation. For example, LPE-acyltransferase, the enzyme responsible for synthesis of PE from LPE, has been reported to have a role in cardiac muscle differentiation28. LPE also appears to modulate differentiation of neuronal PC12 cells29. It is plausible that changes in the presence of various mitochondrial phospholipids are required for the differentiation of dedifferentiated epithelial cells and that a transient change in the ratio of these mitochondrial phospholipids might initiate the process of differentiation. LPE was also reported to act as an inhibitor of phospholipase D30. As phospholipase D has known roles in inducing cellular differentiation31,32, downregulating LPE levels, through increased expression of LACTB, might lead to activation of phospholipase D and subsequent differentiation.
LACTB expression is downregulated in many breast cancer cell lines and tissues, but is never entirely absent. Indeed, available genomic databases also indicate that any substantial number of biallelic deletions of the LACTB gene are absent. Moreover, our silencing experiments using shRNA indicate that strong reductions in LACTB, which lead to the effective absence of this protein, negatively affect the growth of normal cells, suggesting that minimal levels of LACTB must be retained in order for normal cell proliferation to proceed. Together, these observations suggest that LACTB may represent an example of a tumour suppressor that acts in haploinsufficient manner, where loss of the entire protein is deleterious for an incipient cell. Notably, our work shows that LACTB preferentially downregulates the level of PISD in certain cancer cells, while not displaying this ability in the tested non-tumorigenic differentiated cells. Cancer cells differ from normal cells in many biochemical, signalling and regulatory pathways, and it will be of interest to examine which regulatory pathways are responsible for this differential behaviour of LACTB, how the observed changes in mitochondrial PE and/or LPE influence the differentiation state of cancer cells and which signalling pathways are involved in this process.
Our study highlights an unexplored cancer research area, in which the study of the expression profiles of cancer-resistant tissues may reveal the identities of hitherto unidentified tumour-suppressing genes. Stated differently, although the vast majority of current cancer research focuses on studying processes that lead to tumorigenesis in tissues in which cancer regularly occurs, the research field has overlooked the other side of the coin—to examine mechanisms, including specific genes, operating in tissues where cancers do not occur. Our study shows that we can indeed learn lessons from such cells and tissues and use this knowledge to design ways of fighting neoplastic cells and the tumours that they form.
METHODS
Cell culture and reagents.
All cells were cultured in a 5% CO2 humidified incubator at 37 °C. Cell lines, growth medium and sources are described in Supplementary Table 3. Most of the cell lines were purchased commercially from ATCC or Clonetics. All cell lines used in this study were verified to be mycoplasma-negative and their morphology and growth characteristics were compared to published information to ensure their authenticity. To activate the tetracycline-inducible gene expression, the cells were treated with 0.05–1 μg ml−1 DOX hyclate (Sigma-Aldrich) in medium. Fresh DOX was added every 3 days.
Muscle progenitor cells and mesenchymal stem cells (MSCs).
C2C12 mouse myoblast cells (ATCC) were cultured in DMEM containing 15% FBS. For differentiation of C2C12 cells, medium was changed to DMEM containing 2% horse serum. Medium was changed every 3 days and differentiation occurred around days 4–6. Human progenitor muscle cells (Cell Applications 151–25a) were grown and differentiated according to the manufacturer’s protocol.
Animals.
All animal experiments were performed with female virgin NOD/SCID mice (non-obese diabetic/severe combined immunodeficiency). Mice were 2–4 months of age at the time of injections. A colony of NOD/SCID mice was maintained in-house. Mice were housed and handled in accordance with protocols approved by the Animal Care and Use Committees of the Massachusetts Institute of Technology. Animals were randomized by age and weight. The exclusion criterion of mice from experiments was sickness of the animals owing to the appearance of spontaneous thymomas that sometimes affect NOD/SCID mice. Sample sizes were chosen to reach statistical significance, and tumour measurements and data analysis were performed in a blinded fashion. Maximum tumour size permitted by our IACUC protocol was 2 cm and these limits were not exceeded in any of our experiments.
Viral vectors and infection.
Human LACTB cDNA was purchased from Open Biosystems (MHS1010–98051227). REEP1 cDNA was purchased from Open Biosystems (MHS1010–98051276). CAP2, SMPX and PDLIM3 cDNAs were obtained by PCR from cDNA of differentiated human muscle cells using primers described in Supplementary Table 4. LACTBR469K cDNA was obtained by RT–PCR from MCF7-RAS cells using primers for LACTB described in Supplementary Table 4. All cDNAs were then subcloned into the FUW-LPT2 tetracycline-inducible lentiviral vector (modified from FUW-tetO by K.-J. Kah) with a puromycin-resistance gene. LACTB(S164I) was generated by mutating the serine residue in position 164 to isoleucine using primers described in Supplementary Table 4 and then subcloned into the FUW-LPT2 tetracycline-inducible lentiviral vector. LACTB(Δ1–97) was generated by PCR using primers described in Supplementary Table 4; the protein starts with methionine as amino acid position number 97. MYC(T58A) expression vector was purchased from Addgene 18773. RAS-IRES-GFP expression vector was purchased from Addgene 18780. The human pWPXL-HER2 plasmid was a gift from W. Guo. pMMP-LucNeo, carrying coding sequences for luciferase and neomycin phosphotransferase, were obtained from R. A. Segal33. To downregulate LACTB expression we used shLACTB L-3 (Open Biosystems TRCN0000046625) and shLACTB B-3 (Broad Institute TRC shRNA library TRCN0000296726). Both shRNAs are cloned into the pLKO.1 lentiviral vector with a puromycin-selection marker. An empty pLKO.1 vector was used as a control.
For lentiviral infection, cells were seeded at 30% confluency in a 10-cm dish and transduced 24 h later with virus in the presence of 5 μg ml−1 polybrene (EMD Millipore TR-1003-G). Cells were then selected by the relevant selection marker.
We found the DOX-inducible FUW-LPT2 vector to be a little leaky; minimal amounts of the cloned gene were expressed even in the absence of DOX (as judged by qRT-PCR analysis). Although this leakiness never had any physiological significance for short-term experiments, keeping these cells in tissue culture for a long time might lead to a change in physiology of these cells. Therefore, as a precaution, we never kept cell lines transduced with FUW-LPT2 containing the cloned factor in tissue culture for longer than two months. After two months, the cell lines were discarded and new ones were freshly transduced with FUW-LPT2 containing the cloned factor vector and selected with the appropriate selection marker.
siRNA and transfection.
Four Dicer-substrate short interfering RNA (dsiRNA) duplexes against the human PISD gene were designed and purchased from Integrated DNA Technologies.
dsiRNA-PISD-1 sense: CCACCAUCGUGCUCAUCUUCGAGGC
dsiRNA-PISD-2 sense: CCUACAAUGACUUCAGCUUCGUGAC
dsiRNA-PISD-3 sense: CAAUCAGGUGGAGCUGCCACACUGG
dsiRNA-PISD-4 sense: GCAGGGUGGCUUUGUACAAGUCAGT
Premade negative control dsiRNA was purchased from Integrated DNA Technologies (DS NC1, 180683394N/A). Cells were plated in 10-cm dishes and transfected the next day with Lipofectamine 2000 (ThermoFisher) according to the manufacturer’s protocol. Analyses were performed 48 h after transfection.
Tumour-cell injections.
For orthotopic tumour transplantations, cells were resuspended in 20 μl of 50% Matrigel and injected into mammary fat pads of female NOD/SCID mice. The in vivo DOX treatment was administered through drinking water containing 2 mg ml−1 DOX and 10 mg ml−1 sucrose.
The tumour incidence and weight were measured 2–3 months after injection. For limiting dilution analyses, the frequency of cancer stem cells in the cell population that was transplanted was calculated using the Extreme Limiting Dilution Analysis Program (http://bioinf.wehi.edu.au/software/elda/index.html).
Regarding Fig. 2c, control MCF7-RAS cells and MCF7-RAS–Tet/ON-LACTB cells were injected (105 cells per injection) into fat pads of female NOD/SCID mice. When the tumours reached approximately 10 mm in diameter DOX was administered to both groups and the tumour growth rate was monitored in vivo by whole-mouse imaging and tumour measurements.
In vivo mouse imaging.
Bioluminescence imaging of luciferase activity was used to monitor tumour growth with a Xenogen IVIS system under 2.5% isoflurane anaesthesia at the indicated time points. Imaging of mice was performed by injection of d-luciferin (165 mg per kg body weight, intraperitoneal injection; Caliper Life Sciences) 10 min before bioluminescence imaging. Images were analysed using Living Image Software version 4.3.1 (Caliper Life Sciences).
Immunofluorescence (tissues, cells).
Tumours were fixed in 10% neutral buffered formalin overnight and embedded in paraffin for sectioning. Sections were cut at 5 μm. Tumour sections were deparaffinized in xylene and antigen retrieval was performed in Target Retrieval Solution (Dako S1700) using a microwave. Background was then reduced using ImmunoStain Blocker Solution (GeneTex GTX73323) for one hour at room temperature. Sections were then blocked with 2% normal horse serum in PBS for one hour at room temperature. Sections were incubated with primary antibody at 4 °C overnight. The type, source and dilution of antibodies are described in Supplementary Table 5. After three washes with PBS, sections were incubated with secondary antibodies (AlexaFluor, Invitrogen, 1:500) for one hour at room temperature, washed three times with PBS, and mounted on glass microslides (VWR 48312–002) in Prolong Gold antifade reagent with DAPI (Life Technologies P36931) and left to dry overnight at room temperature in the dark.
Cultured cells were seeded on sterilized, round glass slides inside 10-cm Petri dishes with cell culture medium. Once cells reached a sufficient density, glass slides were transferred into individual wells of 6-well dish and subsequent processing was done in this format at room temperature unless otherwise stated. Cells were washed in PBS, fixed in 10% formalin for 10 min, washed once in PBS, permeabilized with PBS + 0.1% Triton-X for 10 min, washed 3 × 10 min in PBS and incubated in 5% horse serum for 1 h. Cells were then incubated in specific primary antibodies at 4 °C overnight, washed three times with PBS, then incubated with secondary antibodies for 1 h at room temperature. After three washes with PBS, stained cells were mounted on glass microslides (VWR 48312–002) in Prolong Gold antifade reagent with DAPI (Life Technologies P36931) and left to dry overnight at room temperature in the dark. The type, source and dilution of antibodies are described in Supplementary Table 5.
Immunostained samples were imaged and analysed using a Zeiss RPI Spinning Disc Confocal microscope with MetaMorph Software or Perkin Elmer Spinning Disc Confocal microscope with Volocity software.
Electron microscopy.
Cells were fixed in 2.5% glutaraldehyde, 3% paraformaldehyde with 5% sucrose in 0.1 M sodium cacodylate buffer (pH 7.4), pelleted, and post-fixed in 1% OsO4 in veronal-acetate buffer. The cell pellet was stained en bloc overnight with 0.5% uranyl acetate in veronal-acetate buffer (pH 6.0), then dehydrated and embedded in Embed-812 resin.
Sections were cut on a Leica Ultracut E microtome with a Diatome diamond knife at a thickness setting of 50 nm, stained with uranyl acetate, and lead citrate. The sections were examined using a FEI Tecnai spirit at 80 kV and photographed with an AMT CCD camera.
Western blot.
Proteins were extracted from cells using RIPA buffer (Sigma-Aldrich R0278) always in the presence of protease (Roche Diagnostics 11836153001) and phosphatase (Roche Diagnostics 04906845001) inhibitors. Human skeletal myoblast lysate was purchased from ZenBio TCE-SKB and lysate from differentiated human skeletal myotubes was purchased from ZenBio TCE-SKM. Approximately 10–20 μg of protein lysate was loaded on the gels. Western blots and transfers were done using standard protocols. Horseradish peroxidase-conjugated secondary antibodies were used (Cell Signaling, 1:5,000). Blots were developed using ECL (Dura or Femto, Thermo Scientific). The type, source and dilution of antibodies are described in Supplementary Table 5.
Western blot analysis related to [3H] serine labelling of phospholipids was performed by loading sample proteins on a 10% gel, then transferring the proteins to polyvinylidene difluoride membranes and blocking in 1% milk. The antibodies and their dilutions are described in Supplementary Table 5. HRP substrate is Luminata Forte (Millipore) and images were collected on a G:BOX with Syngene software.
Quantitative RT–PCR.
Total RNA was isolated directly from cultured cells using the RNeasy Plus Mini kit (Qiagen 74136). Reverse transcription was performed with a High Capacity cDNA Reverse Transcription Kit (Life Technologies 4368814). mRNA levels were measured with gene-specific primers using the SYBR Green I master mix (Roche) on a Roche LightCycler 480 system (Roche). Relative expression levels were normalized to GAPDH. The PCR primer sequences are listed in Supplementary Table 4.
Clinical data in human breast tissues.
LACTB expression was studied on 808 patient samples assembled on a tissue microarray as previously described34. The study was approved by the ethical committee of the Kanton Zürich under reference number KEK-ZH-Nr. 2014–0604. Tumour tissue was immunohisto-chemically stained using the LACTB polyclonal antibody (Proteintech Group, dilution 1:200) on an automated immunostaining platform (Leica BOND, Wetzlar, Germany). Immunohistochemical intrinsic subtyping of the cohort was performed as previously described35. LACTB expression was analysed as no expression or lower than in normal tissues (scores 0, 1) and normal expression in the luminal or basal compartment (scores 2, 3). Statistical analysis was performed with the SPSS statistical package version 21 (IBM P < 0.05 was considered statistically significant).
Flow cytometry (EdU, annexin, ROS and mitochondrial membrane potential).
Cells were trypsinized and filtered through 40-μm cell strainers to obtain single cells. Cells were then labelled for flow cytometry by a 1 h incubation with dye-conjugated antibodies and washed once in PBS. The list of antibodies, their source and dilution can be found in Supplementary Table 5. Samples were sorted on a BD FACSAriaII sorter and analysed using BD FACSDiva Software (BD Biosciences).
Click-iT EdU Alexa Fluor 647 Flow Cytometry Assay Kit (Life Technologies C10424) was used for EdU staining according to the manufacturer’s protocol.
ANXN V-PE Apoptosis Detection Kit (BD Biosciences 559763) was used for annexin V staining according to the manufacturer’s protocol.
MitoProbe DilC 1 (5) Assay Kit (Life Technologies M34151) was used for mitochondrial membrane potential staining according to the manufacturer’s protocol.
DCFDA - Cellular Reactive Oxygen Species Detection Assay Kit (Abcam ab113851) was used for ROS measurement according to the manufacturer’s protocol.
ATP measurement.
ATP levels within cells were assessed using the CellTiter-Glo Luminescent Cell Viability Assay (Promega G7572) according to the manufacturer’s protocol. 1,000–3,000 cells were seeded in a flat-bottom 96-well plate. Four replicates were plated for each time point.
Soft agar colony formation assay (tumourspheres).
Growth in soft agar was performed as described in ref. 36.
Subfractionation and mitochondrial isolation.
Cells were collected and mitochondria were subsequently isolated using the Qproteome Mitochondria Isolation Kit (Qiagen 37612) for mitochondrial lipid composition analysis or Cell Fractionation Kit (Abcam ab109719) for western blot subfractionation experiments. Isolated mitochondria were frozen at −80°C. The Cell Fractionation Kit was also used for isolating cytosolic fractions.
Permeabilized mitochodria: mitochondria that had been isolated using the Qproteome Mitochondria Isolation Kit were incubated in hypotonic 100 mM HEPES (pH 7.0–7.6) solution (Sigma-Aldrich H0887) with or without 150 mM NaCl.
Mitochondrial lipid extraction.
Frozen mitochondria in Eppendorf tubes were thawed on ice, after which 600 μl LC–MS/MS-grade 100% methanol, 300 μl LC–MS/MS-grade water, 400 μl chloroform (without amylenes) were added in this order. Samples were vortexed for 10 min at 4°C and centrifuged at 13,000 r.p.m. for 10 min at 4°C. The lower lipid-containing layer was then carefully collected and dried for 1 h. Lipid extracts were stored at − 80°C.
Liquid chromatography and mass spectrometry.
Lipid extracts were separated on an Ascentis Express C18 2.1 × 150 mm 2.7 μm column (Sigma-Aldrich) connected to a Dionex UltiMate 3000 UPLC system and a QExactive benchtop orbitrap mass spectrometer (Thermo Fisher Scientific) equipped with a heated electrospray ionization (HESI) probe. Dried lipid samples were typically dissolved in 50 μl 65:30:5 acetonitrile:isopropanol:water (v/v/v) and 5 μl was injected into the LC–MS/MS, with separate injections for positive and negative ionization modes. Mobile phase A in the chromatographic method consisted of 60:40 water:-acetonitrile in 10 mM ammonium formate and 0.1% formic acid, and mobile phase B consisted of 90:10 isopropanol:acetonitrile, also with 10 mM ammonium formate and 0.1% formic acid. The chromatographic gradient was described previously37. The column oven and autosampler tray were held at 55 °C and 4 °C, respectively. The mass spectrometer parameters were as described previously38 and modified as described in ref. 39. The spray voltage was set to 4.2 kV, and the heated capillary and the HESI were held at 320 °C and 300 °C, respectively. The S-lens RF level was set to 50, and the sheath and auxiliary gas were set to 35 and 3 units, respectively. These conditions were held constant for both positive and negative ionization mode acquisitions. External mass calibration was performed using the standard calibration mixture every 7 days. Mass spectometry spectra of lipids were acquired in full-scan/data-dependent MS/MS mode. For the full scan acquisition, the resolution was set to 70,000, the AGC target was 1 × 10⁶, the maximum integration time was 50 msec, and the scan range was m/z = 133.4–2,000. For data-dependent MS/MS, the top 10 ions in each full scan were isolated with a 1.0-Da window, fragmented at stepped normalized collision energy of 15, 25, and 35 units, and analysed at a resolution of 17,500 with an AGC target of 2 × 10⁵ and a maximum integration time of 100 msec. The underfill ratio was set to 0. The selection of the top 10 ions was subject to isotopic exclusion, a dynamic exclusion window of 5.0 s, and an exclusion list of background ions based on a solvent blank.
High-throughput identification and relative quantification of lipids was performed separately for positive and negative ionization mode data, using LipidSearch software (Thermo Fisher Scientific/Mitsui Knowledge Industries) with the default parameters for QExactive Product Search and Alignment. After alignment, raw peak areas for all identified lipids were exported to Excel and filtered according to the following predetermined quality control criteria: Rej (reject parameter calculated by LipidSearch software) equal to 0; PQ (peak quality parameter calculated by LipidSearch software) greater than 0.85; CV (standard deviation/average peak area across triplicate injections of a representative (pooled) biological sample) below 0.4; R (linear correlation across a three-point dilution series of the representative (pooled) biological sample) greater than 0.9. Typically approximately 70% of identified lipids passed all four quality control criteria. Raw peak areas of the filtered lipids were added to generate a ‘total lipid signal’ for each sample, and individual lipid peak areas were normalized to this total signal as a control for extraction efficiency and sample loading. These normalized lipid abundances from control and LACTB-expressing cells were used to calculate fold changes and P values (Student’s t-test, two-tailed, unequal variance) upon LACTB expression. After this calculation, positive and negative ionization mode data were combined to generate Fig. 4a, b.
Lipid supplementation.
All lipids were purchased from Avanti Polar Lipids, lysophosphatidylethanolamine (LPE, VWR 100123–538), lysophosphatidylcho-line (LPC, Avanti Polar Lipids 830071P), phosphatidylethanolamine (PE, VWR 100127–544), phosphatidylglycerol (PG, VWR 100123–722). A stock solution (25 mM) of LPE was prepared as described in ref. 40. Stock solutions of LPC, PE and PG (25–100 mM) were made by dissolving these lipids in chloroform: methanol:water (65:35:8) (v:v:v) as advised by Avanti Lipids. The lipids were replenished every 1 to 3 days.
Time-lapse imaging.
Cells were plated sparsely in 12-well plates. If DOX was added, it was added 1 h before imaging. Cells were monitored with a 10 × objective using a Nikon TE2000 automated inverted microscope with incubation enclosure (37 °C, 5%CO2). MetaMorph acquision software was used to analyse the data.
Recombinant LACTB preparation.
The open-reading frame encoding LACTB was transferred into a Gateway-compatible version of the pCLNCX vector (Imgenex) containing C-terminal Flag and His tags and HEK293T cells were stably infected according to the manufacturer’s instructions. The LACTBR469K mutant was generated using the QuikChange Site Directed Mutagenesis kit (Stratagene). Cells were grown in DMEM with 10% fetal bovine serum at 37 °C with 5% CO2. Infected cells were selected with medium containing hygromycin (100 μg ml−1) and grown to 100% confluency (10 × 15-cm plates total). For isolation of LACTB, cells were washed two times with PBS and scraped. Cell pellets were then isolated by centrifugation at 1,400g for 3 min. The pellets were resuspended in RIPA buffer (5 ml, Cell Signaling Technology), sonicated, and debris was removed by centrifugation at 12,000g for 15 min. LACTB was then captured by incubation overnight with 300 μl of Anti-Flag M2 affinity gel (Sigma-Aldrich). The agarose gel was washed three times with PBS (5 ml), and LACTB was eluted with 1 ml of 150 ng μl−1 solution of 3× Flag peptide (Sigma-Aldrich) in PBS. Protein was then concentrated (and the Flag peptide removed) using an ultra-centrifugal filter unit (Amicon, 30 kDa cut-off) according to the manufacturer’s instructions. Protein concentration was determined using a protein assay kit (Bio-Rad). Glycerol was added to a final concentration of 10%, and proteins were aliquoted and stored at −80 °C until use.
LACTB in vitro substrate assay.
LACTB (15 nM final concentration) was added to a 96-well black, clear-bottom plate (Costar 3603) in 99 μl PBS. Substrates were dissolved in DMSO at 100 × the indicated concentration (see below) and 1 μl was added to each well. Reactions were incubated for 1 h at 25 °C while being read on a Spectramax M5 plate reader (Molecular Devices) using an excitation wavelength of 380 nm and an emission wavelength of 460 nm. To test for the cleavage of the substrates Ac-YVAD-AMC, A-AMC and VP-AMC, a final concentration of 100 μM of each substrate was used. To assess kinetics of Ac-YVAD-AMC cleavage, final substrate concentrations of 100, 33, 11, 3.7, 1.23, 0.41 and 0.14 μM were used. The initial reaction velocities for each concentration were fit to a nonlinear regression (Prism software).
Related to Extended Data Fig. 10g, recombinant LACTB (0.2 μg) was mixed with perforated mitochondria (1 μg) in PBS and incubated at 25 °C for 2 h.
[3H]serine labelling of phospholipids in cells.
MCF7-RAS and MCF7-RAS–Tet/ON-LACTB cells were plated on 6-cm dishes and treated with DOX for 48 h. Pulse medium (containing 20 ml DMEM, 10 μl DOX and 100 μl [3H]serine) was then added for 2, 4 and 6 h. The [3H]serine was purchased from Perkin Elmer (250 μCi per 250 μl). Cells were collected, lysed and lipids were extracted and dried. The resuspended lipid extract (50 or 75 μl) was applied to thin-layer chromatography plates (Millipore) and separated in the solvent system using chloroform:methanol:acetic acid:formic acid:water (70:30:12:4:1, v-v). Bands corresponding to standard PS and PE were scraped from the plates and radioactivity was measured by scintillation counting after overnight incubation at room temperature. The experiment was performed in triplicate.
Regarding Fig. 5b, of note, the amount of [3H]PS was not altered by LACTB expression. This is in agreement with numerous reports showing that the overall phospholipid levels of cells, including those of PS, are very tightly regulated41,42. As such, when PS levels increase, the rate of endogenous PS biosynthesis is quickly reduced in a compensatory manner.
Microarray analysis.
The microarrays used were Human and Mouse Agilent 4 × 44k arrays. Arrays were scanned using an Agilent scanner and the data was extracted using Agilent’s Feature Extraction software. Agilent two-colour arrays were normalized within-array by LOESS and between-arrays by quantile normalization of average intensities (Aquantile), as implemented by the limma package in Bioconductor. Replicate spots were averaged and then mean-centred to obtain log ratios. Human and mouse orthologues were obtained from Ensembl BioMart and Homologene.
Proliferation assay.
Proliferation of cells was assessed using the WST-1 Cell Proliferation Reagent (Roche Diagnostics 11644807001) according to the manufacturer’s protocol. Cells (1,000–3,000) were seeded in a flat-bottom 96-well plate. Four replicates were plated for each time point.
Proliferation of cells was also assessed by seeding cells in 10-cm Petri dishes and trypsinization and manual counting of cells, using either a haemocytometer or Vi-CELL XR Cell Viability analyser (Beckman Coulter), at indicated time points.
Statistical analysis and abbreviations.
All the data are presented as mean ± standard error of the mean (s.e.m.) unless specified otherwise. An unpaired two-tailed Student’s t-test was used to calculate the P values, except where specified otherwise. P < 0.05 was considered significant. *P < 0.05; **P < 0.01; ***P < 0.001; ****P < 0.0001. Abbreviations are described in Supplementary Table 6.
Data availability.
The microarray dataset was submitted to the Gene Expression Omnibus database (GSE72916). Source data for western blots, tumour data and LC–MS/MS experiments are included in the Supplementary Information. More detailed data and/or protocols are available upon request from the corresponding author.
Extended Data
Extended Data Figure 1 |. Identification of potential tumour suppressors.
a, Light-microscopy images of undifferentiated and differentiated human muscle progenitor cells and mouse C2C12 muscle progenitor cells. Scale bars, 200 μm. b, Immunofluorescence analysis of mouse C2C12 cells undergoing differentiation. Cells were stained with the marker of skeletal muscle differentiation α-actinin (green), the actin-staining agent phalloidin (red) and DAPI (blue). Scale bars, 30 μm. c, Qrt–PCR analysis of expression levels of several known tumour suppressors and cell-cycle inhibitors in differentiated human skeletal muscle cells confirming that these cells abundantly expressed a variety of tumour suppressors. All the values are relative to undifferentiated cells. GAPDH expression was used as a normalization control. Experiment was performed in duplicate. d, Microarray analysis of undifferentiated (UD) and differentiated (D) skeletal muscle cells of human and mouse origin (87 genes, P < 0.01, fold change >2). e, qRT–PCR analysis of mRNA levels of five candidate genes. Values are relative to undifferentiated human skeletal muscle progenitor cells. GAPDH expression was used as a normalization control. Experiment was performed in duplicate. f, Light-microscopy images of MCF7-RAS cells transduced with five DOX-inducible factors in the absence or presence of DOX. Images were taken after 12 days of DOX treatment in all groups except for the LACTB cells which were treated for 6 days with DOX. Scale bars, 200 μm. Data are mean ± s.e.m. (c, e).
Extended Data Figure 2 |. LACTB expression in normal and neoplastic cells.
a, qRT–PCR analysis of endogenous LACTB mRNA levels in non-tumorigenic (HME, MCF10A) and neoplastic breast cell lines. All values are relative to those in the non-tumorigenic HME cells. GAPDH expression was used as a normalization control. Experiment was performed in duplicate. Data are mean ± s.e.m. b, Immunofluorescence staining of LACTB in non-tumorigenic (MCF10A) and tumorigenic (MCF7-RAS) cell lines. Cells were stained with a mitochondrial marker (green), a LACTB marker (red) and DAPI (blue). See Supplementary Table 5 for details on antibodies. The experiment was performed in triplicate. c, Immunohistochemistry of LACTB protein levels (brown) in normal human mammary glands. d, Immunohistochemistry of endogenous LACTB expression levels (brown) in human breast cancer tissue sections. Shown is the amount of LACTB in a normal mammary gland and in the adjacent neoplastic mammary gland. BV, blood vessel; DCIS, ductal carcinoma in situ; invasive, invasive carcinoma (red dots), M, macrophages (yellow dots). e, Stratification of low and high levels of LACTB in human breast cancer clinical samples of different grade, size and nodal stage. f, Immunoblotting of exogenous LACTB protein in control cells (C) and cells in which LACTB was induced by DOX for 2 days (L). g, Annexin-V staining in non-tumorigenic (HME) and tumorigenic (HMLER, MCF7-RAS, HCC1806) cell lines upon LACTB induction. Numbers within the graphs represent percentages of gated cells. h, Immunofluorescence analysis of control MCF7-RAS cells mixed with MCF7-RAS–Tet/ON-LACTB cells, in which LACTB was induced for 3 days. Proliferation marker Ki-67 (green), LACTB (red) and DAPI (blue). Note the mutually exclusive Ki-67 and LACTB staining in these cells. Scale bars, 30 μm (b, h) and 100 μm (c, d).
Extended Data Figure 3 |. LACTB-induced effects on proliferation of breast cancer cells.
a, Proliferation curves of MCF7-RAS and HMLER cells that overexpressed wild-type (WT) LACTB and LACTB(R469K). b, Proliferation curves of SUM159 and MDA-MB-231 cells upon LACTB induction. c, Tet/ON-LACTB cells were injected (105 cells per injection for HCC1806 cells and 106 cells per injection for HMLER cells) into fat pads of female NOD/SCID mice. HCC1806 control tumours (n = 11), HCC1806 + LACTB tumours (n = 15). When the tumours reached approximately 5 mm in diameter, mice were randomly divided into two groups and DOX was added to one group. In vivo whole-mouse images are shown for HCC1806 tumours. Tumour weight and number of resulting tumours was measured at 3 weeks of DOX treatment. **P <0.01. d, Immunofluorescence analysis of tissue sections of control (MCF7-RAS) and MCF7-RAS–Tet/ON-LACTB tumours with 1 week (MCF7-RAS–Tet/ON-LACTB) or two weeks (control and MCF7-RAS–Tet/ON-LACTB) of DOX treatment. Tissues were stained for the cell-proliferation marker Ki-67 (green), LACTB (red) and with DAPI (blue). Note the mutually exclusive effects of LACTB induction on Ki-67 staining in the middle panel. Scale bars, 30 μm. e, Immunofluorescence analysis of tissue sections of MCF7-RAS and MCF7-RAS–Tet/ON-LACTB tumours in which DOX was added to both groups for 1 or 2 weeks. Tissues were stained with antibodies against a marker of apoptosis (cleaved caspase, white) and with DAPI (blue). Staining was quantified in 8–15 images for each group. *P > 0.05, **P < 0.01; NS, not significant. Scale bars, 30 μm. f, Haematoxylin and eosin staining of MCF7-RAS, HCC1806, and HMLER tumours without or with 2 or 3 weeks of in vivo LACTB induction. Scale bars, 200 μm. Data are mean ± s.e.m. (a–c, e).
Extended Data Figure 4 |. Collaboration between downregulated LACTB and oncogene expression in cellular transformation.
a, Immunoblotting of endogenous LACTB protein in HME cells transduced with different shRNA vectors directed against LACTB. Non-tumorigenic HME cells are included as a positive control and tumorigenic HMLER cells as a negative control for LACTB expression. Highlighted in red are the two LACTB shRNAs chosen for further study. b, Proliferation rates of HME cells transduced with different LACTB shRNAs. Data are mean ± s.e.m. c-e, Tumour incidence was monitored, by in vivo imaging, in non-tumorigenic HME cells and in HME cells transduced with shLACTB vectors (L-3 or B-3) with or without concominant expression of HRASG12V (c), MYCT58A (d) or the wild-type human HER2 oncogene (e). Mice were monitored at 6, 9 and 12 weeks after injection. IN, small indolent tumours that spontaneously regressed. f, g, h, Western blot analyses of RAS, MYC and wild-type HER2 expression levels in HME-derived cell lines compared to control HME cells.
Extended Data Figure 5 |. LACTB-induced effects on HMLER differentiation.
a, Light-microscopy images of HMLER and HME cells upon LACTB induction. Scale bars, 200 μm. b, qRT–PCR analysis of relative mRNA levels of mesenchymal, stem-cell and epithelial markers in tumorigenic HMLER and non-tumorigenic HME cells upon LACTB induction. All values are relative to control HMLER or HME cells in which LACTB was not induced. GAPDH expression was used as a normalization control. c, Frequency of cancer stem cells in control HMLER cells and in differentiated HMLER cells where LACTB was induced in vitro for two weeks. Cells were injected at limiting dilutions (1 × 10⁶, 5 × 10⁵, 1 × 10⁵) into fat pads of female NOD/SCID mice. Mice were euthanized 8 weeks after injection and tumour frequency and tumour diameter were calculated and measured. Diameters of tumours arising from the group injected with 1 × 10⁶ cells are shown. ***P<0.001. d, Proliferation curves of control HMLER cells and differentiated HMLER cells. e, Time-lapse images of HMLER–Tet/ON-LACTB CD44highCD24low single-cell clone 2 with (+DOX) or without (no DOX) LACTB induction. Scale bar, 200 μm. Videos of clones 1 and 2 can be found in the Supplementary Information. Data are mean ± s.e.m. (b, c).
Extended Data Figure 6 |. LACTB-induced effects on MCF7-RAS differentiation.
a, Light-microscopy images of control MCF7-RAS cells and two independently derived MCF7-RAS bulk populations that survived for 2 weeks with LACTB treatment and re-entered the proliferation cycle (LACTB survivor 1 and 2). LACTB survivor cells displayed more epithelial-like, differentiated morphology, characterized by tight cobblestone epithelial features. Scale bars, 200 μm. b, Flow cytometry analysis of levels of the epithelial differentiation marker (CD24) in control MCF7-RAS cells, MCF7-RAS cells in which LACTB was induced for 3 days and two independently derived MCF7-RAS bulk populations that survived for 2 weeks after LACTB treatment and re-entered the proliferation cycle (LACTB survivor 1 and 2). c, Proliferation curves of control MCF7-RAS cells and two independently derived MCF7-RAS bulk populations that survived for 2 weeks after LACTB induction and re-entered the proliferation cycle (LACTB survivor 1 and 2). d, Quantification of in vitro tumour sphere formation of control MCF7-RAS cells and two independently derived MCF7-RAS–LACTB survivor populations. Experiment was repeated twice. **P < 0.01; ***P < 0.001. Scale bars, 200 μm; data are mean ± s.e.m. e, In vivo tumorigenicity and cancer stem cell frequency of control MCF7-RAS cells and two independently derived MCF7-RAS–LACTB survivor populations. Cells were injected at limiting dilutions (1 × 10³, 1 × 10²) into fat pads of female NOD/SCID mice and tumour formation was monitored by in vivo imaging 8 weeks after injection.
Extended Data Figure 7 |. LACTB-induced effects on mitochondrial function.
a, Measurements of ATP levels in MCF7-RAS cells upon LACTB induction. b, Measurements of ROS levels in MCF7-RAS cells upon LACTB induction. Numbers within the graphs represent percentages of gated cells. c, Measurements of mitochondrial membrane potential, through incorporation of the cyanine dye DiIC1(5), by flow cytometry in MCF7-RAS cells upon LACTB induction. Numbers within the graphs represent percentages of gated cells. d, Immunofluorescence analysis of control MCF7-RAS cells mixed with MCF7-RAS–Tet/ON-LACTB cells, where LACTB was induced by addition of DOX for 1 day. Cells were stained with a mitochondrial marker (green), a LACTB marker (red) and DAPI (blue). Mitochondrial signal per area in control cells (n = 16) and in LACTB-expressing cells (n = 17) was calculated using ImageJ software. NS, not significant (P > 0.05). Scale bar 30 μm. e, Western blot analysis of sub-fractionated control MCF7-RAS cells and MCF7-RAS–Tet/ON-LACTB-expressing cells with 24 h of DOX treatment. CYT, cytosolic fraction, MITO, mitochondrial fraction. Membranes were probed for proteins involved in mitochondrial fusion (OPA1, MFN1, MFN2), fission (FISI, DRP1), composition of respiratory chain (individual OXPHOS components) and control antibodies: LACTB (to show the proper induction and localization of LACTB), actin (cytosolic marker) and COX4 (mitochondrial marker). The membrane presented here was also used in Fig. 5a, where it was probed with a different set of antibodies. Therefore the signal for the control antibodies is shared between these two figures. f, Electron microscopy images of mitochondria in control MCF7-RAS cells or MCF7-RAS cells where LACTB was induced for 1 or 3 days. Arrows indicate mitochondria. Scale bars, 600 nm. Data are mean ± s.e.m. (a, d).
Extended Data Figure 8 |. The role of PISD in LACTB mechanism.
a, Measurement of DNA synthesis (through EdU incorporation) in MCF7-RAS–Tet/ON-LACTB cells upon LACTB induction with or without supplementation of growth medium with 20 μM LPE. b, LC–MS/MS analysis of mitochondrial LPE levels upon supplementation of MCF7-RAS cells with 20 μM LPE for 24 h. c, Expression levels of the differentiation marker CD24 in MCF7-RAS and HMLER cells upon LACTB induction for 6 and 9 days, respectively, with or without supplementation of growth medium with 20 μM LPE. d, Raw western blot image showing PISD subcellular location and levels in sub-fractionated MCF7-RAS and MCF7-RAS–Tet/ON-LACTB cells (related to Fig. 5a). DOX was added to both cell lines for 24 h. e, qRT–PCR analysis of mRNA levels of LACTB and PISD in control MCF7-RAS cells and MCF7-RAS cells in which LACTB was induced for 3 days. GAPDH expression was used as a normalization control. f, Time-course analysis of levels of LACTB and PISD in control MCF7-RAS and MCF7-RAS–Tet/ON-LACTB cells in which LACTB was induced by addition of DOX for the indicated times. In control MCF7-RAS cells DOX was added for 3 days. Also shown are the PISD and LACTB levels in MCF7-RAS–Tet/ON-LACTB differentiated survivor cell populations 1 and 2 where DOX was added for 24 h. g, Related to Fig. 5b. MCF7-RAS cells (C) and MCF7-RAS–Tet/ON-LACTB cells (L) were incubated with DOX for 48 h. [3H]serine-containing medium was then added for 2, 4 or 6 h. A portion of cell lysate was analysed by immunoblotting to confirm expression of LACTB, downregulation of PISD and equal protein levels in the samples (by calnexin). Data are mean ±s.e.m. (b, e).
Extended Data Figure 9 |. The role of PISD in LACTB mechanism.
a, Western blot analysis of control MCF7-RAS cells and MCF7-RAS cells transfected for 48 h with four different PISD siRNAs. b, The proliferation ability of MCF7-RAS cells transfected with different PISD siRNAs was measured by EdU staining using fluorescence-activated cell sorting. c, Control MCF7-RAS and MCF7-RAS–Tet/ON-LACTB cells were treated with DOX for two days with or without concominant transfection with four different PISD siRNAs. The proliferation ability of the cells was measured by EdU staining using fluorescence-activated cell sorting. The rectangle represents the gate containing proliferative cells. d, LACTB and PISD protein levels in mitochondrial fractions of control MCF7-RAS cells and MCF7-RAS cells with one day of wild-type LACTB or LACTB(R469K) induction. e, LC–MS/MS analysis of mitochondrial PE and LPE species (that were shown to be downregulated upon wild-type LACTB induction) in control MCF7-RAS cells and MCF7-RAS cells where the LACTBR469K mutant was induced for 24 h. Values are shown in Supplementary Table 2. f, Proliferation curves of HMLER and HCC1806 cells upon addition of 0.05 μg ml−1 DOX. g, LACTB and PISD levels in non-tumorigenic HME and tumorigenic HMLER and HCC1806 cells upon addition of 0.05 μg ml−1 DOX. h, LC–MS/MS analysis of mitochondrial PE, LPE and cardiolipin (CL) species in control HMLER cells and HMLER cells where lower levels of LACTB were induced, by addition of 05 μg ml−1 DOX for 24 h. Values are shown in Supplementary Table 2. i, Fluorescence-activated cell sorting analysis of CD44 levels in HMLER and HMLER-Tet/ON-LACTB upon addition of 0.05 μg ml−1 DOX for 14 days.
Extended Data Figure 10 |. LACTB mutagenesis.
a, Related to Fig. 5c. Velocity of the ac-YVAD-AMC enzymatic reaction in relation to substrate concentration for wild-type LACTB and mutant LACTB(R469K). b, Comparison of amino acid sequence of wild-type (WT) LACTB, LACTB(S164I) (catalytic site LACTB mutant, where an essential serine residue was replaced by an isoleucine, labelled in image as dS LACTB) and LACTB(Δ1−97) (mitochondrial localization mutant, labelled in the image as d1–97LACTB. as described in ref. 8). Only a partial sequence of LACTB is shown. The points of the mutation of LACTB(S164I) and LACTB(Δ1–97) are highlighted in red and marked by a red star symbol. The blue star symbol marks the site of the R469K mutation in endogenous LACTB from MCF7-RAS and SUM159 cells. The green star symbol marks the site of a notable substrate docking site in LACTB. c, Immunofluorescence analysis of MCF7-RAS–Tet/ON-LACTB(S164I) and MCF7-RAS–Tet/ON-LACTB(Δ1−97) cells, where DOX was added for 24 h. Cells were stained with mitochondrial marker (green), a LACTB marker (red) and DAPI (blue). Scale bars, 30 μm. d, Western blot analysis of expression levels of LACTB in control MCF7-RAS cells and MCF7-RAS–Tet/ON-LACTB (wild-type LACTB, LACTB(S164I), LACTB(Δ1−97), LACTB(ΔSISK)) cells where DOX was added for 24 h. The LACTB(ΔSISK) mutant contains a deletion of 4 amino acid residues in catalytic site of LACTB. The expression level of this mutant was unstable, therefore we did not include this mutant in our study. e, Proliferation rates of control MCF7-RAS cells and MCF7-RAS–Tet/ON-LACTB (wild-type LACTB, LACTB(S164I), LACTB(Δ1−97)) cells upon addition of DOX for the indicated number of days. Pictures were taken at six days of DOX induction. Scale bars, 200 μm. f, Western blot analysis of PISD expression in mitochondria isolated from MCF7-RAS and MCF7-RAS–Tet/ON-LACTB (wild-type LACTB and LACTB(S164I)) cells where DOX was added for 24 h to all groups. g, Western blot analysis of PISD levels after in vitro incubation of permeabilized mitochondria (isolated from MCF7-RAS cells) with or without addition of recombinant LACTB (isolated from HEK293T cells). h, Graphical abstract. LACTB induction leads to a change in cancer cell state. As such, a proliferative, less differentiated cancer cell turns into a non-tumorigenic differentiated cancer cell upon LACTB induction. This is characterized by an initial disappearance of the proliferation marker Ki-67, followed by downregulation of the stem-cell marker CD44 and increased expression of the differentiated epithelial markers CD24 and EPCAM. This is achieved through the ability of LACTB to decrease the protein expression levels of the mitochondrial enzyme PISD and subsequent changes in mitochondrial PE and/or LPE levels.
Supplementary Material
Acknowledgements
We thank K.-J. Kah for the FUW-LPT2 plasmid, T DiCesare for graphical assistance with Extended Data Fig. 10h, R. Bronson for histopathology analysis, B. Yuan for statistical analysis, N. Watson for electron microscopy analysis, G. Daum, M. Spinazzi, A. Jourdain for discussions, members of the Weinberg laboratory for comments, the Whitehead Institute Flow Cytometry and Keck Imaging Facilities, MIT Koch Institute Histology and Animal Imaging Facilities and Ludwig Center for Molecular Oncology at MIT This work was supported by grants from NIH R01 CA078461, Samuel Waxman Cancer Research Foundation, Josie Robertson Foundation and the MSKCC Core Grant (P30 CA008748) (D.A.B.). R.A.W. is an American Cancer Society research professor and a Daniel K. Ludwig Foundation cancer research professor
Reviewer Information Nature thanks J. Chipuk and the other anonymous reviewer(s) for their contribution to the peer review of this work
Footnotes
Online Content Methods, along with any additional Extended Data display items and Source Data, are available in the online version of the paper; references unique to these sections appear only in the online paper.
Supplementary Information is available in the online version of the paper
References
- 1.Seely S Possible reasons for the high resistance of muscle to cancer. Med. Hypotheses 6, 133–137 (1980). [DOI] [PubMed] [Google Scholar]
- 2.Walsh K & Perlman H Cell cycle exit upon myogenic differentiation. Curr. Opin. Genet. Dev 7, 597–602 (1997). [DOI] [PubMed] [Google Scholar]
- 3.Lassar AB, Skapek SX & Novitch B Regulatory mechanisms that coordinate skeletal muscle differentiation and cell cycle withdrawal. Curr. Opin. Cell Biol 6, 788–794 (1994). [DOI] [PubMed] [Google Scholar]
- 4.Kasid A, Lippman ME, Papageorge AG, Lowy DR & Gelmann E P Transfection of v-rasH DNA into MCF-7 human breast cancer cells bypasses dependence on estrogen for tumorigenicity. Science 228, 725–728 (1985). [DOI] [PubMed] [Google Scholar]
- 5.Smith TS et al. Identification, genomic organization, and mRNA expression of LACTB, encoding a serine β-lactamase-like protein with an amino-terminal transmembrane domain. Genomics 78, 12–14 (2001). [DOI] [PubMed] [Google Scholar]
- 6.Peitsaro N et al. Evolution of a family of metazoan active-site-serine enzymes from penicillin-binding proteins: a novel facet of the bacterial legacy. BMC Evol. Biol 8, 26 (2008). [DOI] [PMC free article] [PubMed] [Google Scholar]
- 7.Mootha VK et al. Integrated analysis of protein composition, tissue diversity, and gene regulation in mouse mitochondria. Cell 115, 629–640 (2003). [DOI] [PubMed] [Google Scholar]
- 8.Polianskyte Z et al. LACTB is a filament-forming protein localized in mitochondria. Proc. Natl Acad. Sci. USA 106, 18960–18965 (2009). [DOI] [PMC free article] [PubMed] [Google Scholar]
- 9.Pagliarini DJ et al. A mitochondrial protein compendium elucidates complex I disease biology. Cell 134, 112–123 (2008). [DOI] [PMC free article] [PubMed] [Google Scholar]
- 10.Chen Y et al. Variations in DNA elucidate molecular networks that cause disease. Nature 452, 429–435 (2008). [DOI] [PMC free article] [PubMed] [Google Scholar]
- 11.Yang X et al. Validation of candidate causal genes for obesity that affect shared metabolic pathways and networks. Nat. Genet 41, 415–423 (2009). [DOI] [PMC free article] [PubMed] [Google Scholar]
- 12.Kim SC et al. Substrate and functional diversity of lysine acetylation revealed by a proteomics survey. Mol. Cell 23, 607–618 (2006). [DOI] [PubMed] [Google Scholar]
- 13.Lee J et al. Mitochondrial phosphoproteome revealed by an improved IMAC method and MS/MS/MS. Mol. Cell. Proteomics 6, 669–676 (2007). [DOI] [PMC free article] [PubMed] [Google Scholar]
- 14.Bogert van den C, Holtrop M, Melis TE, Roefsema PR & Kroon AM Different effects of oxytetracycline and doxycycline on mitochondrial protein synthesis in rat liver after long-term treatment. Biochem. Pharmacol 36, 1555–1559 (1987). [DOI] [PubMed] [Google Scholar]
- 15.Ahler E et al. Doxycycline alters metabolism and proliferation of human cell lines. PLoS One 8, e64561 (2013). [DOI] [PMC free article] [PubMed] [Google Scholar]
- 16.Moullan N et al. Tetracyclines disturb mitochondrial function across eukaryotic models: a call for caution in biomedical research. Cell Rep 15, 180–181 (2015). [DOI] [PMC free article] [PubMed] [Google Scholar]
- 17.Hahn WC et al. Creation of human tumour cells with defined genetic elements. Nature 400, 464–468 (1999). [DOI] [PubMed] [Google Scholar]
- 18.DuPage M, Dooley AL & Jacks T Conditional mouse lung cancer models using adenoviral or lentiviral delivery of Cre recombinase. Nat. Protoc 4, 1064–1072 (2009). [DOI] [PMC free article] [PubMed] [Google Scholar]
- 19.Feldser DM et al. Stage-specific sensitivity to p53 restoration during lung cancer progression. Nature 468, 572–575 (2010). [DOI] [PMC free article] [PubMed] [Google Scholar]
- 20.McFadden DG et al. p53 constrains progression to anaplastic thyroid carcinoma in a Braf-mutant mouse model of papillary thyroid cancer. Proc. Natl Acad. Sci. USA 111, E1600–E1609 (2014). [DOI] [PMC free article] [PubMed] [Google Scholar]
- 21.Wellner U et al. The EMT-activator ZEB1 promotes tumorigenicity by repressing stemness-inhibiting microRNAs. Nat. Cell Biol 11, 1487–1495 (2009). [DOI] [PubMed] [Google Scholar]
- 22.Chaffer CL et al. Poised chromatin at the ZEB1 promoter enables breast cancer cell plasticity and enhances tumorigenicity. Cell 154, 61–74 (2013). [DOI] [PMC free article] [PubMed] [Google Scholar]
- 23.Riekhof WR & Voelker DR Uptake and utilization of lyso-phosphatidylethanolamine by Saccharomyces cerevisiae. J. Biol. Chem 281, 36588–36596 (2006). [DOI] [PubMed] [Google Scholar]
- 24.Riekhof WR, Wu J, Jones JL & Voelker DR Identification and characterization of the major lysophosphatidylethanolamine acyltransferase in Saccharomyces cerevisiae. J. Biol. Chem 282, 28344–28352 (2007). [DOI] [PubMed] [Google Scholar]
- 25.Tasseva G et al. Phosphatidylethanolamine deficiency in mammalian mitochondria impairs oxidative phosphorylation and alters mitochondrial morphology. J. Biol. Chem 288, 4158–4173 (2013). [DOI] [PMC free article] [PubMed] [Google Scholar]
- 26.Vance JE & Tasseva G Formation and function of phosphatidylserine and phosphatidylethanolamine in mammalian cells. Biochim. Biophys. Acta 1831, 543–554 (2013). [DOI] [PubMed] [Google Scholar]
- 27.Bachovchin DA et al. A high-throughput, multiplexed assay for superfamily-wide profiling of enzyme activity. Nat. Chem. Biol 10, 656–663 (2014). [DOI] [PMC free article] [PubMed] [Google Scholar]
- 28.Fotheringham J et al. Lysophosphatidylethanolamine acyltransferase activity is elevated during cardiac cell differentiation. Biochim. Biophys. Acta 1485, 1–10 (2000). [DOI] [PubMed] [Google Scholar]
- 29.Nishina A et al. Lysophosphatidylethanolamine in Grifola frondosa as a neurotrophic activator via activation of MAPK. J. Lipid Res 47, 1434–1443 (2006). [DOI] [PubMed] [Google Scholar]
- 30.Ryu SB, Karlsson BH, Ozgen M & Palta JP Inhibition of phospholipase D by lysophosphatidylethanolamine, a lipid-derived senescence retardant. Proc. Natl Acad. Sci. USA 94, 12717–12721 (1997). [DOI] [PMC free article] [PubMed] [Google Scholar]
- 31.Komati H et al. Phospholipase D is involved in myogenic differentiation through remodeling of actin cytoskeleton. Mol. Biol. Cell 16, 1232–1244 (2005). [DOI] [PMC free article] [PubMed] [Google Scholar]
- 32.Jaafar R et al. Phospholipase D regulates myogenic differentiation through the activation of both mTORC1 and mTORC2 complexes. J. Biol. Chem 286, 22609–22621 (2011). [DOI] [PMC free article] [PubMed] [Google Scholar]
- 33.Rubin JB et al. A small-molecule antagonist of CXCR4 inhibits intracranial growth of primary brain tumors. Proc. Natl Acad. Sci. USA 100, 13513–13518 (2003). [DOI] [PMC free article] [PubMed] [Google Scholar]
- 34.Theurillat JP et al. NY-ESO-1 protein expression in primary breast carcinoma and metastases: correlation with CD8+ T-cell and CD79a+ plasmacytic/B-cell infiltration. Int. J. Cancer 120, 2411–2417 (2007). [DOI] [PubMed] [Google Scholar]
- 35.Goldhirsch A et al. Strategies for subtypes—dealing with the diversity of breast cancer: highlights of the St. Gallen international expert consensus on the primary therapy of early breast cancer 2011. Ann. Oncol 22, 1736–1747 (2011). [DOI] [PMC free article] [PubMed] [Google Scholar]
- 36.Cifone MA & Fidler IJ Correlation of patterns of anchorage-independent growth with in vivo behavior of cells from a murine fibrosarcoma. Proc. Natl Acad. Sci. USA 77, 1039–1043 (1980). [DOI] [PMC free article] [PubMed] [Google Scholar]
- 37.Hu C et al. RPLC-ion-trap-FTMS method for lipid profiling of plasma: method validation and application to p53 mutant mouse model. J. Proteome Res 7, 4982–4991 (2008). [DOI] [PubMed] [Google Scholar]
- 38.Bird SS, Marur VR, Sniatynski MJ, Greenberg HK & Kristal BS Serum lipidomics profiling using LC-MS and high-energy collisional dissociation fragmentation: focus on triglyceride detection and characterization. Anal. Chem 83, 6648–6657 (2011). [DOI] [PMC free article] [PubMed] [Google Scholar]
- 39.Ruzicka J, McHale KJ & Peake DA Data acquisition parameters optimization of quadrupole orbitrap for global lipidomics on LC–MS/MS time frame. Am. Soc. Mass Spectrom (2014). [Google Scholar]
- 40.Park KS et al. Lysophosphatidylethanolamine stimulates chemotactic migration and cellular invasion in SK-OV3 human ovarian cancer cells: involvement of pertussis toxin-sensitive G-protein coupled receptor. FEBS Lett 581, 4411–4416 (2007). [DOI] [PubMed] [Google Scholar]
- 41.Nishijima M, Kuge O & Akamatsu Y Phosphatidylserine biosynthesis in cultured Chinese hamster ovary cells. I. Inhibition of de novo phosphatidylserine biosynthesis by exogenous phosphatidylserine and its efficient incorporation. J. Biol. Chem 261, 5784–5789 (1986). [PubMed] [Google Scholar]
- 42.Kuge O, Hasegawa K, Saito K & Nishijima M Control of phosphatidylserine biosynthesis through phosphatidylserine-mediated inhibition of phosphatidylserine synthase I in Chinese hamster ovary cells. Proc. Natl Acad. Sci. USA 95, 4199–4203 (1998). [DOI] [PMC free article] [PubMed] [Google Scholar]
Associated Data
This section collects any data citations, data availability statements, or supplementary materials included in this article.
Supplementary Materials
Data Availability Statement
The microarray dataset was submitted to the Gene Expression Omnibus database (GSE72916). Source data for western blots, tumour data and LC–MS/MS experiments are included in the Supplementary Information. More detailed data and/or protocols are available upon request from the corresponding author.


