

Abstract
The tumor microenvironment is a key determinant of cancer cell biology. The microenvironment is a complex mixture of tumor cells, stromal cells, and proteins, extracellular matrix, oxygen tension, and pH levels surrounding the cells that regulate the tumor progress. This study identified the prognostic factors associated with hepatocellular carcinoma (HCC) and MCT4 and GLUT1 expression levels in HCC specimens. In this study, we analyzed MCT4 and GLUT1 expression levels in tissue samples from 213 patients with HCC by immunohistochemical analyses and in HCC tumor tissues and matched adjacent nonneoplastic tissues by quantitative real‐time PCR. We conducted a prognostic analysis of the overall survival (OS) and time to recurrence (TTR) using immunoreactivity and other common clinical and pathological parameters. All variables with prognostic impact were further analyzed by multivariate analysis. We found that MCT4 and GLUT1 expression levels were significantly higher in tumor tissues than in adjacent nontumor tissues, and they were positively correlated with tumor size. Survival analysis showed that patients with high expression levels of MCT4 or GLUT1 had a poor OS and TTR. In patients with HCC, MCT4 expression was an independent negative prognostic factor for OS (hazard ratio [HR] = 1.617; 95% confidence interval [CI] = 1.102–2.374; P = 0.014), and metabolic indicators were independent prognostic factors for OS (HR = 1.617, 95% CI = 1.102−2.374, P = 0.006) and TTR (HR = 1.348, 95% CI = 1.079−1.685, P = 0.009). Interestingly, patients with positive metabolic indicator expression in tumor cells had a significantly shorter OS and earlier TTR than those with negative metabolic indicator expression in tumor cells in the ≤5 cm and >5 cm subgroups. In summary, using the expression of MCT4 and GLUT1 and their metabolic parameters to determine the metabolic status of tumors is promising for predicting the prognosis of patients with HCC.
Keywords: GLUT1, hepatocellular carcinoma, MCT4, prognosis
Introduction
Hepatocellular carcinoma (HCC) is one of the most common malignant tumors in the world, and its morbidity and mortality increase each year 1. In recent years, many advances in medical technology have been made, but liver cancer treatment commonly comprises surgical resection combined with radiofrequency ablation, interventional embolization, and targeted molecular therapies 2, 3, 4. However, most patients miss their opportunity to receive radical treatment because they have already reached an advanced stage of liver cancer by their first visit 5, 6. Therefore, it is of great importance to further explore the pathogenesis of HCC and to determine highly selective therapeutic targets for HCC prognosis to facilitate clinical HCC studies and improve the efficacy of HCC treatment.
Like many other solid cancers, the role of the tumor cell microenvironment is considered to be key in HCC development 7. With the exception of the traditional oxidative oxidation of glucose to pyruvate via the mitochondrial tricarboxylic acid cycle, the energy required for cancer cells comes from the anaerobic glycolysis of glucose 8. In this process, glucose is converted to lactate by lactate dehydrogenase in cancer cells (Warburg effect) 9. The formation and regeneration of hepatocellular lesions, as well as neovascularization, are also closely linked to hepatocyte anaerobic glycolysis 10. Lactate efflux occurs through the lactate‐activated transcription factor hypoxia‐induced factor 1α (HIF1α), which induces glucose transporter 1 (GLUT1), LDH‐A, and monocarboxylate transporters 11, 12, particularly monocarboxylic acid transporter 4 (MCT4) 13. The maintenance of glycolysis requires continuous lactic acid excretion from the cells by a group of monocarboxylic acid transporters; in this process, MCT4 promotes the transport of short‐chain carbohydrates, such as pyruvate and lactate, to maintain intracellular pH levels and glycolysis 14. MCT4 is highly expressed in lung cancer, renal cell carcinoma 15, breast cancer 16, and pancreatic cancer 17, and high levels of MCT4 expression are associated with a high apoptotic index 18.
In this study, we evaluated the metabolic status of HCC tissues by assessing MCT4 and GLUT1 expression. We also analyzed the prognostic significance of the expression of these transporters in patients with HCC.
Materials and Methods
Patients and samples
This study was performed strictly in accordance with the Helsinki Declaration. The Sun Yat‐sen University Cancer Center Research Ethics Committee approved this study, and all patients provided informed consent. Tumor and matched adjacent nontumorous tissues were consecutively collected from 213 patients with HCC during curative resection from December 2002 to November 2010 at Sun Yat‐sen University Cancer Center (Guangzhou, China). Diagnostic criteria were used to assess the postoperative pathology and were based on the criteria of the European Association for the Study of the Liver (EASL) and the European Organisation for Research and Treatment of Cancer (EORTC). All patients had complete medical history data. The criteria for inclusion in the study were as follows: (1) no anticancer treatment or distant metastasis prior to surgery; (2) no concurrent autoimmune diseases, HIV, or syphilis; and (3) follow‐up data were available. Patients classified as Child–Pugh class B or C were excluded from our study, as well as patients who had radical liver cancer surgery. Detailed clinicopathological parameters are listed in Table 1.
Table 1.
Clinical characteristics of patients with hepatocellular carcinoma
| Clinicopathological variable | Median (range) | No. of patients | % |
|---|---|---|---|
| Age (year) | 50 (16–77) | ||
| Gender | |||
| Female | 31 | 14.6 | |
| Male | 182 | 85.4 | |
| HBsAg | |||
| Negative | 31 | 14.6 | |
| Positive | 182 | 85.4 | |
| Serum AFP (ng/mL) | 172.7 (0–121000.0) | ||
| Tumor size (cm) | 6.4 (1.6–15.6) | ||
| Tumor number | |||
| Solitary | 148 | 69.5 | |
| Multiple | 65 | 30.5 | |
| Microvascular invasion | |||
| No | 172 | 80.8 | |
| Yes | 41 | 19.2 | |
| Differentiation grade | |||
| I | 15 | 7.0 | |
| II | 104 | 48.8 | |
| III | 90 | 42.3 | |
| IV | 4 | 1.9 | |
| BCLC stage | |||
| 0 | 4 | 1.9 | |
| A | 167 | 78.4 | |
| B | 30 | 14.1 | |
| C | 12 | 5.6 | |
| TNM stage | |||
| I | 137 | 64.3 | |
| II | 42 | 19.7 | |
| III | 34 | 16.0 | |
| AST (μ/L) | 51.9 (12.3–182.6) | ||
| ALT (μ/L) | 47.3 (5.6–168.4) | ||
| Liver cirrhosis | |||
| No | 98 | 46.0 | |
| Yes | 115 | 54.0 | |
AFP, alpha‐fetoprotein; BCLC, Barcelona Clinic Liver Cancer; AST, aspartate transaminase; ALT, alanine transaminase.
A total of 66 pairs of resected HCC and adjacent nonneoplastic liver tissues were collected from patients who had undergone hepatectomies for the curative treatment of HCC at the Cancer Center of SYSU from 2012 to 2014. None of the patients received neoadjuvant therapies, such as radiotherapy or chemotherapy, before surgery. Informed consent was obtained from patients regarding the use of their liver specimens for research.
Follow‐up
The average postoperative follow‐up time in our study was 60.74 months. The longest postoperative follow‐up time was 126 months. Our primary study endpoint was the last follow‐up without recurrence or death. Overall survival (OS) was defined as the time until postoperative death or the last follow‐up. Time to recurrence (TTR) was defined as the interval between surgery and recurrence or between surgery and the last follow‐up for patients without recurrence. Postoperative follow‐up included abdominal ultrasound examinations or computed tomography studies every 3 months, serum alpha‐fetoprotein (AFP) measurements every 1–3 months, and hepatic artery angiography, bone imaging, or chest CT examination if necessary. If cancer recovery is to be achieved, it is considered necessary to use various treatments, including repeated hepatectomy, transcatheter arterial embolization, percutaneous ablation, and radiotherapy 19.
Immunohistochemistry
Resected surgical specimens were fixed in formalin and embedded in paraffin. Then, the specimens were cut into 4‐μm sections and placed onto glass slides. The sections were sequentially dehydrated with xylene, paraffin, and ethanol and then rehydrated with a graded series of alcohol. Next, the tissue slides were treated with fresh 0.3% hydrogen peroxide solution for 10 min to block the endogenous peroxidase and subjected to antigen repair in 0.01 mol/L sodium citrate buffer (pH 6.0) for 25 min using a microwave oven.
The sections were then incubated with anti‐MCT4 antibody (1:500 dilution; Santa Cruz, Cat. # sc‐376101, Delaware Ave, CA, USA) or anti‐GLUT1 antibody (1:500 dilution; Abcam, Cat. # ab652, Cambridge, U.K.) overnight at 4°C. Next, the tissue sections were incubated with HRP‐labeled anti‐mouse/rabbit secondary antibody (Dako, Cat. # K5007, Glostrup, Denmark) for 1 h at room temperature. The reaction product was visualized using a nonbiotin horseradish peroxidase assay system according to the manufacturer's protocol, and the brown color indicates positive staining. All sections were counterstained with Mayer's hematoxylin and fixed in nonaqueous fixative.
H‐score 20 was used for semiquantitative analysis of immunoreactivity of MCT4 and GLUT1. The score was obtained using the formula: 3 × percentage of strongly staining +2 × percentage of moderately staining +1 × percentage of weakly staining, giving a range of 0–300. Positive immunoreactivity was defined as H‐score>0. Score was independently obtained by two of different professional pathologists who were blinded to the clinical data.
RNA isolation and quantitative real‐time PCR
Total RNA was isolated from tissues and cell lines using TRIzol reagent (Invitrogen Life Technologies, Carlsbad, CA, USA). RNA (2 μg) was reverse‐transcribed using a SuperScript® III First‐Strand Synthesis System (Invitrogen Life Technologies) according to the manufacturer's instructions. For real‐time PCR assays, cDNA was subjected to PCR amplification using SYBR Green (Toyobo, Kita‐Ku, Osaka, Japan) and a Roche LightCycler 480 System. GAPDH was used as an internal control. The primers were as follows:
MCT4
Forward: GTCATCTCTCTGCCCCACAT
Reverse: AGCACGGTCAATGAGAACAA
GLUT1
Forward: TTATTGCCCAGGTGTTCGGC
Reverse: GTAGCAGGGCTGGGATGAAG
GAPDH
Forward: GGTATGACAACGAATTTGGC
Reverse: GAGCACAGGGTACTTTATTG
Statistical analysis
IBM SPSS (version 22; IBM Corporation, Armonk, NY, USA) and GraphPad Prism (version 7; GraphPad Software, La Jolla, CA, USA) were used for statistical analyses. OS and TTR curves were generated according to the Kaplan–Meier method, and the differences between the curves were analyzed by log‐rank test. Using the Cox proportional hazards model, significant prognostic factors determined by univariate analysis were entered into the multivariate analysis. The relationship between MCT4/GLUT1 expression and various clinicopathological parameters was analyzed by chi‐square test or Fisher's exact test. Pearson correlation analysis was used to analyze the correlation between MCT4 and GLUT1 staining scores. The results were considered statistically significant at P < 0.05.
Results
GLUT1 and MCT4 expression in HCC tumors and nontumor tissues
Immunohistochemical (IHC) staining was used to determine the expression of MCT4 and GLUT1 in 213 HCC samples (tumor and adjacent nontumor tissues). We found clear and distinguishable membrane staining for both MCT4 and GLUT1 in tumor tissue but weakened staining in the adjacent hepatocytes (Fig. 1A and B). MCT4 expression was significantly higher in tumor tissues (median score = 68.0) than in adjacent nontumor tissues (median score = 0.0; P < 0.001; Fig. 1C). Similar results were found for GLUT1 (median score: tumor tissues [T] = 43.0, nontumor tissues [N] = 9.0; P < 0.001; Fig. 1D). These data indicate that GLUT1 expression and MCT4 expression are upregulated during tumorigenesis.
Figure 1.
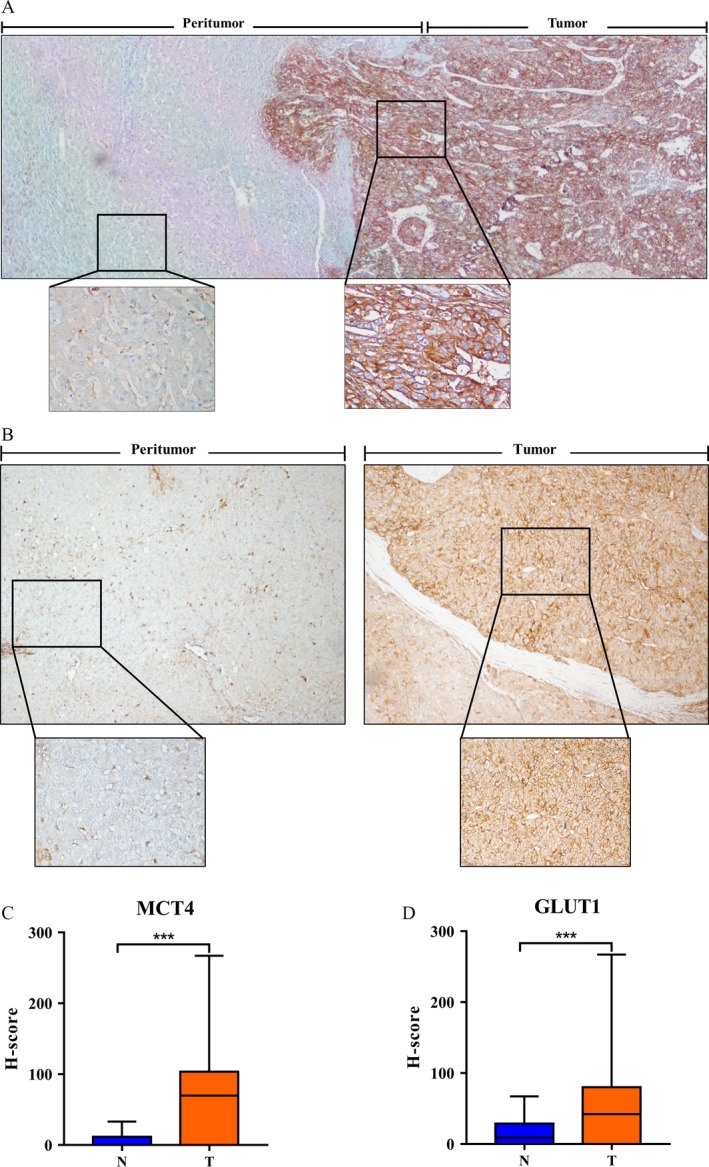
IHC characteristics of MCT4 and GLUT1 in HCC specimens. (A, B) IHC assays of MCT4 (A) and GLUT1 (B) expression in tumor (T) and adjacent nontumor tissues (N). (A) MCT4 expression levels in the tumor (T) tissues are significantly higher than those in the adjacent nontumor tissues (N) (40×). The bottom panel shows an enlargement of the indicated area (200×). (B) GLUT1 expression levels in the tumor (T) tissues are significantly higher than those in the adjacent nontumor tissues (N) (40×). The bottom panel shows an enlargement of the indicated area (200×). (C, D) MCT4 (C) and GLUT1 (D) expression levels in tumor (T) tissue are significantly higher than those in adjacent nontumor tissue (N). The IHC H‐scores are shown as mean with range (bars); *** indicates P < 0.01.
MCT4/GLUT1 expression and its correlation with clinicopathological features
Table 1 summarizes the clinicopathological features of 213 patients with HCC. The median follow‐up time was 60.74 months (range, 1.6–126 months). During follow‐up, 118 (55.4%) patients died, and 104 (48.8%) patients were diagnosed with tumor recurrence. The median OS and TTR for patients were 61.6 and 22.2 months, respectively. Patients were divided into two groups according to the level of MCT4 and GLUT1 expression. The cutoff value of MCT4 and GLUT1 expression was 87.25 and 57.75, respectively, as determined by the receiver operating characteristic (ROC) curve. High expression levels of MCT4 and GLUT1 were present in 47.4% (101/213) and 59.2% (126/213) of all cases. To further evaluate the GLUT1/MCT4 expression patterns in HCC tumor tissues and adjacent nonneoplastic tissues, we also examined their levels in 66 pairs of matched HCC tumor and nontumor specimens by quantitative real‐time PCR. We found that the expression levels of MCT4 were remarkably higher in the HCC tumor tissues than in the matched adjacent nonneoplastic tissues (Fig. 2B). Moreover, the MCT4 mRNA levels in tumor tissues were significantly higher in patients with a tumor diameter >5 cm than in those with a tumor diameter ≤5 cm (P < 0.01; Fig. 2B). GLUT1 mRNA levels were also significantly higher in patients with bigger tumors than in those with smaller tumors (P < 0.05; Fig. 2C). Besides, the expression level of MCT4 mRNA was dissimilar in different Barcelona Clinic Liver Cancer (BCLC) stages of tumor tissue (P < 0.05; Fig. 2B).
Figure 2.
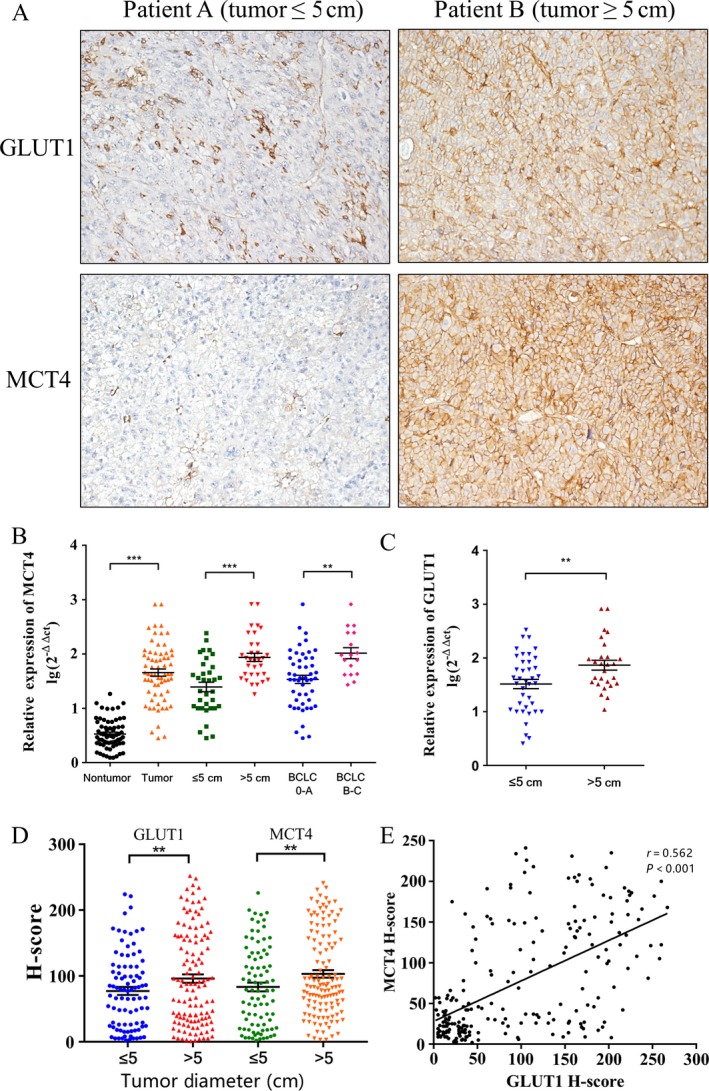
Association between the expression levels of GLUT1 and MCT4 with clinicopathological features. (A) IHC staining for GLUT1 and MCT4 in patients with tumor diameters less than or greater than 5 cm. (B, C) Quantitative real‐time PCR was used to determine the relative MCT4 expression in 66 pairs of HCC tumors and matched nontumor tissues, the correlation between tumor size as well as BCLC stage and MCT4 expression levels, and the correlation between tumor size and GLUT1 expression. Each point represents a sample. (B) MCT4 levels in HCC tissues were significantly higher than those in nontumor tissues (left two columns), and MCT4 was more highly expressed (middle two columns) in tumor samples larger than 5 cm in diameter. (C) Similar results were observed for GLUT1 in the same samples. (D) The IHC H‐scores for GLUT1 (left two columns) and MCT4 (right two columns) in patients with tumor diameter less or more than 5 cm. (E) GLUT1 expression level is positively correlated with MCT4 expression (n = 213). The IHC H‐scores are expressed as mean ± standard error of mean (bars); *** indicates P < 0.01, and ** indicates P < 0.05.
We also analyzed the correlation between GLUT1/MCT4 expression status and clinicopathological features. MCT4 and GLUT1 expression levels correlated with tumor sizes (P < 0.05; Table 2). Patients with larger tumors tended to have higher MCT4 or GLUT1 expression levels (P < 0.01; Fig. 2A and D). In addition, MCT4 expression levels correlated with a poor BCLC stage (P = 0.002; Table 2). Furthermore, there was a positive correlation between MCT4 and GLUT1 expression (r = 0.562, P < 0.001; Fig. 2E).
Table 2.
Correlation between MCT4/GLUT1 expression and clinicopathological parameters
| Clinicopathological variable | NO. | MCT4 expression levels | GLUT1 expression levels | ||||
|---|---|---|---|---|---|---|---|
| Low | High | P value | Low | High | P value | ||
| Age (years) | |||||||
| ≤50 | 103 | 57 | 46 | 0.435 | 42 | 61 | 0.984 |
| >50 | 110 | 55 | 55 | 45 | 65 | ||
| Gender | |||||||
| Female | 31 | 16 | 15 | 0.907 | 13 | 18 | 0.894 |
| Male | 182 | 96 | 86 | 74 | 108 | ||
| HBsAg | |||||||
| Negative | 31 | 15 | 16 | 0.613 | 11 | 20 | 0.511 |
| Positive | 182 | 97 | 85 | 76 | 106 | ||
| Serum AFP (ng/mL) | |||||||
| ≤400 | 111 | 64 | 47 | 0.122 | 48 | 63 | 0.458 |
| >400 | 102 | 48 | 54 | 39 | 63 | ||
| Tumor size (cm) | |||||||
| ≤5 | 90 | 38 | 52 | 0.010 | 30 | 60 | 0.046 |
| >5 | 123 | 74 | 49 | 57 | 66 | ||
| Tumor number | |||||||
| Solitary | 148 | 77 | 71 | 0.807 | 60 | 88 | 0.891 |
| Multiple | 65 | 35 | 30 | 27 | 38 | ||
| Microvascular invasion | |||||||
| No | 172 | 93 | 79 | 0.257 | 74 | 98 | 0.185 |
| Yes | 41 | 18 | 23 | 13 | 28 | ||
| Differentiation grade | |||||||
| I+II | 119 | 62 | 57 | 0.874 | 49 | 70 | 0.912 |
| III+IV | 94 | 50 | 44 | 38 | 56 | ||
| BCLC stage | |||||||
| 0–A | 171 | 99 | 72 | 0.002 | 75 | 96 | 0.071 |
| B–C | 42 | 13 | 29 | 12 | 30 | ||
| TNM stage | |||||||
| I | 137 | 68 | 69 | 0.247 | 55 | 82 | 0.780 |
| II–IV | 76 | 44 | 32 | 32 | 44 | ||
| Recurrence | |||||||
| No | 109 | 48 | 61 | 0.011 | 37 | 72 | 0.036 |
| Yes | 104 | 64 | 40 | 50 | 54 | ||
| AST (μ/L) | |||||||
| ≤40 | 112 | 59 | 53 | 0.976 | 47 | 65 | 0.726 |
| >40 | 101 | 53 | 48 | 40 | 61 | ||
| ALT (μ/L) | |||||||
| ≤40 | 122 | 64 | 58 | 0.967 | 53 | 69 | 0.372 |
| >40 | 91 | 48 | 43 | 34 | 57 | ||
| Liver cirrhosis | |||||||
| No | 98 | 49 | 49 | 0.486 | 38 | 60 | 0.571 |
| Yes | 115 | 63 | 115 | 49 | 66 | ||
AFP, alpha‐fetoprotein; BCLC, Barcelona Clinic Liver Cancer; AST, aspartate transaminase; ALT, alanine transaminase.
Bold values (P < 0.05) are statistically significant.
Prognostic value of MCT4 and GLUT1 expression in HCC
Univariate analysis of MCT4/GLUT1 status and routine clinicopathological parameters showed that GLUT1 overexpression, MCT4 overexpression, high alpha‐fetoprotein levels, large tumor size, multiple tumors, poor BCLC stage, poor tumor–node–metastasis (TNM) stage, and microvascular invasion are unfavorable predictors of OS in patients with HCC (Table 3). In addition, high GLUT1 expression levels, high MCT4 expression levels, multiple tumors, and poor TNM stage were significantly associated with shorter TTR in patients with HCC (Table 3).
Table 3.
Univariate and multivariate analyses of prognostic factors in HCC
| Variables | OS | TTR | ||||
|---|---|---|---|---|---|---|
| Univariate P value | Hazard ratio (95% CI) | P value | Univariate P value | Hazard ratio (95% CI) | P value | |
| Age (years) | 0.795 | 0.301 | ||||
| Gender | 0.866 | 0.660 | ||||
| HBsAg | 0.277 | 0.934 | ||||
| Serum AFP (ng/mL) | 0.020 | N.A. | 0.061 | |||
| Tumor size (cm) | 0.001 | 1.900 (1.122–3.215) | 0.017 | 0.097 | ||
| Tumor number | 0.000 | 1.657 (1.061–2.587) | 0.026 | 0.028 | N.A. | |
| Microvascular invasion | 0.001 | 2.037 (1.267–3.272) | 0.003 | 0.000 | 2.508 (1.457–4.316) | 0.001 |
| Differentiation grade | 0.569 | 0.406 | ||||
| BCLC stage | 0.007 | 1.547 (1.023–2.337) | 0.038 | 0.892 | ||
| TNM stage | 0.015 | N.A. | 0.011 | N.A. | ||
| AST (μ/L) | 0.815 | 0.929 | ||||
| ALT (μ/L) | 0.348 | 0.991 | ||||
| Liver cirrhosis | 0.372 | 0.287 | ||||
| MCT4 expression | 0.001 | 1.617 (1.102–2.374) | 0.014 | 0.004 | 1.930 (1.091–3.414) | 0.024 |
| GLUT1 expression | 0.020 | N.A. | 0.044 | N.A. | ||
OS, overall survival; TTR, the time to recurrence; HR, hazard ratio; CI, confidence interval; N.A., not applicable; MCT4, monocarboxylate transporter 4; GLUT1, glucose transporter 1.
Univariate analysis, Cox proportional hazards regression model. Multivariate analysis, Cox proportional hazards regression model. Variables were adopted by univariate analysis.
Bold values (P < 0.05) are statistically significant.
Kaplan–Meier survival curves showed that patients with high GLUT1 expression levels had lower OS (P = 0.02; Fig. 3A) and higher TTR rates (P = 0.044; Fig. 3B). The 5‐year OS and TTR rates in the high‐MCT4 expression group were 40.7% and 43.4%, respectively, which were significantly lower than those in the low‐MCT4 expression group (72.0% and 61.9%, respectively). We further explored the prognostic value of MCT4 with different BCLC stages of patients with HCC. Of the 171 patients at stages 0–A, 75 were identified as having positive MCT4 expression in tumor cells. Patients with positive MCT4 expression in tumor cells had a poorer surgical prognosis than those with negative MCT4 expression in tumor cells (P = 0.033; Fig. 3C); however, similar results could not be verified in the 42 patients at stages B–C (P = 0.455; Fig. 3D). Moreover, high GLUT1 expression levels indicated poorer OS (P < 0.001; Fig. 3E) and higher TTR rates (P = 0.004; Fig. 3F). The 5‐year OS rates for the high‐ and low‐GLUT1 expression groups were 36.4% and 71.2%, respectively. These findings suggest that MCT4 and GLUT1 are important prognostic markers in patients with HCC. We evaluated whether MCT4 expression and GLUT1 expression were independently predictive of OS and TTR in patients with HCC using the multivariate Cox model. The results showed that MCT4 expression was an independent prognostic factor for OS in patients with HCC (hazard ratio [HR] = 1.617, 95% confidence interval [CI] = 1.102 ± 2.374, P = 0.014; Table 3).
Figure 3.
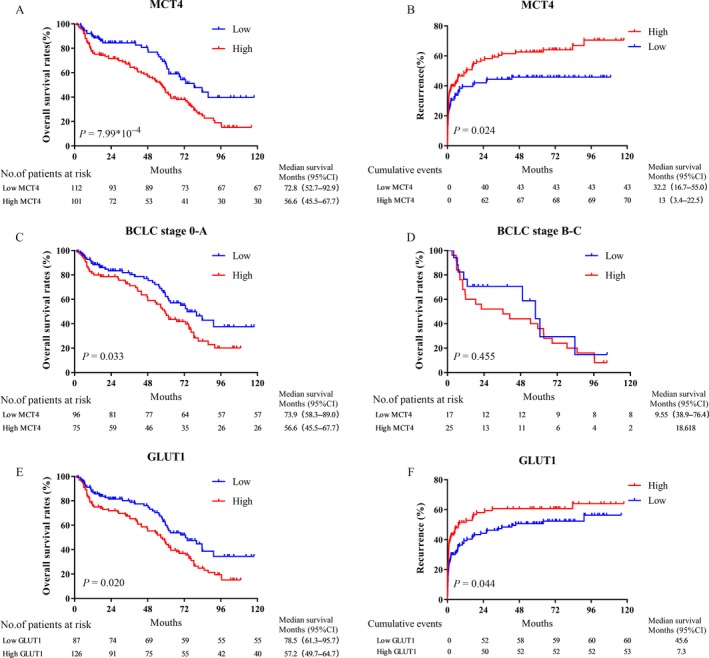
Prognostic significance of MCT4 expression and GLUT1 expression. (A, B) HCC patients with high MCT4 expression levels have a poor OS (A) and short TTR (B). (C, D) Kaplan–Meier analysis of the correlation between MCT4 expression in tumor cells and OS in BCLC stages 0–A (C) and stages B–C (D). (E, F) HCC patients with high GLUT1 expression levels have a poor OS (E) and short TTR (F).
Prognostic significance of the metabolic index
The metabolism of cancer cells is very different from that of normal cells 21. Cancer cell energy is mainly supplied by anaerobic glycolysis, and the synthesis of fatty acids and glutamine is also higher than that in normal cells 22; in this process, glucose and lactate metabolism play a leading role 23. It is believed that the transmembrane transport of MCT4 via proton‐linked lactate plays a key role in maintaining glycolysis metabolism 24, whereas GLUT1 is one of the most important glucose transporters in tumor cells 25. Therefore, we incorporated GLUT1 and MCT4 expression status into the metabolic indices to assess the combined effects of GLUT1 and MCT4 on HCC. Low and high expression levels of MCT4 and GLUT1 were designated as 0 and 1, respectively. Subsequently, MCT4 and GLUT1 indices were added to obtain metabolic indices of 0–2. Patients were thus divided into three groups: 0, low MCT4 and low GLUT1 expression (n = 50); 1, low MCT4 and high GLUT1 expression or high MCT4 and low GLUT1 expression (n = 99); and 2, high GLUT1 and high MCT4 expression (n = 55). Kaplan–Meier survival analysis showed that patients with high metabolic indices had poor OS (P = 0.001; Fig. 4A) and TTR rates (P = 0.007; Fig. 4B). In addition, multivariate analysis showed that the metabolic parameters were independent negative prognostic factors for both OS (HR = 1.617, 95% CI = 1.102–2.374, P = 0.006) and TTR (HR = 1.348, 95% CI = 1.079 ± 1.685, P = 0.009) (Table 4). We also divided the patients into two subgroups according to tumor sizes. Patients with a tumor diameter >5 cm had a poorer prognosis than those with a tumor diameter ≤5 cm. Furthermore, the effect of the metabolic indices of the tumor cells on prognosis was examined in the two subgroups. The results showed that patients with positive metabolic index expression in tumor cells may have significantly shorter OS rates than those with negative metabolic index expression in tumor cells in the ≤5‐cm and >5‐cm subgroups (Fig. 4C–F). In general, the metabolic index is a potent prognostic factor for OS and TTR in patients with HCC.
Figure 4.
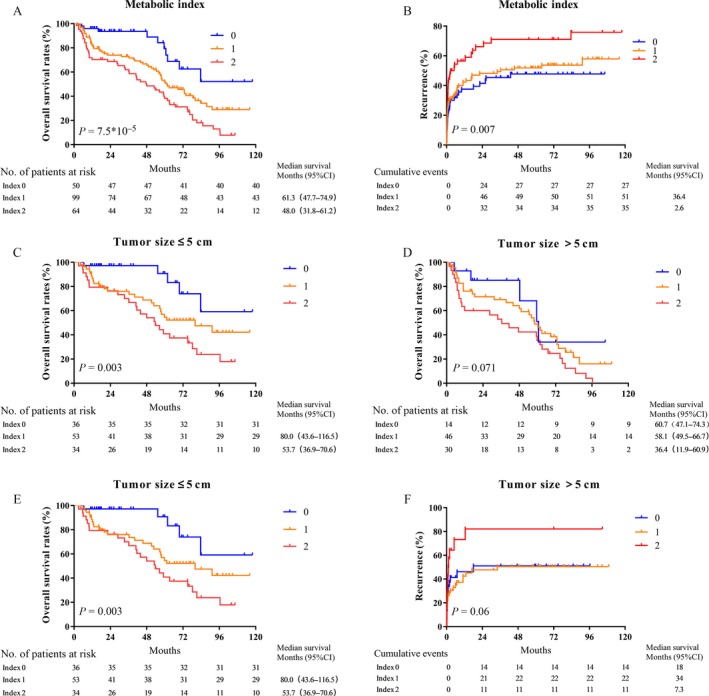
Prognostic significance of the metabolic index. (A, B) HCC patients with a high metabolic index have a poor OS (A) and short TTR (B) (n = 213). (C, D) Kaplan–Meier analysis of OS and TTR in patients according to tumor size, with 5 cm as the cutoff value. The OS ratio represents the prognostic significance of the metabolic index in the group with tumor size ≤5 cm (C) and the group with tumor size >5 cm (D). (E, F) The TTR ratio represents the prognostic significance of the metabolic index in the group with tumor size ≤5 cm (E) and the group with tumor size >5 cm (F).
Table 4.
Univariate and multivariate analyses of prognostic factors in HCC
| Variables | OS | TTR | ||||
|---|---|---|---|---|---|---|
| Univariate P value | Hazard ratio (95% CI) | P value | Univariate P value | Hazard ratio (95% CI) | P value | |
| Age (years) | 0.795 | 0.301 | ||||
| Gender | 0.866 | 0.660 | ||||
| HBsAg | 0.277 | 0.934 | ||||
| Serum AFP (ng/mL) | 0.020 | N.A. | 0.061 | |||
| Tumor size (cm) | 0.001 | 1.889 (1.120–3.186) | 0.017 | 0.097 | ||
| Tumor number | 0.000 | 1.691 (1.081–2.645) | 0.021 | 0.028 | N.A. | |
| Microvascular invasion | 0.001 | 2.021 (1.260–3.244) | 0.003 | 0.000 | 2.410 (1.405–4.134) | 0.001 |
| Differentiation grade | 0.569 | 0.406 | ||||
| BCLC stage | 0.007 | 1.542 (1.021–2.330) | 0.040 | 0.892 | ||
| TNM stage | 0.015 | N.A. | 0.011 | N.A. | ||
| AST (μ/L) | 0.815 | 0.929 | ||||
| ALT (μ/L) | 0.348 | 0.991 | ||||
| Liver cirrhosis | 0.372 | 0.287 | ||||
| Metabolic index | 0.001 | 1.617 (1.102–2.374) | 0.006 | 0.007 | 1.348 (1.079–1.685) | 0.009 |
OS, overall survival; TTR, the time to recurrence; HR, hazard ratio; CI, confidence interval; N.A., not applicable; MCT4, monocarboxylate transporter 4; GLUT1, glucose transporter 1.
Univariate analysis, Cox proportional hazards regression model. Multivariate analysis, Cox proportional hazards regression model. Variables were adopted by univariate analysis.
Bold values (P < 0.05) are statistically significant.
Discussion
Abnormal glucose metabolism (glucose metabolism reprogramming) plays a key role in tumorigenesis and progression 26, and its regulatory mechanism has been a hot topic in the field of oncology. Cancer cell production of lactate, the primary end product of glycolysis, creates an acidic environment that favors tumor invasion and inhibits anticancer immune effects, thus supporting the growth and metastasis of cancer cells 10, 27. Previous studies report that MCT4, an efficient lactate exporter, promotes the hostile acidic microenvironment for glycolysis and tumor growth 28. In addition, a functional study showed that GLUT1, a key transporter in glucose metabolism, is crucial for HCC cell proliferation and migration 29. Recent studies have shown that MCT4 is highly expressed in patients with liver cancer and that high expression levels of MCT4 are a negative prognostic marker for OS and DFS 30. Therefore, whether MCT4 plays an important role in glycometabolism in hepatocellular carcinoma and its close relationship with GLUT1 is worth exploring. According to the BCLC staging system, patients in stages 0 and A are considered to be in the early stages of HCC and have a better outcome after radical resection. However, some of these early patients have poor prognosis in clinical practice. Our results suggest that the expression of MCT4 in tumor cells predicts worse survival in early patients (Fig 3C and D). Therefore, the findings of this study suggest that measuring the expression of MCT4 in tumor cells can discriminate poor prognosis in patients with early‐stage HCC. In the present study, we examined the expression of two important transporters, MCT4 and GLUT1, to determine their metabolic status in HCC and assess their prognostic value. Our data show that MCT4 and GLUT1 expression levels are significantly higher in HCC cells than in adjacent nontumorous hepatocytes. Due to the important functions of GLUT1 and MCT4, we found that patients with high MCT4/GLUT1 expression levels had shorter OS and TTR. In addition, the metabolic index that correlated with MCT4 and GLUT1 expression is an independent prognostic factor for OS and TTR in HCC.
Regarding the routine clinical and pathological features of HCC, the expression levels of MCT4 and GLUT1 are closely related to tumor size. MCT4 and GLUT1 are required for cell proliferation and tumor growth, and due to the high concentration of nutrients in cancer cells, GLUT1 and MCT4 may promote tumor microenvironment formation by regulating the concentration of nutrients 27. Furthermore, large tumors may promote the expression of MCT4 and GLUT1 29. Large tumors are usually associated with hypoxia and are known to induce HIF1α expression, which is associated with tumor size, and to promote GLUT1 and MCT4 expression in HCC 12. In addition, in chronically infected HBV and HCV livers, cirrhosis accompanies significantly reduced oxygen supply 31. Subsequent microenvironment‐induced HIF1α activates vascular endothelial growth factor and cyclooxygenase transcription to promote angiogenesis stabilization and activate matrix metalloproteinases 32. Consistent with these studies, we found that GLUT1 and MCT4 are highly expressed in tumors larger than 5 cm in diameter. In addition, hypoxia is associated with the upregulation of glycolysis 33. Lactate, a glycolysis product, triggers MCT4 expression through the activation of c‐Myc; this finding indicates that MCT4 is closely linked to glucose metabolism 34. In this study, we found a positive correlation between MCT4 expression and GLUT1 expression. These data suggest that there is a positive feedback loop between tumor growth and the upregulation of MCT4/GLUT1. This positive feedback loop may be important for HCC progression.
In conclusion, GLUT1 and MCT4 expression levels are significantly higher in tumors than in adjacent nontumorous hepatocytes, particularly in hepatoma tumors with diameters greater than 5 cm. Patients with high GLUT1 or MCT4 expression levels had a poor OS and short TTR, and the expression of MCT4 in tumor cells might discriminate poor prognosis in patients with early‐stage HCC. In addition, metabolic indices were independent prognostic factors for OS and TTR. Our study shows that the expression of GLUT1 and MCT4 determines the metabolic status of the tumor, and the combined expression of these two proteins may be a good prognostic biomarker and therapeutic target for patients with HCC.
Conflict of Interest
None declared.
Acknowledgments
We acknowledge the National Natural Science Foundation of China (No. 81625017, No. 81572385) and the National Key R&D Program of China (2017YFA0505803). We appreciate the support from Department of Tumor Bank (Sun Yat‐sen University Cancer Center).
Contributor Information
Yun‐Qiang Tang, Email: tyqsci@126.com.
Ming Shi, Email: shiming@sysu.edu.cn.
References
- 1. Torre, L. A. , Bray F., Siegel R. L., Ferlay J., Lortet‐Tieulent J., and Jemal A.. 2015. Global cancer statistics, 2012. CA Cancer J. Clin. 65:87–108. [DOI] [PubMed] [Google Scholar]
- 2. Sprinzl, M. F. , and Galle P. R.. 2017. Current progress in immunotherapy of hepatocellular carcinoma. J. Hepatol. 66:482–484. [DOI] [PubMed] [Google Scholar]
- 3. Hato, T. , Goyal L., Greten T. F., Duda D. G., and Zhu A. X.. 2014. Immune checkpoint blockade in hepatocellular carcinoma: current progress and future directions. Hepatology (Baltimore, MD) 60:1776–1782. [DOI] [PMC free article] [PubMed] [Google Scholar]
- 4. Villanueva, A. , Hernandez‐Gea V., and Llovet J. M.. 2013. Medical therapies for hepatocellular carcinoma: a critical view of the evidence. Nat. Rev. Gastroenterol. Hepatol. 10:34–42. [DOI] [PubMed] [Google Scholar]
- 5. Cabrera, R. , and Nelson D. R.. 2010. Review article: the management of hepatocellular carcinoma. Aliment. Pharmacol. Ther. 31:461–476. [DOI] [PubMed] [Google Scholar]
- 6. Pinter, M. , Hucke F., Graziadei I., Vogel W., Maieron A., Konigsberg R., et al. 2012. Advanced‐stage hepatocellular carcinoma: transarterial chemoembolization versus sorafenib. Radiology 263:590–599. [DOI] [PubMed] [Google Scholar]
- 7. Giannelli, G. , Rani B., Dituri F., Cao Y., and Palasciano G.. 2014. Moving towards personalised therapy in patients with hepatocellular carcinoma: the role of the microenvironment. Gut 63:1668–1676. [DOI] [PubMed] [Google Scholar]
- 8. San‐Millan, I. , and Brooks G. A.. 2017. Reexamining cancer metabolism: lactate production for carcinogenesis could be the purpose and explanation of the Warburg Effect. Carcinogenesis 38:119–133. [DOI] [PMC free article] [PubMed] [Google Scholar]
- 9. Bensinger, S. J. , and Christofk H. R.. 2012. New aspects of the Warburg effect in cancer cell biology. Semin. Cell Dev. Biol. 23:352–361. [DOI] [PubMed] [Google Scholar]
- 10. Raghunand, N. , Gatenby R. A., and Gillies R. J.. 2003. Microenvironmental and cellular consequences of altered blood flow in tumours. Br J Radiol 76:S11–S22. [DOI] [PubMed] [Google Scholar]
- 11. Alves, V. A. , Pinheiro C., Morais‐Santos F., Felipe‐Silva A., Longatto‐Filho A., and Baltazar F.. 2014. Characterization of monocarboxylate transporter activity in hepatocellular carcinoma. World J. Gastroenterol. 20:11780–11787. [DOI] [PMC free article] [PubMed] [Google Scholar]
- 12. Paltoglou, S. M. , and Roberts B. J.. 2005. Role of the von Hippel‐Lindau tumour suppressor protein in the regulation of HIF‐1alpha and its oxygen‐regulated transactivation domains at high cell density. Oncogene 24:3830–3835. [DOI] [PubMed] [Google Scholar]
- 13. Le Floch, R. , Chiche J., Marchiq I., Naiken T., Ilc K., Murray C. M., et al. 2011. CD147 subunit of lactate/H+ symporters MCT1 and hypoxia‐inducible MCT4 is critical for energetics and growth of glycolytic tumors. Proc. Natl Acad. Sci. USA 108:16663–16668. [DOI] [PMC free article] [PubMed] [Google Scholar]
- 14. Hong, C. S. , Graham N. A., Gu W., Espindola Camacho C., Mah V., Maresh E. L., et al. 2016. MCT1 modulates cancer cell pyruvate export and growth of tumors that co‐express MCT1 and MCT4. Cell Rep. 14:1590–1601. [DOI] [PMC free article] [PubMed] [Google Scholar]
- 15. Gerlinger, M. , Santos C. R., Spencer‐Dene B., Martinez P., Endesfelder D., Burrell R. A., et al. 2012. Genome‐wide RNA interference analysis of renal carcinoma survival regulators identifies MCT4 as a Warburg effect metabolic target. J. Pathol. 227:146–156. [DOI] [PMC free article] [PubMed] [Google Scholar]
- 16. Gallagher, S. M. , Castorino J. J., Wang D., and Philp N. J.. 2007. Monocarboxylate transporter 4 regulates maturation and trafficking of CD147 to the plasma membrane in the metastatic breast cancer cell line MDA‐MB‐231. Can. Res. 67:4182–4189. [DOI] [PubMed] [Google Scholar]
- 17. Baek, G. , Tse Y. F., Hu Z., Cox D., Buboltz N., McCue P., et al. 2014. MCT4 defines a glycolytic subtype of pancreatic cancer with poor prognosis and unique metabolic dependencies. Cell Rep. 9:2233–2249. [DOI] [PubMed] [Google Scholar]
- 18. Lim, K. S. , Lim K. J., Price A. C., Orr B. A., Eberhart C. G., and Bar E. E.. 2014. Inhibition of monocarboxylate transporter‐4 depletes stem‐like glioblastoma cells and inhibits HIF transcriptional response in a lactate‐independent manner. Oncogene 33:4433–4441. [DOI] [PMC free article] [PubMed] [Google Scholar]
- 19. OuYang, H. Y. , Xu J., Luo J., Zou R. H., Chen K., Le Y., et al. 2016. MEP1A contributes to tumor progression and predicts poor clinical outcome in human hepatocellular carcinoma. Hepatology (Baltimore, MD) 63:1227–1239. [DOI] [PubMed] [Google Scholar]
- 20. Specht, E. , Kaemmerer D., Sanger J., Wirtz R. M., Schulz S., and Lupp A.. 2015. Comparison of immunoreactive score, HER2/neu score and H score for the immunohistochemical evaluation of somatostatin receptors in bronchopulmonary neuroendocrine neoplasms. Histopathology 67:368–377. [DOI] [PubMed] [Google Scholar]
- 21. Parks, S. K. , Chiche J., and Pouyssegur J.. 2013. Disrupting proton dynamics and energy metabolism for cancer therapy. Nat. Rev. Cancer 13:611–623. [DOI] [PubMed] [Google Scholar]
- 22. Villa, E. , and Ricci J. E.. 2016. How does metabolism affect cell death in cancer? FEBS J 283:2653–2660. [DOI] [PubMed] [Google Scholar]
- 23. Polet, F. , and Feron O.. 2013. Endothelial cell metabolism and tumour angiogenesis: glucose and glutamine as essential fuels and lactate as the driving force. J. Intern. Med. 273:156–165. [DOI] [PubMed] [Google Scholar]
- 24. Whitaker‐Menezes, D. , Martinez‐Outschoorn U. E., Lin Z., Ertel A., Flomenberg N., Witkiewicz A. K., et al. 2011. Evidence for a stromal‐epithelial “lactate shuttle” in human tumors: MCT4 is a marker of oxidative stress in cancer‐associated fibroblasts. Cell Cycle 10:1772–1783. [DOI] [PMC free article] [PubMed] [Google Scholar]
- 25. Takanaga, H. , Chaudhuri B., and Frommer W. B.. 2008. GLUT1 and GLUT9 as major contributors to glucose influx in HepG2 cells identified by a high sensitivity intramolecular FRET glucose sensor. Biochem. Biophys. Acta. 1778:1091–1099. [DOI] [PMC free article] [PubMed] [Google Scholar]
- 26. Fiaschi, T. , Marini A., Giannoni E., Taddei M. L., Gandellini P., De Donatis A., et al. 2012. Reciprocal metabolic reprogramming through lactate shuttle coordinately influences tumor‐stroma interplay. Can. Res. 72:5130–5140. [DOI] [PubMed] [Google Scholar]
- 27. Sukumar, M. , Roychoudhuri R., and Restifo N. P.. 2015. Nutrient competition: a new axis of tumor immunosuppression. Cell 162:1206–1208. [DOI] [PMC free article] [PubMed] [Google Scholar]
- 28. Gao, H. J. , Zhao M. C., Zhang Y. J., Zhou D. S., Xu L., Li G. B., et al. 2015. Monocarboxylate transporter 4 predicts poor prognosis in hepatocellular carcinoma and is associated with cell proliferation and migration. J. Cancer Res. Clin. Oncol. 141:1151–1162. [DOI] [PMC free article] [PubMed] [Google Scholar]
- 29. Amann, T. , Maegdefrau U., Hartmann A., Agaimy A., Marienhagen J., Weiss T. S., et al. 2009. GLUT1 expression is increased in hepatocellular carcinoma and promotes tumorigenesis. Am J Pathol 174:1544–1552. [DOI] [PMC free article] [PubMed] [Google Scholar]
- 30. Ohno, A. , Yorita K., Haruyama Y., Kondo K., Kato A., Ohtomo T., et al. 2014. Aberrant expression of monocarboxylate transporter 4 in tumour cells predicts an unfavourable outcome in patients with hepatocellular carcinoma. Liver Int. 34:942–952. [DOI] [PubMed] [Google Scholar]
- 31. Rosmorduc, O. , and Housset C.. 2010. Hypoxia: a link between fibrogenesis, angiogenesis, and carcinogenesis in liver disease. Semin. Liver Dis. 30:258–270. [DOI] [PubMed] [Google Scholar]
- 32. Dai, C. X. , Gao Q., Qiu S. J., Ju M. J., Cai M. Y., Xu Y. F., et al. 2009. Hypoxia‐inducible factor‐1 alpha, in association with inflammation, angiogenesis and MYC, is a critical prognostic factor in patients with HCC after surgery. BMC Cancer 9:418. [DOI] [PMC free article] [PubMed] [Google Scholar]
- 33. Leung, C. O. , Wong C. C., Fan D. N., Kai A. K., Tung E. K., Xu I. M., et al. 2015. PIM1 regulates glycolysis and promotes tumor progression in hepatocellular carcinoma. Oncotarget 6:10880–10892. [DOI] [PMC free article] [PubMed] [Google Scholar]
- 34. Doherty, J. R. , Yang C., Scott K. E., Cameron M. D., Fallahi M., Li W., et al. 2014. Blocking lactate export by inhibiting the Myc target MCT1 Disables glycolysis and glutathione synthesis. Can. Res. 74:908–920. [DOI] [PMC free article] [PubMed] [Google Scholar]