Abstract
This study provides an overview of the epidemiology and secular trends of malignant lymphoma in Japan. Using data from clinics and hospitals throughout Japan, we analyzed 9426 cases of malignant lymphoma diagnosed in 2007‐2014. We show that the proportion of follicular lymphoma and methotrexate‐associated lymphoproliferative disorder increased during this time, as did the onset age for follicular lymphoma and diffuse large B‐cell lymphoma. Significant increases in onset age for follicular lymphoma and diffuse large B‐cell lymphoma were observed in both men and women (all P values <0.0001 except for P = 0.0448 for the latter disease in women). Further studies are required to determine the reasons for the higher proportion of and onset age for these lymphomas. Additionally, we believe that continued observation of these trends is necessary.
Keywords: adult T‐cell leukemia/lymphoma, diffuse large B‐cell lymphoma, epidemiology, follicular lymphoma, Japan
1. INTRODUCTION
The epidemiological characteristics of malignant lymphoma (eg, proportion, sex ratio, and age of onset) differ along sociological, environmental, and racial lines.1, 2, 3, 4
In adult B‐cell lymphoma, diffuse large B‐cell lymphoma (DLBCL, 37%) and follicular lymphoma (FL, 29%) are the most common subtypes worldwide, followed by extranodal marginal zone lymphoma of mucosa‐associated lymphoid tissue (MALT, 9%), mantle cell lymphoma (MCL, 7%), and chronic lymphoid leukemia/small lymphoid leukemia (CLL/SLL, 12%).5 However, these proportions vary from country to country. CLL/SLL, for example, is less common in Asia than in other parts of the world.5
In adult T‐cell lymphoma, peripheral T‐cell lymphoma not otherwise specified (PTCL‐NOS) and angioimmunoblastic T‐cell lymphoma (AITL) are the most common subtypes worldwide.6 According to the international peripheral T‐cell and natural killer (NK)/T‐cell lymphoma study, their relative frequencies are 25.9% and 18.5%, respectively.6 Other common T‐cell lymphoma subtypes include extranodal NK/T‐cell lymphoma (10.4%), adult T‐cell leukemia/lymphoma (ATLL, 9.6%), anaplastic lymphoma kinase‐positive anaplastic large cell lymphoma (ALCL‐ALK+, 9.6%), and ALK‐negative (ALCL‐ALK−, 5.5%).6 These proportions vary according to geographic locations; extranodal NK/T‐cell lymphoma and ATLL, for example, are more common in Asia than in Europe and the USA.5
Epidemiological studies of malignant lymphoma in Japan have been performed by the Lymphoma Study Group of Japanese Pathologists (3194 cases in 2000)7 and Aoki et al (2260 cases in 2008).8 The latter study examined geographic distribution, age of onset, and sex ratio in cases diagnosed at Kurume University from 2001 to 2006 using data from clinics and hospitals throughout Japan. However, no paper on the secular trend of epidemiological factors in Japan has been published to date.
Herein, we present an overview of the epidemiology and secular trends of malignant lymphomas diagnosed from 2007 to 2014 in Japan.
2. MATERIALS AND METHODS
2.1. Tissue samples
We reviewed 19 332 clinically suspected cases of hematopoietic/lymphoid tissue malignancies that were diagnosed in our laboratory between 2007 and 2014. For diagnosis, biopsy or resection specimens were sent to us from 396 hospitals and clinics across Japan's 47 prefectures, ranging from the northernmost prefecture of Hokkaido to Okinawa, the southernmost prefecture. Clinical data were obtained from clinicians at the time of the initial diagnosis.
Histological confirmation was obtained in 11 428 of the 19 332 cases, with 9426 remaining after exclusion of cases with relapses or recurrences. Malignant lymphomas were diagnosed and analyzed in accordance with the 2008 World Health Organization (WHO) guidelines. We used three procedures (described below) for diagnosis: flow cytometry, immunohistochemistry, and DNA and RNA analysis. All final diagnoses were made by one pathologist (K. O.), who is an authority on the pathology of lymphoid neoplasms. This study was approved by the Research Ethics Committee of Kurume University.
2.2. Flow cytometry
Antibodies (in parentheses) to the following proteins were used for flow cytometry: CD45 (2D1), CD2 (T11:SFCI3Pt2H9), CD3 (UCHT1), CD4 (T4:SFCI12T4D11), CD5 (T1:SFCI24T6G12), CD7 (3A1:3A1E‐12H7), CD8 (T8:SFCI21Thy2D3), CD10 (J5), CD11c (BU15), CD16 (3G8), CD19 (B4:89B), CD20 (L27), CD23 (MHM6), CD25(2A3), CD30 (Ber‐H2), CD34 (581), CD56 (NHK‐1:N901), κ‐chain, and λ‐chain. All antibodies were from Beckman Coulter Inc (Brea, CA, USA), except for those to CD45, CD20, and CD45 (Becton Dickinson Biosciences, Tokyo, Japan) and CD23, CD30, κ chain, and λ chain (Agilent Technologies, Santa Clara, CA, USA). Isotype control antibodies (MsIg‐FITC and MsIg‐RD1) were obtained from Beckman Coulter Inc.
2.3. Immunohistochemistry
For immunohistochemistry, formalin‐fixed paraffin‐embedded tissue and/or frozen sections were used. All tissues and sections were stained with H&E and immunostained for pan‐B‐cell (CD20) and pan‐T‐cell (CD45RO) markers. Ancillary immunostaining was performed when needed. Antibodies (in parentheses) to the following proteins or cells were used for immunohistochemistry: CD1a (EP3622), CD3 (2GV6), CD4 (SP35), CD5 (SP19), CD8 (SP57), CD10 (SP67), CD21 (2G9), CD23 (SP23), CD30 (Ber‐H2), CD34 (QBEnd/10), CD56 (MRQ‐42), CD79a (SP18), CD138 (B‐A38), cyclin D1 (SP4‐R), bcl2 (SP66), bcl6 (GI191E/A8), multiple myeloma oncogene 1 (MRQ43), myeloperoxidase (polyclonal), terminal deoxyribonucleotidyl transferase (polyclonal), cytokeratin AE1/AE3 (AE1/AE3/PCK26), and ALK (ALK01) (Roche Diagnostics, Basel, Switzerland); CD7 (LP15), CD13 (38C12), CD33 (PWS44), Epstein‐Barr virus (EBV)‐encoded nuclear antigen 2 (PE2), and paired box protein 5 (1EW) (Leica Biosystems, Tokyo, Japan); CD14 (M5E2), CD15 (MMA), CD57 (HNK‐1), and CD123 (SSDCLY107D2) (Becton Dickinson Biosciences); CD19 (LE‐CD19), CD20 (L26), CD68 (PG‐M1), κ chain (polyclonal), λ chain (polyclonal), EBV‐encoded latent membrane protein (CS.1‐4), and follicular dendritic cells (CAN.42) (Agilent Technologies); chemokine (C‐X‐C motif) ligand 13 (53610) (R&D Systems, Minneapolis, MN, USA); CD25 (PC61.5), lymphoid enhancer‐binding factor 1 (EPR2029Y), programmed cell death protein 1 (NAT105), and c‐myc (Y69) (Abcam, London, UK); CD41 (P2) and T‐cell‐restricted intracellular antigen‐1 (2G9A10F5) (Beckman Coulter Inc); and epithelial membrane antigen (E29) (Nichirei Biosciences Inc, Tokyo, Japan).
2.4. DNA and RNA analysis
The procedures for in situ hybridization for EBV‐encoded RNA,9 southern blotting,10 and fluorescence in situ hybridization11 were described in detail previously. Fluorescence in situ hybridization was conducted to identify genetic abnormalities strongly associated with specific malignant lymphomas. The abnormalities examined were IgH/BCL1 t(11;14), IgH/BCL2 t(14;18), BCL6 3q27 translocation, IgH/C‐MYC t(8;14), ALK 2p23 translocation, and API2/MALT1 t(11;18).
2.5. Geographical, age, and sex distributions of the histological subtypes of malignant lymphoma
For geographical distribution, we divided Japan into six regions as done by Aoki et al: Okinawa, Kyushu, Kinki/Chugoku/Shikoku, Chubu, and Kanto, Tohoku/Hokkaido.8 The geographical region for each case corresponded to the location of the hospital or clinic that sent the material. Okinawa and Kyushu are considered separately because both are areas in which ATLL is endemic. For age distribution, we divided the patients into nine age groups: 0‐9, 10‐19, 20‐29, 30‐39, 40‐49, 50‐59, 60‐69, 70‐79, and >80 years. Sex distributions are presented as male‐female (M/F) ratios.
2.6. Statistical analysis
For analysis of the secular trends of the epidemiological factors, we divided the cases into three groups based on the time of diagnosis: 2007‐2009, 2010‐2012 and 2013‐2014. Age adjustment was performed in accordance with the 1985 population model in Japan. We used Fisher's exact test to construct r × c tables. P values <0.05 were considered statistically significant in a two‐tailed test. Statistical analyses were conducted by using SAS 9.4 software (SAS Institute Inc, Cary, NC, USA).
3. RESULTS
3.1. Histologic subtypes
The histological subtypes of the malignant lymphomas in our study are listed in Table 1, and the distribution of each subtype among the nine geographic areas in Japan is presented in Table 1 and Figures 1 and 2. For the major subtypes, the overall percentages were as follows (with those for Okinawa, Kyushu, Kinki/Chugoku/Shikoku, Chubu, Kanto, and Tohoku/Hokkaido in parentheses): B‐cell lymphoma, 71.7% (54.6%, 68.6%,77.2%, 77.7%, 75.5%, and 76.9%, respectively); T/NK cell neoplasms, 18.5% (33.6%, 22.7%, 14.3%, 12.3%, 13.3%, and 14.8%, respectively); Hodgkin lymphoma, 5.8% (7.5%, 5.4%, 5.0%, 5.2%, 6.5%, and 4.4%, respectively); and histiocytic/dendritic cell neoplasms, 0.15% (0.39%, 0.12%, 0.09%, 0%, 0.22%, and 0%, respectively).
Table 1.
Frequency of lymphoid neoplasms by subtype and geographical location/Age and sex distribution, 2007‐2014
| Median age | M/F | Japan (n) | Japan (%) | Okinawa (n) | Okinawa (%) | Kyushu (n) | Kyushu (%) | Kinki/Chu‐goku/Shikoku (n) | Kinki/Chugoku/Shikoku (%) | Chu‐bu (n) | Chubu (%) | Kantou (n) | Kantou (%) | Touhoku/Hokkaido (n) | Tohoku/Hokkaido (%) | |
|---|---|---|---|---|---|---|---|---|---|---|---|---|---|---|---|---|
| Total cases(n) | 68 | 1.1684695 | 9424 | 100.0 | 777 | 100 | 3420 | 100 | 1103 | 100 | 658 | 100 | 2765 | 100 | 697 | 100 |
| B‐cell neoplasms | 68 | 1.1 | 6759 | 71.72 | 424 | 54.6 | 2345 | 68.6 | 852 | 77.2 | 511 | 77.7 | 2088 | 75.5 | 536 | 76.9 |
| T/NK‐cell neoplasms | 70 | 1.4019337 | 1745 | 18.52 | 261 | 33.6 | 775 | 22.7 | 158 | 14.3 | 81 | 12.3 | 367 | 13.3 | 103 | 14.8 |
| Hodgkin lymphoma | 60 | 1.951087 | 543 | 5.76 | 58 | 7.5 | 183 | 5.4 | 55 | 5.0 | 34 | 5.2 | 181 | 6.5 | 31 | 4.4 |
| Histiocytic/dendritic cell neoplasms | 69 | 0.5555556 | 14 | 0.15 | 3 | 0.4 | 4 | 0.1 | 1 | 0.1 | 0 | 0.0 | 6 | 0.2 | 0 | 0.0 |
| Composite lymphoma | 71 | 0.8947368 | 72 | 0.76 | 7 | 0.9 | 21 | 0.6 | 7 | 0.6 | 10 | 1.5 | 20 | 0.7 | 7 | 1.0 |
| Immunodeficiency‐associated lymphoproliferative disorders | 69 | 0.6391753 | 159 | 1.69 | 10 | 1.3 | 51 | 1.5 | 14 | 1.3 | 12 | 1.8 | 61 | 2.2 | 11 | 1.6 |
| EBV‐lymphoproliferative disorder | 86 | 0.75 | 49 | 0.52 | 0 | 0.0 | 18 | 0.5 | 7 | 0.6 | 5 | 0.8 | 15 | 0.5 | 4 | 0.6 |
| Malignant lymphoma, NOS | 65 | Male ONLY | 3 | 0.03 | 0 | 0.0 | 1 | 0.0 | 1 | 0.1 | 0 | 0.0 | 1 | 0.0 | 0 | 0.0 |
| Other hematopoietic neoplasms | 63 | 2.2916667 | 80 | 0.85 | 14 | 1.8 | 22 | 0.6 | 8 | 0.7 | 5 | 0.8 | 26 | 0.9 | 5 | 0.7 |
| B‐cell neoplasms | ||||||||||||||||
| Precursor B‐lymphoblastic leukemia/lymphoma | 31 | 1 | 16 | 0.17 | 2 | 0.3 | 5 | 0.1 | 3 | 0.3 | 0 | 0.0 | 5 | 0.2 | 1 | 0.1 |
| Plasmablastic lymphoma | 77 | 3 | 12 | 0.13 | 2 | 0.3 | 7 | 0.2 | 1 | 0.1 | 1 | 0.2 | 1 | 0.0 | 0 | 0.0 |
| CLL/SLL | 68 | 1.3863636 | 105 | 1.11 | 5 | 0.6 | 39 | 1.1 | 20 | 1.8 | 5 | 0.8 | 29 | 1.0 | 7 | 1.0 |
| Lymphoplasmacytic lymphoma | 67 | 3.2 | 42 | 0.45 | 1 | 0.1 | 15 | 0.4 | 8 | 0.7 | 3 | 0.5 | 14 | 0.5 | 1 | 0.1 |
| Mantle cell lymphoma | 71 | 3.5689655 | 266 | 2.82 | 20 | 2.6 | 95 | 2.8 | 22 | 2.0 | 26 | 4.0 | 80 | 2.9 | 23 | 3.3 |
| Follicular lymphoma | 63 | 0.8957772 | 2110 | 22.39 | 101 | 13.0 | 747 | 21.8 | 215 | 19.5 | 173 | 26.3 | 673 | 24.3 | 199 | 28.6 |
| Nodal marginal zone B‐cell lymphoma | 70 | 0.8709677 | 58 | 0.62 | 3 | 0.4 | 13 | 0.4 | 9 | 0.8 | 6 | 0.9 | 20 | 0.7 | 7 | 1.0 |
| Extranodal marginal zone B‐cell lymphoma (MALT) | 67 | 0.6956522 | 351 | 3.72 | 46 | 5.9 | 104 | 3.0 | 79 | 7.2 | 15 | 2.3 | 90 | 3.3 | 17 | 2.4 |
| Splenic marginal zone B‐cell lymphoma | 69 | 1.3 | 23 | 0.24 | 0 | 0.0 | 8 | 0.2 | 3 | 0.3 | 3 | 0.5 | 9 | 0.3 | 0 | 0.0 |
| Splenic b‐cell lymphoma/leukemia, unclassifiable | 63 | 1.5 | 5 | 0.05 | 0 | 0.0 | 2 | 0.1 | 1 | 0.1 | 0 | 0.0 | 2 | 0.1 | 0 | 0.0 |
| Hairy cell leukemia | 64 | Male ONLY | 2 | 0.02 | 0 | 0.0 | 0 | 0.0 | 2 | 0.2 | 0 | 0.0 | 0 | 0.0 | 0 | 0.0 |
| Plasma cell neoplasms | 67 | 1 | 40 | 0.42 | 2 | 0.3 | 17 | 0.5 | 1 | 0.1 | 3 | 0.5 | 17 | 0.6 | 0 | 0.0 |
| Diffuse large B‐cell lymphoma | 72 | 1.136478 | 3397 | 36.05 | 217 | 27.9 | 1168 | 34.2 | 450 | 40.8 | 253 | 38.4 | 1045 | 37.8 | 263 | 37.7 |
| Mediastinal large B‐cell lymphoma | 40 | 1.9333333 | 44 | 0.47 | 3 | 0.4 | 19 | 0.6 | 5 | 0.5 | 6 | 0.9 | 10 | 0.4 | 1 | 0.1 |
| Intravascular large B‐cell lymphoma | 71 | 1 | 30 | 0.32 | 6 | 0.8 | 3 | 0.1 | 5 | 0.5 | 3 | 0.5 | 13 | 0.5 | 0 | 0.0 |
| Pyothorax‐associated lymphoma | 78 | 5 | 12 | 0.13 | 1 | 0.1 | 2 | 0.1 | 1 | 0.1 | 2 | 0.3 | 5 | 0.2 | 1 | 0.1 |
| Burkitt lymphoma | 71 | 2 | 66 | 0.70 | 7 | 0.9 | 31 | 0.9 | 4 | 0.4 | 6 | 0.9 | 16 | 0.6 | 2 | 0.3 |
| B‐cell lymphoma, unclassifiable, with features intermediate between DLBCL and Burkitt lymphoma | 70 | 1.0454545 | 134 | 1.42 | 11 | 1.4 | 53 | 1.5 | 12 | 1.1 | 8 | 1.2 | 41 | 1.5 | 9 | 1.3 |
| B‐cell lymphoma, unclassifiable, with features intermediate between DLBCL and classical Hodgkin lymphoma | 52 | 0.6666667 | 6 | 0.06 | 1 | 0.1 | 2 | 0.1 | 2 | 0.2 | 0 | 0.0 | 0 | 0.0 | 1 | 0.1 |
| Lymphomatoid granulosis | 80 | 2 | 3 | 0.03 | 0 | 0.0 | 1 | 0.0 | 0 | 0.0 | 1 | 0.2 | 1 | 0.0 | 0 | 0.0 |
| B‐cell neoplasms‐not otherwise specifieda | 69 | 1.46 | 123 | 1.31 | 6 | 0.8 | 38 | 1.1 | 20 | 1.8 | 8 | 1.2 | 45 | 1.6 | 6 | 0.9 |
| T/NK‐cell neoplasms | ||||||||||||||||
| T‐cell prolymphocytic leukemia | 70 | 1.5 | 5 | 0.05 | 0 | 0.0 | 0 | 0.0 | 0 | 0.0 | 1 | 0.2 | 4 | 0.1 | 0 | 0.0 |
| Precursor T‐lymphoblastic leukemia/lymphoma | 30 | 2.625 | 58 | 0.62 | 3 | 0.4 | 21 | 0.6 | 4 | 0.4 | 3 | 0.5 | 24 | 0.9 | 3 | 0.4 |
| Extranodal NK/T‐cell lymphoma, nasal type | 62 | 1.2857143 | 64 | 0.68 | 18 | 2.3 | 13 | 0.4 | 6 | 0.5 | 1 | 0.2 | 19 | 0.7 | 7 | 1.0 |
| MF/Sezary syndrome | 64 | 2.8 | 19 | 0.20 | 2 | 0.3 | 5 | 0.1 | 6 | 0.5 | 0 | 0.0 | 6 | 0.2 | 0 | 0.0 |
| MF | 63 | 2.2 | 16 | 0.17 | 2 | 0.3 | 3 | 0.1 | 6 | 0.5 | 0 | 0.0 | 5 | 0.2 | 0 | 0.0 |
| Sezary syndrome | 71 | Male ONLY | 3 | 0.03 | 0 | 0.0 | 2 | 0.1 | 0 | 0.0 | 0 | 0.0 | 1 | 0.0 | 0 | 0.0 |
| Angioimmunoblastic T‐lymphoma | 72 | 1.2068966 | 448 | 4.75 | 20 | 2.6 | 168 | 4.9 | 39 | 3.5 | 35 | 5.3 | 140 | 5.1 | 46 | 6.6 |
| Peripheral T‐cell lymphoma, not otherwise specified | 70 | 1.9494949 | 294 | 3.12 | 27 | 3.5 | 100 | 2.9 | 42 | 3.8 | 21 | 3.2 | 81 | 2.9 | 23 | 3.3 |
| Adult T‐cell leukemia/lymphoma | 70 | 1.2196721 | 677 | 7.18 | 166 | 21.4 | 411 | 12.0 | 32 | 2.9 | 8 | 1.2 | 46 | 1.7 | 14 | 2.0 |
| Anaplastic large cell lymphoma | 59 | 2.1764706 | 109 | 1.16 | 11 | 1.4 | 43 | 1.3 | 13 | 1.2 | 9 | 1.4 | 25 | 0.9 | 8 | 1.1 |
| ALK positive | 38 | 2 | 39 | 0.41 | 3 | 0.4 | 22 | 0.6 | 3 | 0.3 | 1 | 0.2 | 6 | 0.2 | 4 | 0.6 |
| ALK negative | 66 | 2.2380952 | 69 | 0.73 | 8 | 1.0 | 21 | 0.6 | 10 | 0.9 | 8 | 1.2 | 18 | 0.7 | 4 | 0.6 |
| Enteropathy‐type‐T‐cell lymphoma | 66 | 0.8571429 | 13 | 0.14 | 1 | 0.1 | 7 | 0.2 | 1 | 0.1 | 0 | 0.0 | 4 | 0.1 | 0 | 0.0 |
| Hepatosplenic T‐cell lymphoma | 63 | Male ONLY | 2 | 0.02 | 0 | 0.0 | 0 | 0.0 | 1 | 0.1 | 0 | 0.0 | 1 | 0.0 | 0 | 0.0 |
| Primary cutaneous CD30 positive T‐cell lymphoproliferative disorders | 63 | 1.1666667 | 26 | 0.28 | 5 | 0.6 | 2 | 0.1 | 7 | 0.6 | 1 | 0.2 | 9 | 0.3 | 2 | 0.3 |
| Primary cutaneous peripheral T‐cell lymphoma, rare subtype | 62 | 1 | 22 | 0.23 | 6 | 0.8 | 4 | 0.1 | 6 | 0.5 | 0 | 0.0 | 6 | 0.2 | 0 | 0.0 |
| Subcutaneous panniculitis‐like T‐cell lymphoma | 62 | 1.5 | 5 | 0.05 | 2 | 0.3 | 0 | 0.0 | 1 | 0.1 | 2 | 0.3 | 0 | 0.0 | 0 | 0.0 |
| T/NK‐cell lymphoma, not otherwise specified | 33 | Male ONLY | 3 | 0.03 | 0 | 0.0 | 1 | 0.0 | 0 | 0.0 | 0 | 0.0 | 2 | 0.1 | 0 | 0.0 |
| Hodgkin lymphoma | ||||||||||||||||
| Nodular LP Hodgkin lymphoma | 41 | 2.6666667 | 11 | 0.12 | 2 | 0.3 | 2 | 0.1 | 1 | 0.1 | 0 | 0.0 | 5 | 0.2 | 1 | 0.1 |
| Classical Hodgkin lymphoma | ||||||||||||||||
| NS classical Hodgkin lymphoma | 38 | 1.2117647 | 188 | 1.99 | 25 | 3.2 | 47 | 1.4 | 17 | 1.5 | 17 | 2.6 | 68 | 2.5 | 14 | 2.0 |
| MC classical Hodgkin lymphoma | 64 | 2.6973684 | 281 | 2.98 | 25 | 3.2 | 110 | 3.2 | 28 | 2.5 | 14 | 2.1 | 89 | 3.2 | 15 | 2.2 |
| LR classical Hodgkin lymphoma | 60 | 3.5 | 8 | 0.08 | 2 | 0.3 | 1 | 0.0 | 3 | 0.3 | 1 | 0.2 | 1 | 0.0 | 0 | 0.0 |
| LD classical Hodgkin lymphoma | 70 | 2.5 | 35 | 0.37 | 1 | 0.1 | 16 | 0.5 | 5 | 0.5 | 2 | 0.3 | 10 | 0.4 | 1 | 0.1 |
| Hodgkin lymphoma‐not otherwise specified | 49 | 1.375 | 19 | 0.20 | 3 | 0.4 | 7 | 0.2 | 1 | 0.1 | 0 | 0.0 | 8 | 0.3 | 0 | 0.0 |
| Histiocytic/dendritic cell neoplasms | 69 | 0.5555556 | 14 | 3 | 0.4 | 4 | 0.1 | 1 | 0.1 | 0 | 0.0 | 6 | 0.2 | 0 | 0.0 | |
| Histiocytic sarcoma | 68 | 0.8 | 7 | 0.07 | 1 | 0.1 | 2 | 0.1 | 1 | 0.1 | 0 | 0.0 | 3 | 0.1 | 0 | 0.0 |
| Langerhans histiocytosis/sarcoma | 71 | 0.4 | 7 | 0.07 | 2 | 0.3 | 2 | 0.1 | 0 | 0.0 | 0 | 0.0 | 3 | 0.1 | 0 | 0.0 |
| Composite lymphoma | 71 | 0.8947368 | 72 | 0.76 | 7 | 0.9 | 21 | 0.6 | 7 | 0.6 | 10 | 1.5 | 20 | 0.7 | 7 | 1.0 |
| Immunodeficiency‐associated lymphoproliferative disorders | ||||||||||||||||
| Post‐transplant lymphoproliferative disorders | 36 | 2 | 12 | 0.13 | 1 | 0.1 | 4 | 0.1 | 0 | 0.0 | 0 | 0.0 | 7 | 0.3 | 0 | 0.0 |
| Other iatrogenic immunodeficiency associated lymphoproliferative disorders | 69 | 0.5806452 | 147 | 1.56 | 9 | 1.2 | 47 | 1.4 | 14 | 1.3 | 12 | 1.8 | 54 | 2.0 | 11 | 1.6 |
| MTX‐lymphoproliferative disorders | 69 | 0.4941176 | 127 | 1.35 | 8 | 1.0 | 40 | 1.2 | 11 | 1.0 | 8 | 1.2 | 49 | 1.8 | 11 | 1.6 |
| EBV‐lymphoproliferative disorder | 86 | 0.75 | 49 | 0.52 | 0 | 0.0 | 18 | 0.5 | 7 | 0.6 | 5 | 0.8 | 15 | 0.5 | 4 | 0.6 |
| Malignant lymphoma, not otherwise specified | 65 | Male ONLY | 3 | 0.03 | 0 | 0.0 | 1 | 0.0 | 1 | 0.1 | 0 | 0.0 | 1 | 0.0 | 0 | 0.0 |
| Other haematopoietic neoplasms | ||||||||||||||||
| Granulocytic sarcoma | 61 | 2.2352941 | 55 | 0.58 | 10 | 1.3 | 16 | 0.5 | 6 | 0.5 | 5 | 0.8 | 14 | 0.5 | 4 | 0.6 |
| Blastic plasmacytoid dendritic cell neoplasm | 72 | 1.5 | 15 | 0.16 | 3 | 0.4 | 4 | 0.1 | 1 | 0.1 | 0 | 0.0 | 6 | 0.2 | 1 | 0.1 |
| Multiple myeloma | 66 | 2 | 8 | 0.08 | 0 | 0.0 | 2 | 0.1 | 1 | 0.1 | 0 | 0.0 | 5 | 0.2 | 0 | 0.0 |
Two cases of FL, 1 case of DLBCL and 1 case of Classical HL (LR type) lack geographical information. A case of ALCL lacks information about ALK expression information.
B‐cell neoplasms‐not otherwise specified included 3 cases of high grade B‐cell lymphoma, nos and 95 cases of low grade B‐cell lymphoma, nos, etc
Figure 1.
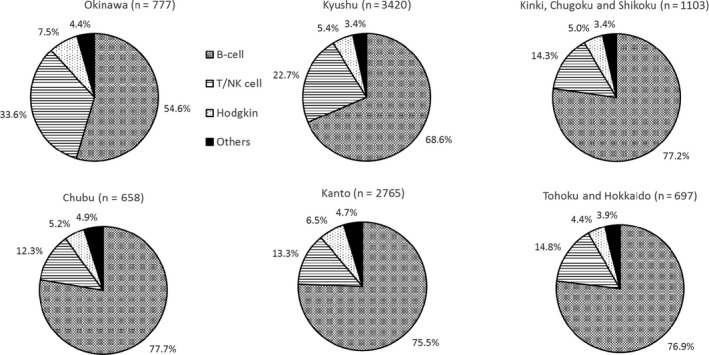
Frequency of the major histological lymphoma subtypes in six geographic areas in Japan in 2007‐2014. B cell: B‐cell lymphoma, T/NK cell: T/NK‐cell lymphoma, Hodgkin: Hodgkin lymphoma, Others: other hematopoietic and lymphoid malignancies
Figure 2.
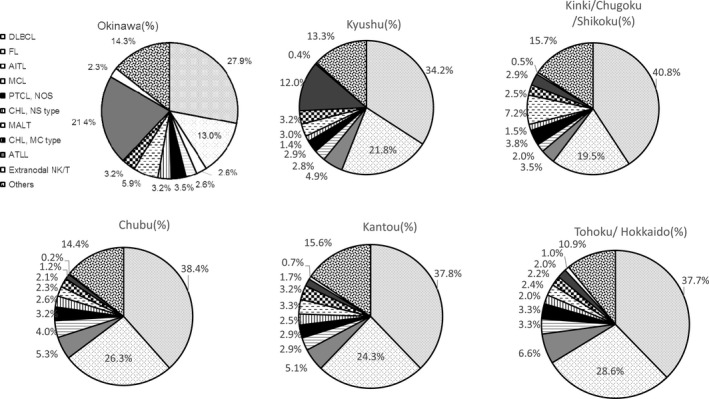
Frequency of sub‐major histological lymphoma subtypes in six geographic areas in Japan in 2007‐2014. DLBCL: diffuse large B‐cell lymphoma; FL: follicular lymphoma; AITL: angioimmunoblastic T‐cell lymphoma; MCL: mantle cell lymphoma; CHL, NS type: classic Hodgkin lymphoma, nodular sclerosis type; MALT: extranodal marginal zone lymphoma of mucosa‐associated lymphoid tissue; CHL, MC type: classic Hodgkin lymphoma, mixed cellularity
Overall, DLBCL is the most common and FL is the second in frequency followed by adult T‐cell leukemia/lymphoma (ATLL), AITL, MALT and PTCL, NOS.
Among B‐cell lymphoma, DLBCL was the most common (50.3%), followed by FL (31.2%), MALT (5.2%), and MCL (3.9%). This order also applied to the different regions, excepting Chubu and Tohoku/Hokkaido. In these two regions, MCL was more frequent than MALT lymphoma (Chubu: MALT, 2.9% and MCL, 5.1%; Tohoku/Hokkaido: MALT, 3.2% and MCL, 4.3%) (Figure 3).
Figure 3.
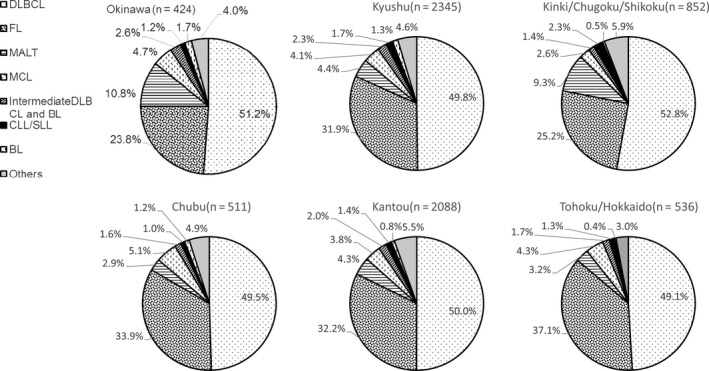
Frequency of B‐cell lymphoma subtypes in six geographic areas in Japan from 2007‐2014. DLBCL: diffuse large B‐cell lymphoma, FL: follicular lymphoma, MALT: extranodal marginal zone lymphoma of mucosa‐associated lymphoid tissue lymphoma, MCL: mantle cell lymphoma, BL: Burkitt lymphoma, CLL/SLL: chronic lymphoid leukemia/small lymphoid leukemia, Others: other B‐cell malignancies
Among T/NK cell lymphomas, 38.8% were ATLL, 25.7.8% were AITL, 16.8% were PTCL‐NOS, and 6.2% were ALCL (2.2% ALK+ and 4.0% ALK−). ATLL was the most common T/NK‐cell lymphoma in Kyushu (53.0%) and Okinawa (63.6%) (Figure 4). It was the third most frequent malignant lymphoma in Kyushu and the second most frequent malignant lymphoma in Okinawa; it ranked sixth ,13th, 11th,and ninth in Kinki/Chugoku/Shikoku, Chubu, Kanto, and Tohoku/Hokkaido, respectively (Figure 2). The proportion of extranodal NK/T‐cell lymphoma in Okinawa has declined significantly compared to that reported in a previous study by Aoki et al 2.3% (18 of 777 cases) in this study and 5.8% (17 of 292 cases) in the Aoki's study.8
Figure 4.
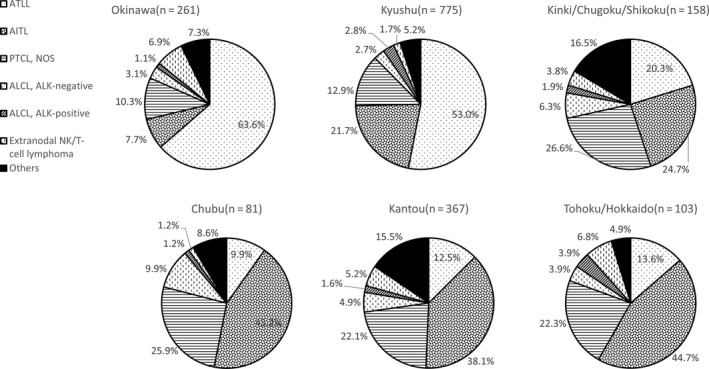
Frequency of T/NK cell lymphoma subtypes in six geographic areas in Japan from 2007‐2014. ATLL: adult T‐cell leukemia/lymphoma; AITL: angioimmunoblastic T‐cell lymphoma; PTCL‐NOS: peripheral T‐cell lymphoma, not otherwise specified; ACLC: anaplastic large cell lymphoma; ALK: anaplastic lymphoma kinase; NK: natural killer; Others: other T/NK‐cell malignancies
3.2. Age distribution
Most of the patients in this study were >15 years old because patients ≤15 years old are almost exclusively diagnosed at the National Center for Child Health and Development in Japan. Accordingly, some types of lymphomas that occur in children may be elder than real age. Median ages at diagnosis were 68 years for B‐cell neoplasms, 70 years for T/NK‐cell neoplasms, 60 years for Hodgkin lymphoma, 69 years for histiocytic/dendritic cell neoplasms, 71 years for composite lymphoma, and 69 years for immunodeficiency‐associated lymphoproliferative disorder. Hence, with the exception of Hodgkin lymphoma, most major malignant lymphoma subtypes are diagnosed when patients are in their late 60s to 70s. The median and mean ages for the sub‐major subtypes were as follows: precursor B‐lymphoblastic leukemia/lymphoma, 31 and 32.06 years (n = 16); mediastinal B‐cell lymphoma, 40 and 49.16 years (n = 44); unclassifiable B‐cell lymphoma with features intermediate between those of DLBCL and classical Hodgkin lymphoma, 52 and 51.00 years (n = 6); precursor T‐lymphoblastic leukemia/lymphoma, 30 and 39.31 years (n = 58); ALK− anaplastic large cell lymphoma, 38 and 39.44 years (n = 39); nodular lymphocyte predominant Hodgkin lymphoma, 41 and 47.27 years (n = 11); and the nodular sclerosis type of classical Hodgkin lymphoma, 38 and 43.92 years old, respectively (n = 188).
3.3. Sex distribution
Similar to previous studies,5, 8 overall, the M/F ratio in our study was 1.17. Some subtypes showed male predominance (defined as an M/F ratio >3.0): MCL (M/F ratio, 3.57; n = 266), plasmablastic lymphoma (M/F ratio, 3.0; n = 12), lymphoblastic lymphoma (M/F, ratio 3.2; n = 42), and pyothorax‐associated lymphoma (M/F ratio, 5.0; n = 12). Only men had hairy cell leukemia (n = 2), Sezary syndrome (n = 3), hepatosplenic T‐cell lymphoma (n = 2), and malignant lymphoma not otherwise specified (n = 3); however, the number of cases were too small to refer to these as male‐predominant lymphomas. Only methotrexate‐associated lymphoproliferative disorders (MTX‐LPDs) showed female predominance (defined as an M/F ratio <0.5; M/F ratio, 0.49; n = 127). There were no significant differences in the M/F ratios for the major subtypes (1.14, 0.9, 1.22, 1.21, and 0.68 for DLBCL, FL, ATLL, AITL, and MALT, respectively) (Figure 5).
Figure 5.
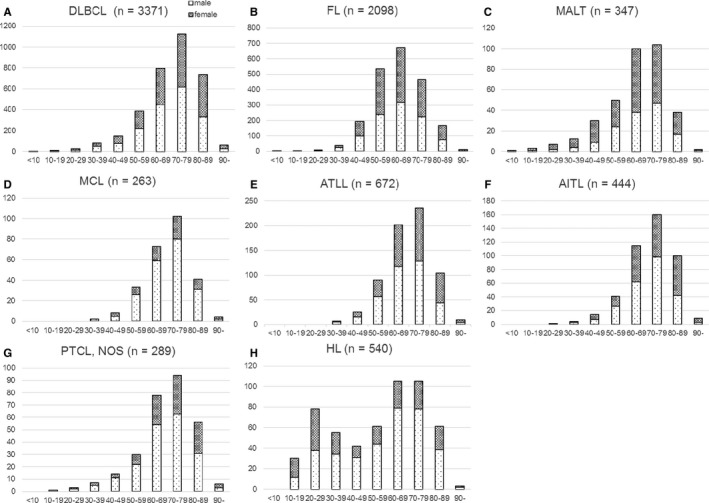
Number of representative lymphoid neoplasms according to age and sex in Japan from 2007‐2014. DLBLC: diffuse large B‐cell lymphoma; FL: follicular lymphoma; MALT: extranodal marginal zone lymphoma of mucosa‐associated lymphoid tissue; MCL: mantle cell lymphoma; ATLL: adult T‐cell leukemia/lymphoma; AITL: angioimmunoblastic T‐cell lymphoma; PTCL‐NOS: peripheral T‐cell lymphoma, not otherwise specified; HL: Hodgkin lymphoma
3.4. Secular trend of the age of onset for the major histological subtypes of malignant lymphoma
The age of onset for seven major subtypes (AITL, ATLL, DLBCL, FL, MALT, MCL, PTCL‐NOS) according to the time of diagnosis (2007‐2009, 2010‐2012, 2013‐2014) was determined. Onset age differed significantly across these time periods for ATLL (P = 0.0002), FL (P ≤ 0.0001), and DLBCL (P = 0.0002) only. Significant differences for ATLL, FL, and DLBCL were also apparent in analyses stratified for men (P = 0.0004, P < 0.0001, and P = 0.0001, respectively). As shown in Figure 6, significant differences were observed for FL (P = 0.0010) (Figure 6A) and DLBCL (P = 0.0448) (Figure 6B), but not ATLL (P = 0.3149) (Figure 6C), in analyses stratified for women.
Figure 6.
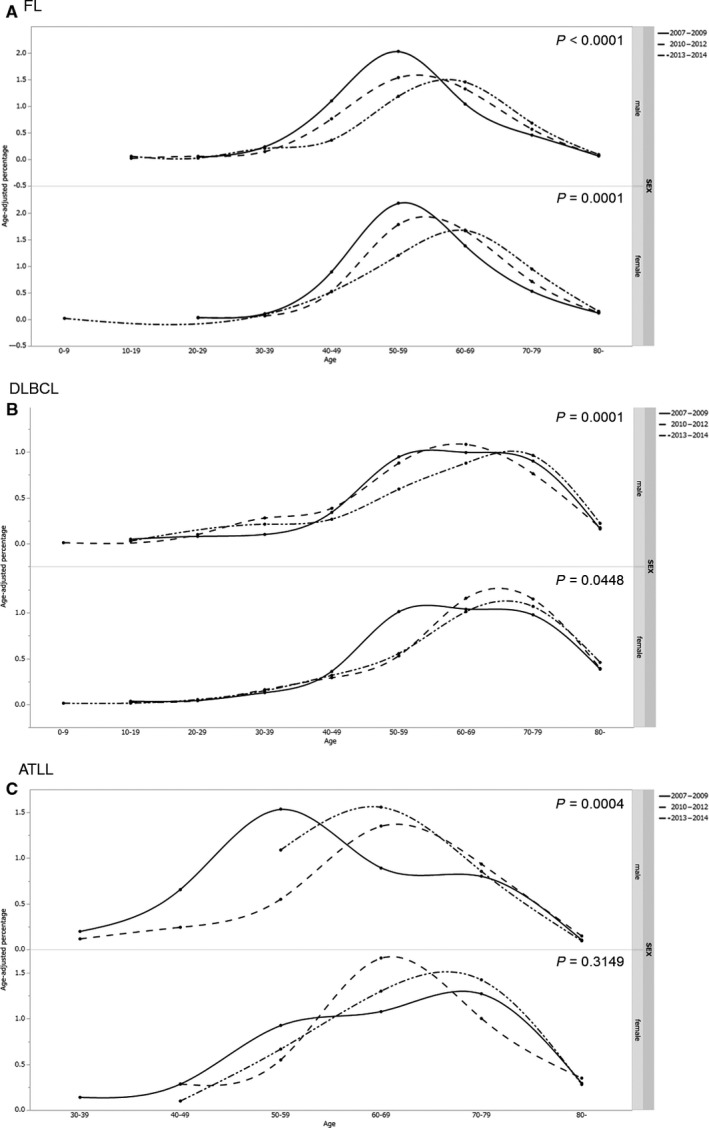
Secular trends in the onset age for FL, DLBCL, and ATLL. The top graph show significant differences in the onset age for FL (P < 0.0001) (A) DLBLC (P = 0.0001) (B) and ATLL (P = 0.0004) (C), across three time periods (2007‐2009, 2010‐2012, and 2013‐2014) in men. The bottom graph shows significant differences for FL (P = 0.0001) and DLBCL (P = 0.0448) but not ATLL (P = 0.3149) in women. ATLL: adult T‐cell leukemia/lymphoma, FL: follicular lymphoma, DLBCL: diffuse large B‐cell lymphoma
4. DISCUSSION
Although most of the findings of this study confirmed those of previous reports,7, 8 some novel observations were made, as detailed below.
4.1. FL
The proportion of FL is higher in Western countries (32% in Omaha, NE, USA; 31% in Vancouver, Canada; and 28% in London, UK) than in Asian regions (8% in Hong Kong, China).2 In Japan, it has gradually increased: 6% in 1996‐2000,12 18.3% in 2000‐2006,8% and 22.4% in 2007‐2014 (the present study) (Figure 7). Hence, the proportion of FL in Japan is approaching that in Europe and the United States.
Figure 7.
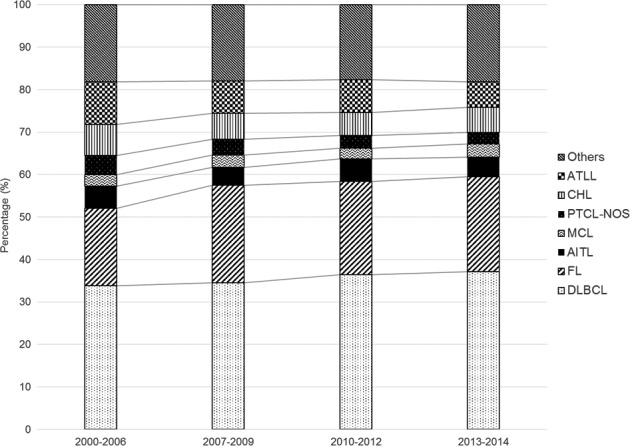
Secular trends in the frequency of representative histological lymphoma subtypes. A gradual increase in the proportion of FL is shown (18.3%, 23%, 21.9%, and 22.4% in 2000‐2006, 2007‐2009, 2010‐2012, and 2013‐2014, respectively). The percentages for 2000‐2006 were taken from the study by Aoki et al8 Others: other hematopoietic and lymphoid malignancies; ATLL: adult T‐cell leukemia/lymphoma; CHL: classic Hodgkin lymphoma; PTCL‐NOS: peripheral T‐cell lymphoma, not otherwise specified; MCL: mantle cell lymphoma; AITL: angioimmunoblastic T‐cell lymphoma; FL: follicular lymphoma; DLBCL: diffuse large B‐cell lymphoma
The onset age for FL in Asian countries is lower than that reported in international studies (59 years),13 with 54 years in southwest China,14 52 years in eastern India,15 and 52.5 years in Korea.16 Our study shows a gradual increase in the median and mean age of patients with FL in Japan (P < 0.0001). These findings show that the onset age for FL is shifting from an Asian pattern to a Western pattern for reasons unknown.
4.2. DLBCL
Our study shows that onset age for DLBCL has increased in Japan (P = 0.0002) (Figure 6B). The median onset age for DLBCL in Japan was 72 years (mean age, 69.56 years), which is much higher than the median ages in Korea (59 years), 17 China (55 years),14 and internationally (64 years).13
The reason for the increasing onset age for DLBCL in Japan is unclear, but one hypothesis is worth noting. The proportion of secondary DLBCL, which tends to develop at a more advanced age than primary DLBCL, may be increasing. Due to a universal care system, elderly patients in Japan often receive chemotherapy, including molecular targeting therapy. Consequently, those with low‐grade malignant lymphomas survive longer, allowing more time for secondary DLBCL to arise.
In addition, although detailed risk factors of DLBCL have not yet been revealed, potential risk factors affecting the onset age for DLBCL include chronic inflammation18, 19 and an immunocompromised state due to advanced age,20 acquired immunodeficiency syndrome,21 primary immune disorders,22 certain medications,23 and transplants.24
4.3. ATLL
Adult T‐cell leukemia/lymphoma is caused by HTLV‐1, which is most prevalent in the southern regions of Japan, such as Kyushu and Okinawa.25 Hence, the geographical distribution of ATLL differs throughout Japan.
The onset age for ATLL differed significantly according to the year of diagnosis (2007‐2009, 2010‐2012, or 2013‐2014) (P = 0.002). Significant differences were also observed in analyses stratified for men (P = 0.0004), but not for women (P = 0.3149). There were no constant trends for both men and women (Figure 6C); in men, the onset age for ATLL was lowest in 2007‐2009, followed in order by 2013‐2014 and 2010‐2012. In women, onset age was lowest in 2010‐2012, followed in order by 2013‐2014 and 2007‐2009. Thus, although the differences between the time periods were statistically significant, we considered them to be essentially nonsignificant.
4.4. MTX‐LPD
Methotrexate‐associated lymphoproliferative disorder is an “other iatrogenic immunodeficiency‐associated lymphoproliferative disorder” that occurs in patients treated with MTX.5 In this study, the median age at which MTX‐LPD was diagnosed was 69 years, and the M/F ratio was 0.49. This female predilection presumably reflects the frequency of autoimmune diseases in women, including rheumatoid arthritis (RA).26 The number of MTX‐LPD cases has increased since 2008 (Figure 8). Two events may account for this increase: first, its inclusion in the 4th edition of the WHO guidelines in 2008, which widened its recognition by clinicians and second, the increased use of MTX. MTX was indicated for rheumatoid arthritis in 1999 and become the drug of first alternative in 2011 in Japan.
Figure 8.
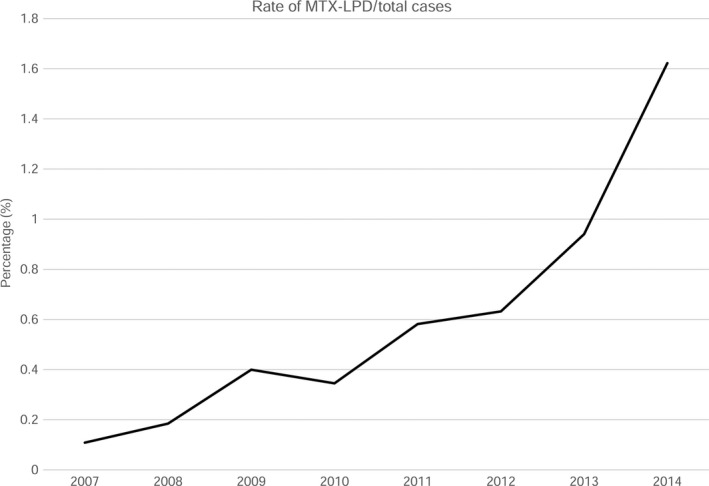
Frequency of MTX‐LPD cases per total hematopoietic and lymphoid tissue neoplasm cases from 2007‐2014. The frequency of MTX‐LPD cases was 0.11%, 0.18%, 0.40%, 0.35%, 0.58%, 0.63%, 0.94%, and 1.6% in 2011‐2014, respectively. MTX‐LPD: methotrexate‐associated lymphoproliferative disorder
4.5. Strengths and limitations
The strengths of our study are as follows. First, to the best of our knowledge, it is the largest epidemiological analysis performed in Japan, with >9000 cases. Second, all cases were diagnosed by the same pathologist, thus eliminating the need for resolution of diagnostic differences. Third, because Japan consists of essentially one race, consideration of racial factors was unnecessary.
Our study did, however, have limitations. First, most of the specimens were submitted to us by hematologists. Because some malignant lymphomas (eg, MALT lymphomas) are also treated by gastroenterologists, ophthalmologists, and dermatologists, their frequencies may be greater than reported here. Second, the frequency of subtypes usually diagnosed via analysis of peripheral blood (eg, hairy cell leukemia, CLL/SLL, and acute types of ATLL) may have been underestimated because blood samples were not submitted to us. Third, because ATLL has several histological forms, measurement of HTLV‐1 antibody levels and detection of monoclonal integration of the HTLV‐1 provirus are necessary for an accurate diagnosis.27 However, these assays were probably not performed in regions in which HTLV‐1 is not endemic, potentially resulting in underestimation of ATLL frequency. Fourth, as noted above, patients ≤15 years old in Japan are almost exclusively diagnosed in a hospital specializing in pediatrics. Therefore, the true epidemiology of some lymphoma subtypes may not be reflected in our study. Fifth, although we received data for this study from throughout Japan, the proportion of data received from Kyushu and Okinawa was relatively high. Thus, there is a possible bias caused by geographical distribution. Table 2 shows a comparison between the present study and related epidemiological studies in Japan. Although the present study included many specimens from Kyushu and Okinawa, which reportedly have high numbers of ATLL cases, Table 2 shows that the proportion of T‐cell lymphomas was relative low compared to that reported in previous studies. The reason for this is unclear, but it may be due to an increased proportion of FL and DLBCL. Finally, knowledge of a patient’s history of MTX therapy is essential for diagnosis of MTX‐LPD. However, the accuracy of such information may vary from hospital to hospital. In Japan, MTX is often prescribed by orthopedic specialists and rheumatologists. Large hospitals have many departments (eg, Orthopedics and Rheumatology) that share information about MTX administration, and thus, this information is likely reliable. On the other hand, in clinics or small hospitals, information about MTX use may not be readily available because MTX may have been prescribed elsewhere. Thus, the frequency of MTX‐LPD in small hospitals and clinics may be underestimated.
Table 2.
Comparison with related epidemiological studies in Japan
|
Current study (2007‐2014) (n = 9424) (%) |
LSG of Japanese pathologist (1994‐1996) (n = 3194) (%) |
Chihara et al (2003‐2008) (n = 125148) (%) |
|
|---|---|---|---|
| B‐cell neoplasms | 71.72 | 68.53 | |
| T/NK‐cell neoplasms | 18.52 | 24.92 | |
| Hodgkin lymphoma | 5.76 | 4.41 | 5.90 |
| Histiocytic/dendritic cell neoplasms | 0.15 | 0.31 | |
| Other hematopoietic neoplasms | 3.85 | ||
| B‐cell neoplasms | |||
| Precursor B‐lymphoblastic leukemia/lymphoma | 0.17 | 2.35 | |
| Plasmablastic lymphoma | 0.13 | ||
| CLL/SLL | 1.11 | 1.31 | 3.20 |
| Lymphoplasmacytic lymphoma | 0.45 | 0.69 | |
| Mantle cell lymphoma | 2.82 | 2.79 | 2.0 |
| Follicular lymphoma | 22.39 | 6.70 | 13.50 |
| Nodal marginal zone B‐cell lymphoma | 0.62 | 1.00 | |
| Extranodal marginal zone B‐cell lymphoma (MALT) | 3.72 | 8.45 | |
| Splenic marginal zone B‐cell lymphoma | 0.24 | 0.13 | |
| Hairy cell leukemia | 0.02 | 0.16 | |
| Plasma cell neoplasms | 0.42 | 1.10 | |
| Diffuse large B‐cell lymphoma | 36.05 | 33.34 | 45.30 |
| Mediastinal large B‐cell lymphoma | 0.47 | 0.25 | |
| Intravascular large B‐cell lymphoma | 0.32 | 0.09 | |
| Pyothorax‐associated lymphoma | 0.13 | 0.28 | |
| Burkitt lymphoma | 0.70 | 1.00 | 1.30 |
| Other B‐cell lymphomas | 2.88 | ||
| T/NK‐cell neoplasms | |||
| T‐cell prolymphocytic leukemia | 0.05 | 0.06 | |
| Precursor T‐lymphoblastic leukemia/lymphoma | 0.62 | 1.72 | |
| Extranodal NK/T‐cell lymphoma, nasal type | 0.68 | 2.60 | |
| MF/Sezary syndrome | 0.20 | 1.16 | |
| MF | 0.17 | 1.0 | |
| Sezary syndrome | 0.03 | ||
| Angioimmunoblastic T‐lymphoma | 4.75 | 2.35 | 2.0 |
| Peripheral T‐cell lymphoma, not otherwise specified | 3.12 | 6.67 | 4.10 |
| Adult T‐cell leukemia/lymphoma | 7.18 | 7.45 | 8.30 |
| Anaplastic large cell lymphoma | 1.16 | 1.53 | 1.10 |
| Enteropathy‐type‐T‐cell lymphoma | 0.14 | 0.25 | |
| Hepatosplenic T‐cell lymphoma | 0.02 | 0.06 | |
| Primary cutaneous CD30 positive T‐cell lymphoproliferative disorders | 0.28 | 0.25 | |
| Subcutaneous panniculitis‐like T‐cell lymphoma | 0.05 | 0.06 | |
| Other T/NK‐cell lymphomas | 0.27 | ||
| Hodgkin lymphoma | |||
| Nodular LP Hodgkin lymphoma | 0.12 | 0.16 | |
| Classical Hodgkin lymphoma | |||
| NS classical Hodgkin lymphoma | 1.99 | 1.78 | |
| MC classical Hodgkin lymphoma | 2.98 | 1.63 | |
| LR classical Hodgkin lymphoma | 0.08 | 0.25 | |
| LD classical Hodgkin lymphoma | 0.37 | 0.25 | |
| Hodgkin lymphoma‐not otherwise specified | 0.20 | ||
5. CONCLUSION
This study shows that the proportion of FL in Japan has increased between 2007 and 2014, as has the onset age for FL and DLBCL. Future monitoring of this trend should continue in the future, and the reasons for these increases should be determined.
CONFLICT OF INTEREST
None declared.
ACKNOWLEDGMENTS
We express our appreciation to the 396 hospitals and clinics that submitted tissue samples and clinical information to us.
Muto R, Miyoshi H, Sato K, et al. Epidemiology and secular trends of malignant lymphoma in Japan: Analysis of 9426 cases according to the World Health Organization classification. Cancer Med. 2018;7:5843–5858. 10.1002/cam4.1805
REFERENCES
- 1. Herrinton LJ, Goldoft M, Schwartz SM, Weiss NS. The incidence of non‐Hodgkin’s lymphoma and its histologic subtypes in Asian migrants to the United States and their descendants. Cancer Causes Control. 1996;7:224‐230. [DOI] [PubMed] [Google Scholar]
- 2. Anderson JR, Armitage JO, Weisenburger DD. Epidemiology of the non‐Hodgkin’s lymphomas: distributions of the major subtype differ by geographic location. Non‐Hodgkin's Lymphoma Classification Project. Ann Oncol. 1998;9:717‐720. [DOI] [PubMed] [Google Scholar]
- 3. Au WY, Gascoyne RD, Klasa RD, et al. Incidence and spectrum of non‐Hodgkin lymphoma in Chinese migrants to British Colombia. Br J Haematol. 2005;128:792‐796. [DOI] [PubMed] [Google Scholar]
- 4. Morton LM, Wang SS, Devesa SS, Hartge P, Weisenburger DD, Linet MS. Lymphoma incidence patterns by WHO subtype in the United States, 1992–2001. Blood. 2006;107:265‐276. [DOI] [PMC free article] [PubMed] [Google Scholar]
- 5. Steven HS, Elias C, Nancy LH, Elain SJ, Stefano AP, Harald S et al, eds. WHO Classification of Tumours of Haematopoietic and Lymphoid Tissues, 4th edn Geneva: WHO Press; 2008. [Google Scholar]
- 6. Vose J, Armitage J, Weisenburger D. International peripheral T‐cell and natural killer/T‐cell lymphoma study: pathology findings and clinical outcomes. J Clin Oncol. 2008;26:4124‐4130. [DOI] [PubMed] [Google Scholar]
- 7. Lymphoma Study Group of Japanese Pathologists . The world health organization classification of malignant lymphomas in Japan: incidence of recently recognized entities. Pathol Int. 2000;50:696‐702. [DOI] [PubMed] [Google Scholar]
- 8. Aoki R, Karube K, Sugita Y, et al. Distribution of malignant lymphoma in Japan: analysis of 2260 cases, 2001–2006. Pathol Int. 2008;58:174‐182. [DOI] [PubMed] [Google Scholar]
- 9. Ohshima K, Takeo H, Kikuchi M, et al. Heterogeneity of Epstein‐Barr virus infection in angioimmunoblastic lymphadenopathy type T‐cell lymphoma. Histopathology. 1994;25:569‐579. [DOI] [PubMed] [Google Scholar]
- 10. Ohshima K, Kikuchi M, Masuda Y, et al. Defective provirus form of human T‐cell leukemia virus type I in adult T‐cell leukemia/lymphoma: clinicopathological features. Cancer Res. 1991;51:4639‐4642. [PubMed] [Google Scholar]
- 11. Guo Y, Karube K, Kawano R, et al. Low‐grade follicular lymphoma with t(14;18) presents a homogeneous disease entity otherwise the rest comprises minor groups of heterogeneous disease entities with Bcl2 amplification, Bcl6 translocation or other gene aberrances. Leukemia. 2005;19:1058‐1063. [DOI] [PubMed] [Google Scholar]
- 12. Nakamine H, Nanba K, Ohshima K, et al. Trends in the incidence of Hodgkin lymphoma and follicular lymphoma. Nihon Byori Gakkai Kaishi. 2002;91:346. (Japanese). [Google Scholar]
- 13. The Non‐Hodgkin’s Lymphoma Classification Project . A clinical evaluation of the international lymphoma study group classification of non‐Hodgkin’s lymphoma. Blood. 1997;89:3909‐3918. [PubMed] [Google Scholar]
- 14. Yang QP, Zhang WY, Yu JB, et al. Subtype distribution of lymphomas in Southwest China: analysis of 6,382 cases using WHO classification in a single institution. Diagn Pathol. 2011;6:77. [DOI] [PMC free article] [PubMed] [Google Scholar]
- 15. Mondal SK, Mandal PK, Samanta TK, Chakaborty S, Roy SD, Roy S. Malignant lymphoma in Eastern India: a retrospective analysis of 455 cases according to World Health Organization classification. Indian J Med Paediatr Oncol. 2013;34:242‐246. [DOI] [PMC free article] [PubMed] [Google Scholar]
- 16. Yoon SO, Suh C, Lee DH, et al. Distribution of lymphoid neoplasms in the Republic Korea: analysis of 5318 cases according to the World Health Organization classification. Am J Haematol. 2010;85:760‐764. [DOI] [PubMed] [Google Scholar]
- 17. Hong J, Lee S, Chun G, et al. Baseline renal function as a prognostic indicator in patients with newly diagnosed diffuse large B‐cell lymphoma. Blood Res. 2016;51:113‐121. [DOI] [PMC free article] [PubMed] [Google Scholar]
- 18. Iuchi K, Ichimiya A, Akashi A, et al. Non‐Hodgkin's lymphoma of the pleural cavity developing from long‐standing pyothorax. Cancer. 1987;60:1771‐1775. [DOI] [PubMed] [Google Scholar]
- 19. Aozasa K, Ohsawa M, Iuchi K, et al. Artificial pneumothorax as a risk factor for development of pleural lymphoma. Jpn J Cancer Res. 1993;84:55‐57. [DOI] [PMC free article] [PubMed] [Google Scholar]
- 20. Oyama T, Yamamoto K, Asano N, et al. Age‐related EBV‐associated B‐cell lymphoproliferative disorders constitute a distinct clinicopathologic group: a study of 96 patients. Clin Cancer Res. 2007;13:5124‐5132. [DOI] [PubMed] [Google Scholar]
- 21. Beral V, Peterman T, Berkelman R, Jaffe H. AIDS‐associated non‐Hodgkin lymphoma. Lancet. 1991;337:805‐809. [DOI] [PubMed] [Google Scholar]
- 22. Shapiro RS. Malignancy in the setting of primary immunodeficiency: implication for hematologist/oncologist. Am J Hematol. 2011;86:48‐55. [DOI] [PubMed] [Google Scholar]
- 23. Ichikawa A, Arakawa F, Kiyasu J, et al. Methotrexate/iatrogenic lymphoproliferative disorders in rheumatoid arthritis: histology, Epstein Barr virus and clonality are important predictors of the disease progression and regression. Eur J Haematol. 2013;91:20‐28. [DOI] [PubMed] [Google Scholar]
- 24. Clarke CA, Morton LM, Lynch C, et al. Risk of lymphoma subtypes after solid organ transplantation in the United States. Br J Cancer. 2013;109:280‐288. [DOI] [PMC free article] [PubMed] [Google Scholar]
- 25. Yamaguchi K. Human T‐lymphotropic virus type 1. Lancet. 1994;343:213‐216. [DOI] [PubMed] [Google Scholar]
- 26. Lee DM, Weinblatt ME. Rheumatoid arthritis. Lancet. 2001;358:903‐911. [DOI] [PubMed] [Google Scholar]
- 27. Ohshima K. Pathological features of diseases associated with human T‐cell leukemia virus type 1. Cancer Sci. 2007;98:772‐778. [DOI] [PMC free article] [PubMed] [Google Scholar]


