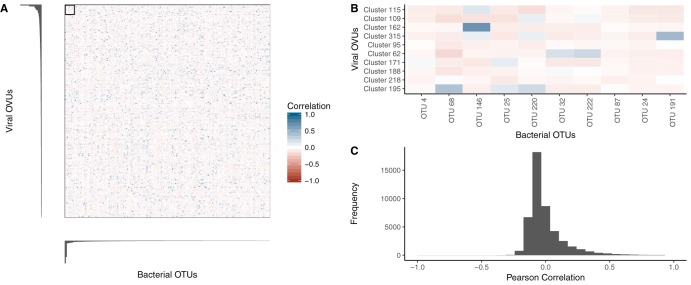
FIG 4.
Relative-abundance correlations between bacterial OTUs and virome OVUs. (A) Pearson correlation coefficient values from comparisons between all bacterial OTUs (x axis) and viral OVUs (y axis), with blue representing positive correlations and red representing negative correlations. Bar plots indicate the levels of viral (left) and bacterial (bottom) operational unit importance in their colorectal cancer classification models, such that the most important units are shown in the top left corner. (B) Magnification of the boxed region in panel A, highlighting the correlation between the most important bacterial OTUs and virome OVUs. The most important operational units are shown in the top left corner of the heat map, and the correlation scale is the same as in panel A. (C) Histogram quantifying the frequencies of Pearson correlation coefficients between all bacterial OTUs and virome OVUs.

