

Abstract
Motivation
Genome-wide clustered, regularly interspaced, short palindromic repeat (CRISPR)-Cas9 screen has been widely used to interrogate gene functions. However, the rules to design better libraries beg further refinement.
Results
We found single guide RNA (sgRNA) outliers are characterized by higher G-nucleotide counts, especially in regions distal from the PAM motif and are associated with stronger off-target activities. Furthermore, using non-targeting sgRNAs as negative controls lead to strong bias, which can be mitigated by using sgRNAs targeting multiple ‘safe harbor’ regions. Custom-designed screens confirmed our findings and further revealed that 19 nt sgRNAs consistently gave the best signal-to-noise ratio. Collectively, our analysis motivated the design of a new genome-wide CRISPR/Cas9 screen library and uncovered some intriguing properties of the CRISPR-Cas9 system.
Availability and implementation
The MAGeCK workflow is available open source at https://bitbucket.org/liulab/mageck_nest under the MIT license.
Supplementary information
Supplementary data are available at Bioinformatics online.
1 Introduction
The clustered, regularly interspaced, short palindromic repeat (CRISPR)-Cas9 system is a new genome editing technology that becomes prominent in many biomedical research areas. In this system, single guide RNAs (sgRNAs) direct Cas9 nucleases to induce double-strand breaks at targeted genomic regions (Cong et al., 2013; Jinek et al., 2012; Mali et al., 2013). Based on this system, CRISPR-Cas9 loss-of-function screens can interrogate the functions of coding genes (Koike-Yusa et al., 2014; Shalem et al., 2014; Wang et al., 2014; Zhou et al., 2014) and non-coding elements (Canver et al., 2015; Korkmaz et al., 2016; Zhu et al., 2016), and generate hypotheses on cell dependency, drug response, and gene regulation in a high-throughput and unbiased manner (Diao et al., 2016; Hart et al., 2015; Parnas et al., 2015; Wang et al., 2015). From a computational biology perspective, several algorithms have been developed to characterize sgRNAs with high specificity and efficiency (Doench et al., 2016; Doench et al., 2014; Hsu et al., 2013; Xu et al., 2015) that can be used in designing CRISPR screen libraries. Despite these efforts, methods for designing CRISPR screens are still being refined from different aspects. First, sgRNA outliers, or sgRNAs with discrepant behaviors from other sgRNAs targeting the same gene, are common in screen data, but their features and mechanisms remain poorly characterized. Second, it’s known that spacer length may vary in the CRISPR-Cas9 system (Fu et al., 2014; Morgens et al., 2017), but the optimal length was only studied in single guide and single target. Furthermore, it remains unclear how spacer lengths affect signal-to-noise ratio (the extent of the fold changes of guides compared to their variances) in the screening settings.
We studied both issues based on the MAGeCK-VISPR model we previously developed (Jiang et al., 2015; Li et al., 2015). By examining published screens (Wang et al., 2014, 2015), we identified outlier sgRNAs and uncovered their sequence features to inform future library design. We further showed stronger off-target cleavages contribute to the outlier behaviors. We also found a strong bias in CRISPR screen when normalizing read counts with commonly used non-targeting sgRNAs and proposed an alternative normalization to mitigate such bias. We performed custom-designed screens to validate these findings, and further explored sgRNA design rules that can improve the screening results, including the optimal spacer length for higher cutting efficiencies and better signal-to-noise ratios. Finally, we designed a genome-wide CRISPR/Cas9 screening library based on these new rules and demonstrated its performance in identifying known essential genes in different cell types.
2 Materials and methods
2.1 The MAGeCK and MAGeCK-VISPR model
Our laboratory has previously developed algorithms MAGeCK and MAGeCK-VISPR for identifying CRISPR screen hits in different scenarios(Li et al., 2014, 2015). In two-condition comparisons, MAGeCK uses a negative binomial (NB) model to assess the degree of selections of individual sgRNAs and adopts robust rank aggregation (RRA) algorithm (Kolde et al., 2012) to aggregate multiple sgRNAs on a gene to evaluate gene selection. MAGeCK-VISPR (Li et al., 2015) further quantitatively estimates gene selections by optimizing a joint likelihood function of observing the read counts of different sgRNAs with varying behaviors in multiple conditions. The output of MAGeCK-VISPR is a ‘beta score’ for gene in condition , , analogous to the ‘log fold change (LFC)’ in differential gene expression analysis. More specifically, the read count of sgRNA in sample , or is modeled as:
Where and are the mean and over-dispersion factor of the NB distribution, respectively. The mean value is further modeled as:
Where is the size factor of sample for adjusting sequencing depths of the samples, and is the vector of all beta scores for gene . To deal with complex experimental settings, we included design matrix (). With samples affected by conditions, is a binary matrix with its element if sample is affected by condition and 0 otherwise. The objective function is a form of regularization:
Where is the probabilistic density function (PDF) of the NB distribution, and
The estimated SD, , was calculated using the naive estimators of .
2.2 Identifying sgRNA outliers
sgRNA outliers are those that have different behaviors compared with other sgRNAs targeting the same gene. A single outlier that does not fit the assumed distributions can overly influence the estimations of the beta score. Therefore, we tried to identify these outliers using three-step approach: candidate outlier prediction, candidate outlier validation and outlier detection.
Step-1: Candidate outlier prediction
A sgRNA is likely to be an outlier if its log fold is extremely different from other sgRNAs. Therefore, in the first step, candidate outlier prediction, we identified the potential sgRNAs outliers by considering their LFCs. For each paired condition, we calculated the median and SD of the LFCs and defined the candidate outliers if their LFCs fall beyond median 1.5 SD estimation (. Specifically, we followed the ‘quantile matching’ approach in DESeq2 (Love et al., 2014): is chosen such that the (1–p) empirical quantile of the absolute values of LFC () matches the (1–p/2) theoretical quantile of (), where p is set as 0.32:
Note that for a distribution with a long tail, the traditional estimation of SD will be distorted. Assuming that samples with beta scores close to 0 follows normal distribution, we set a value of p = 0.32 to calculate SD using only the 68% of samples (samples within 1 SD) closes to zero. In this way, the samples with beta scores far from zero will not distort the estimation of SD.
Step-2: Candidate outlier in silico validation
Noticing that a sgRNA outlier may significantly influence the beta score estimation, a candidate outlier is validated if there is a significant change of beta score, after removing the candidate outlier. Therefore, in the second step, the candidate outlier in silico validation, we calculated the beta score with and without the candidate outlier respectively using Equation (1). Define:
, when all sgRNAs are used;
, when sgRNA is excluded.
Then candidate outlier is in silico validated if:
With outlier removal, we could prevent the beta score estimation from distortion by strong outliers.
Step-3: Outlier detection
With previous two steps, we could estimate the beta scores robustly. However, some moderate outliers cannot be identified if sufficient sgRNAs prevent the beta score from distortion by a single outlier. Therefore, with robust estimators of beta scores, in the final step, we re-defined a sgRNA as an outlier if the probability of observing its count conditioned on pre-calculated beta score falls below a certain threshold. In other words, sgRNA is an outlier if:
where is the PDF of the NB distribution. The threshold was determined such that 90% of the validated outliers defined in Step 2 can be removed.
2.3 Extracting sequence features using elastic-net regression
To identify the sequence features that associate with stronger sgRNA outliers, we applied Elastic-Net regression to extract the sequence features as our previous work (Xu et al., 2015). Suppose is the set of encoded sequence vectors and is the set of outputs representing whether the sgRNAs are stronger outliers, where is the number of sgRNAs samples for training. If sgRNA is an outlier, the corresponding and 0 otherwise. Let be the length of the input vectors; the Elastic-Net regression computes the parameters that minimize an object function E:
Where and are parameters estimated using cross validation, and . We used glmnet in R package to implement the Elastic-Net regression (Friedman et al., 2010).
2.4 CRISPR screening design and experimental procedure
We designed and performed a CRISPR screening experiment to study the effects of different normalization methods and different sgRNA lengths. The screening library has four types of sgRNAs: sgRNAs targeting AAVS1 (a region whose disruption does not have any lethal phenotype), non-targeting sgRNAs, sgRNAs targeting 51 ribosomal genes and 503 cancer-related genes that are considered to be lethal. The details of the library design and the experiment are in Supplementary Material.
3 Results
3.1 sgRNAs outlier identification and characterization
Different sgRNAs targeting the same gene can lead to varying phenotypes or selection levels in the screen due to different cleavage and repair efficiencies, local chromatin structure, protein domains and potential off-target effects, etc. (Hsu et al., 2013; Knight et al., 2015; Shi et al., 2015). Some sgRNAs with outlier phenotypes compared with other sgRNAs on the same gene, regardless of the causes, behave consistently in multiple screen conditions (Wang et al., 2015; Fig. 1a and b), suggesting that the discrepant phenotypes could arise from intrinsic features of the sgRNA in addition to random variances in the experiments. We are especially interested in ‘strong negative outliers’ (as Fig. 1a), which are defined as having much larger negative LFCs compared with other sgRNAs targeting the same gene and are more likely caused by off-target cleavages.
Fig. 1.
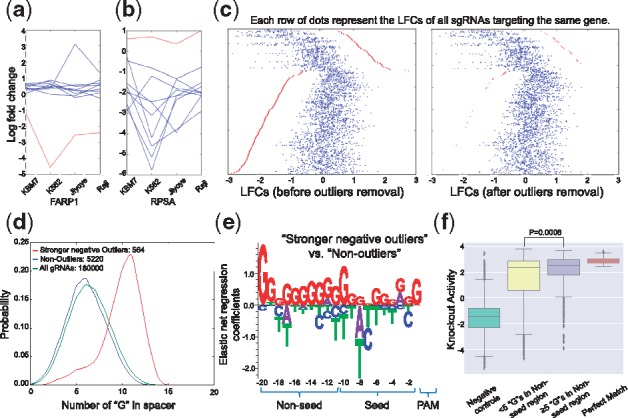
Identifying and characterizing stronger negative sgRNAs outliers. (a, b) The LFCs of 10 sgRNAs targeting FARP1 and RPSA in 4 screens (KBM7, K562, Jiyoye and Raji). The red lines represent sgRNAs outliers, and the blue lines represent other sgRNAs. (c) Identifying and removing aberrantly stronger negative outliers (red dots). Each row of dots represents the LFCs of sgRNAs targeting the same gene. (d) The G-nucleotide counts of sgRNAs in three groups: stronger negative outliers (red), non-outliers (blue) and all sgRNAs (green). (e) The sequence features of stronger negative outliers versus non-outliers derived by elastic-net regression. The ‘Seed’ and ‘Non-seed’ regions are defined as a 10-nucleotide window proximal to and distal from the PAM motif, respectively. The data for Figure 1a–e is from a public screening dataset (Wang et al., 2015). (f) The knockout of CD33 expression with different groups of sgRNAs. The ‘Perfect Match’ are 65 perfect-match sgRNAs with an NGG PAM that produced effective CD33 knockout defined in (Doench et al., 2016). The ‘Negative Controls’ are the same set of sgRNAs with non-NGG PAM. Those in ‘≥5 ‘G’s in Non-seed region’ and ‘<5 ‘G’ in Non-seed region’ are sgRNAs with an NGG PAM but 1-nt mismatch compared to the ‘Perfect Match’ sgRNAs
Based on the MAGeCK-VISPR model, we implemented an approach to identify such outliers, which tests whether one sgRNA has big effects on the gene-level beta score estimates or the probability of observing the sgRNA conditioned on the gene-level beta score is low (Section 2). This outlier detection and removal approach did identify sgRNAs with aberrant LFC on a gene (Fig. 1c). In published screens on four leukemia cell lines (Wang et al., 2015), 9000 out of 182 K sgRNAs on average were identified as outliers. Among them, 911 sgRNAs are outliers that are consistent in all four screens (Supplementary Fig. S1a) and 80% of these outliers (729/911) are ‘strong negative outliers’ with stronger negative selection compared with other gRNAs on the same gene (as Fig. 1a). To rule out the possibility that these sgRNAs knockout their intended targets with extremely high efficiencies, we further limited our analysis to 564 outliers (Supplementary Table S1) that target known non-essential genes (Hart and Moffat, 2016), as inactivating these genes is unlikely to affect cell growth.
Comparing the sequence features of these 564 ‘strong negative outliers’ with all 18 000 sgRNAs in the library, we found that they have higher G-nucleotide but lower C-nucleotide counts in the target DNA sequence (Fig. 1d, Supplementary Fig. S1b–d). To identify potential sequence features that can distinguish outliers and non-outliers, we trained an elastic net model (Friedman et al., 2010), a regularized regression method that considers both the L1 and L2 penalties of the lasso and ridge methods. In the training dataset, the predictor variable is a binary vector representing the presence or absence of the nucleotides, and the response variable is a binary variable indicating whether the gRNA is an outlier. Our model showed that outliers tend to contain more G-nucleotides in the 10-nucleotide non-seed region distal from the PAM motif (Fig. 1e). To exclude possible biases of a single library, we confirmed our finding using another screen dataset (Meyers et al., 2017; Supplementary Fig. S2a–b). We further tested our predictive model on other CRISPR-Cas9 knockout (Wang et al., 2014) or CRISPR-dCas9 inhibition screening (Horlbeck et al., 2016) datasets. The output of the model is an ‘outlier score’, indicating how likely the input sgRNA is an outlier. We found that ‘strong negative outliers’ in both datasets have significantly higher outlier scores than non-outliers (Supplementary Fig. S2c and d), suggesting outlier features we found are consistent across different datasets. These findings also suggest that a better CRISPR sgRNA design should at least avoid extreme G content in the non-seed region in case of potential off-target effects.
Considering that strong off-target activities can lead to ‘strong negative outliers’, we re-analyzed a previous study that measured the off-target activities between mismatched sgRNA: DNA pairs, defined as the decrease of CD33 protein level by sgRNAs with 1 nucleotide mismatch compared to the target DNA in CD33 locus (Doench et al., 2016). Instead of modeling off-target activities as functions of mismatched nucleotide pair and position as in (Doench et al., 2016), we tested how the nucleotide compositions in the Non-seed region affect the off-target activities. SgRNAs with more ‘G’s (≥5) in Non-seed region have significantly higher off-target activities than those with fewer ‘G’s (<5) (Fig. 1f). In contrast, there is no difference in off-target activities between sgRNAs with more (≥5) and fewer (<5) ‘C’s (Supplementary Fig. S2e). These findings suggest sgRNAs targeting sequences with high G-content in the non-seed region have stronger off-target activities, which can lead to strong outlier phenotypes.
3.2 SgRNAs targeting multiple non-essential genes as negative controls reduce false positives in the screen
Correct interpretations of genome-wide screens require proper read count normalization. Since most sgRNAs should generate knockouts without causing phenotype, a straightforward approach is to normalize based on the total read counts of all sgRNAs (Love et al., 2014; ‘total normalization’). Alternatively, many screen libraries include ‘non-targeting’ negative control sgRNAs, which match nowhere in the genome, for normalization (‘non-targeting sgRNA normalization’). In public datasets (Wang et al., 2014, 2015), ‘total normalization’ resulted in a beta-score distribution centered on zero (Supplementary Fig. S3a), while ‘non-targeting sgRNA normalization’ led to a skewed distribution of beta scores where most of the genes appear as negatively selected (Fig. 2a). The bias of ‘non-targeting sgRNA normalization’ is introduced when sgRNAs targeting non-essential genes impede cell growth from genome cleavage toxicity (Aguirre et al., 2016; Munoz et al., 2016), regardless of the gene knockout effects. Therefore, a more appropriate choice of negative controls is a set of sgRNAs targeting non-essential DNA regions. These sgRNAs have already been included in recent library design (Wang et al., 2017). Indeed, when normalizing read counts using sgRNAs targeting the ‘gold standard’ 927 non-essential genes previously derived from pooled shRNA screens (Hart et al., 2014), the beta score distribution is centered on zero (Fig. 2b).
Fig. 2.
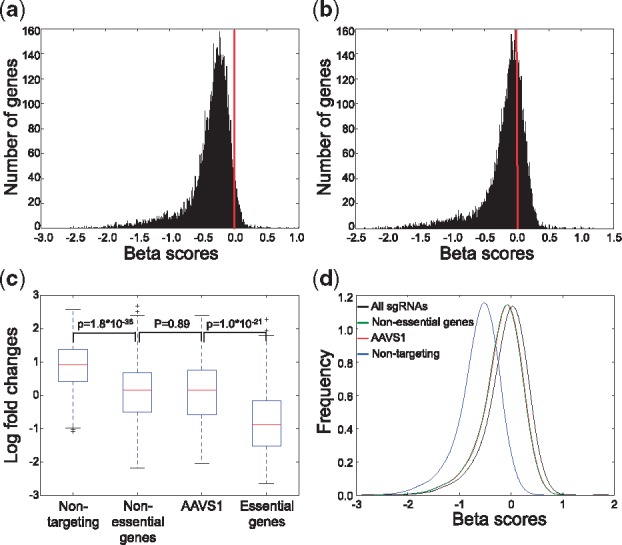
Normalizing read counts using sgRNAs targeting non-essential genes or AAVS1. (a-b) The distribution of beta scores in public dataset (Wang et al., 2015) using non-targeting sgRNAs (a) and sgRNAs targeting non-essential genes (b) for normalization. (c) The LFC distribution of 349 non-targeting sgRNAs, 467 non-essential genes-targeting sgRNAs, 133 AAVS1-targeting sgRNAs and 725 essential genes-targeting sgRNAs. P-values were calculated using two-sided Student’s t-test. (d) The distribution of beta score using all sgRNAs (black), non-essential genes-targeting sgRNAs (green), AAVS1-targeting sgRNAs (red) and non-targeting sgRNAs (blue) for normalizing read counts, respectively
In genome-wide screens, normalizations using either sgRNAs targeting non-essential genes or all genes lead to similar results (Fig. 2b, Supplementary Fig. S3a), as the majority of the genes are assumed to be non-essential. Such assumption may fail in focused (or custom) screens where many targeted genes may be under selection, which necessitates the selection of better negative control sgRNAs. AAVS1 (adeno-associated virus integration site 1) is a ‘safe harbor’ site preferred for gene knock-ins (DeKelver et al., 2010; Sadelain et al., 2011). This region appears to be epigenetically open for efficient cleavage, yet cutting or modification at this site results in no phenotypic changes (Ogata et al., 2003). To test whether sgRNAs targeting AAVS1 could serve as good negative controls, we first designed a genome-wide screen library containing 134 AAVS1-targeting sgRNAs, 349 non-targeting sgRNAs, as well as five sgRNAs per gene in the human genome and performed screening in a prostate cancer LNCaP-abl cell line. SgRNAs targeting AAVS1 or non-essential genes induced similar LFCs that are stronger than non-targeting sgRNAs, confirming the existence of cleavage toxicity in non-essential regions (Fig. 2c). Also, by comparing normalization methods using different sets of sgRNAs (all, non-targeting, AAVS1-targeting and non-essential-gene-targeting sgRNAs, respectively), we found normalization using the AAVS1- and non-essential-genes targeting sgRNAs result in almost identical distributions of beta scores (Fig. 2d). Moreover, both ‘all sgRNA normalization’ and ‘non-targeting sgRNA normalization’ lead to biases, though to different degrees (Fig. 2d). Since normalization using control guides is an essential step in many computational methods including MAGeCK-VISPR and CRISPR Score (CS; Wang et al., 2014), the results of these methods will also be affected by the choice of negative controls (Supplementary Fig. S3b). While methods that only rely on gRNA ranks such as MAGeCK-RRA (Li et al., 2014) will not be affected, the rankings could not clearly distinguish genes that are negatively, positively, or not selected, which are important when comparing screens over multiple conditions.
To evaluate the normalization methods in a focused screen, we also designed a small screening library that targets ∼600 genes, including ribosomal genes and well-known cancer-related genes (Section 2, Supplementary Tables S2 and S3). The library also includes the same set of AAVS1-targeting and non-targeting sgRNAs. Similar to genome-wide screens, AAVS1-targeting sgRNAs induced stronger negative selections compared with non-targeting sgRNAs (Supplementary Fig. S3c). Furthermore, using AAVS1-targeting sgRNAs as negative controls in our MAGeCK algorithm substantially increases the sensitivity of the screen, while keeping the same level of false positives (Supplementary Fig. S3d). These results validated the applicability of including AAVS1-targeting sgRNAs in genome-wide, and more importantly in focused screen libraries.
3.3 19 nt spacers give rise to higher cutting efficiencies and better signal-to-noise ratio
In spCas9 gene editing systems, truncated sgRNAs have been reported to have a better cleavage specificity compared with full-length sgRNAs (Fu et al., 2014). However, the performances of truncated sgRNAs in screens compared with full-length sgRNAs, as well as the optimal length of truncated sgRNAs, have yet to been fully determined. Therefore, in our small screening library, we designed sgRNAs with 20 nt spacers for each ribosomal gene and AAVS1-targeting sgRNAs and then truncated them to 19 nt, 18 nt and 17 nt (Section 2). We found that 19 nt sgRNAs give significantly stronger LFCs in ribosomal genes, reflecting higher cleavage efficiencies (Fig. 3a). If we use the difference between positive-control sgRNAs (sgRNAs targeting ribosomal genes) and negative-control sgRNA (AAVS1-targeting sgRNAs) as a metric for signal-to-noise, 19 nt spacers on average give the best performance (Supplementary Fig. S4a) in 11 of 12 screens. Moreover, for each ribosomal gene, 19 nt sgRNAs gave lower relative SD (i.e. SD divided by mean; Supplementary Material.) of LFCs, indicating a more stable behavior (and potentially less off-target cleavages) of gene knockout effects (Fig. 3b).
Fig. 3.
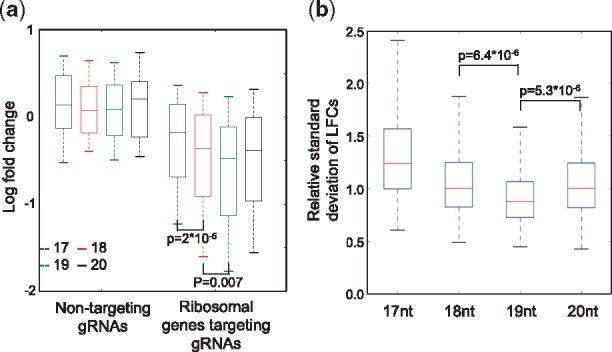
Comparing cleavage efficiencies and signal-to-noise ratios between different lengths of sgRNA spacers. (a) The LFCs of sgRNAs with spacer lengths ranging from 17- to 20-nts, including non-targeting sgRNAs and sgRNAs targeting ribosomal genes. For each spacer length, there are 100 non-targeting sgRNAs and 1020 ribosomal genes-targeting sgRNAs. P-values were calculated using two-sided Student’s t-test. (b) The relative SD of LFCs of sgRNAs targeting ribosomal genes with spacer lengths ranging from 17- to 20-nts. There are 612 data points (51 ribosomal genes repeated in 12 screens) for each spacer length. P-values were calculated using two-sided Student’s t-test
3.4 A new genome-wide library improved screen performance
Using the rules we uncovered in this study and our previous work (Xu et al., 2015), we designed two sub-libraries that target 18, 493 human coding genes (named ‘H1’ and ‘H2’; Supplementary Tables S4, S5). Each sub-library includes sgRNAs with 19 nt-long spacers and contains 134 AAVS1-targeting sgRNAs, 349 non-targeting sgRNAs, as well as five sgRNAs targeting each gene in the human genome. After removing sgRNAs that are enriched in G-nucleotide (>40%) and have perfect matches to other coding regions, we prioritized the remaining sgRNAs based on their predicted cleavage efficiencies(Xu et al., 2015) and the number of perfect matches in the whole genome (see Methods). We conducted screens in LNCaP, abl and T47D cell lines using the H1/H2 library and compared to other genome-wide screen datasets, including Brunello library (Doench et al., 2016), TKO library (Hart et al., 2015) and Ong library (Ong et al., 2017). We found H1/H2 is among the libraries with fewest outlier sgRNA rates (Supplementary Fig. S4b). Assuming that a good library should be able to rank known essential genes as most negatively selected ones, we found that H1/H2, Brunello and Ong libraries outperformed GeCKOv2 and TKO in identifying known essential genes (Supplementary Fig. S4c–d). These results provide support for our refined CRISPR screen library design rules.
4 Discussion
The CRISPR-cas9 knockout screen has been used to interrogate the functions of coding genes and non-coding elements systemically, but library design is still in their early stage. We first applied MAGeCK-VISPR to public genome-wide screen data and identified a set of ‘strong negative outlier’ sgRNAs and their sequence characteristics: higher G-nucleotide counts especially in regions distal from PAM motif. Unexpectedly, the effect of the outliers is independent of the count of C-nucleotide, different from previous studies that suggest the role of ‘GC’ content in determining cleavage efficiencies (Doench et al., 2014; Haeussler et al., 2016; Wang et al., 2014). Since G-C hybridization strengths in DNA-RNA and RNA-DNA hybrids are similar, the distinct effect of G- and C-nucleotides suggests a more crucial role of DNA-endonuclease rather than DNA-RNA interaction in determining outlier effects. Moreover, sgRNAs with higher G-contents in regions distal from PAM motif have stronger off-target activities. It is worth noting that the off-target activity of each sgRNA in Figure 1f was measured between one sgRNA-DNA pair, and the seemly minor difference between sgRNAs with high and low G-contents will be multiplied by the enormous mismatched sgRNA-DNA pairs in the genome and lead to sgRNA outliers in screens.
Although toxicity from CRISPR cutting has been reported, using non-targeting control for normalization is still a common practice in published literature (Aguirre et al., 2016; Wang et al., 2014). We found that normalization using non-targeting sgRNAs, as compared to using all sgRNAs or sgRNAs targeting non-essential genes, could lead to higher false positives (Supplementary Fig. S3d) in calling essential genes. The reason might be because cleavages in non-essential regions can still induce toxicity in cell growth, in consistency with two recent studies showing false positive hits from highly amplified regions in cancer genomes (Aguirre et al., 2016; Munoz et al., 2016). Through CRISPR screening experiments, we confirmed that sgRNAs targeting non-essential genes or safe-harbor regions could serve as better negative controls and result in fewer false positives compared with non-targeting sgRNAs. Since a single chromatin region may be subject to copy number variations in different cell types, sgRNAs targeting multiple non-essential regions will serve as more robust negative controls. For instance, only 5% (57/1, 043) CCLE cell lines have copy number gains in AAVS1 locus, such as HCC1937 and MDAMB157, suggesting that though chance is low, caution should be used when using single region as negative controls. Including correct negative controls is also necessary for custom-designed screens where genes are pre-selected and normalization using total read counts is inappropriate. We proposed a solution to reduce the biases by using either multiple non-essential genes or AAVS1-targeting guides.
Finally, sgRNAs with shorter lengths have been shown to be potent in efficiency and specificity (Fu et al., 2014), but the optimal performance of truncated sgRNAs with different lengths has not been systematically investigated in screen setting. We discovered that 19 nt sgRNAs consistently provide better cleavage efficiencies and signal-to-noise separations compared with other lengths (17, 18, 20 nt). Therefore, using 19 nt sgRNAs in either low-throughput experiments or high-throughput screens may give rise to a more accurate inference of gene knockout effects.
We demonstrated that H1/H2 libraries have improved performance in identifying known essential genes with less outlier sgRNAs. However, the fact that comparisons were not performed in the same cellular context might contribute to the observed differences. Also, since different libraries used distinct approaches to improve screen performance, integrating their respective advantages might further improve the next generation library design.
Although we characterized multiple features of CRISPR screens using computational approaches, the exact mechanisms behind these findings remain unknown. First, it is unclear how sgRNAs with higher G-nucleotide content are associated with stronger outliers. We suspected that outlier gRNAs with high G-nucleotides have promiscuous off-target binding and cutting at many CpG islands in the genome. Existing experimental approaches to detect off-target cleavages (Tsai et al., 2015) may be limited to study these gRNAs, as the cleavages in each binding site may be low. Second, although we have shown the advantages of using 19 bp sgRNA spacers from statistical perspectives, how different lengths of sgRNA spacers give rise to various cleavage strengths and off-targets remain to be determined. Last but not least, all the above findings are derived in the SpCas9 system, and the rules in different RNA-guided DNA endonuclease systems require further investigations.
Collectively, our study provided novel insights into the properties of CRISPR and the design of both high- and low throughput CRISPR experiments. We designed two genome-wide libraries and showed the improved performance using the rules we uncovered. The characterized features and design rules, as well as the libraries, will benefit and expedite the application of CRISPR techniques.
Funding
This work was supported by the NIH R01 HG008728, NIH R01 HG008927 and the Breast Cancer Research Foundation (BCRF). Funding for open access charge: National Institutes of Health. WL is supported in part by funds of the Center for Genetic Medicine Research and the Gilbert Family Neurofibromatosis Institute at Children’s National Health System.
Conflict of Interest: none declared.
Supplementary Material
References
- Aguirre A.J., et al. (2016) Genomic copy number dictates a gene-independent cell response to CRISPR-Cas9 targeting. Cancer Discov. ,6, 914. [DOI] [PMC free article] [PubMed] [Google Scholar]
- Canver M.C., et al. (2015) BCL11A enhancer dissection by Cas9-mediated in situ saturating mutagenesis. Nature ,527, 192–197. [DOI] [PMC free article] [PubMed] [Google Scholar]
- Cong L., et al. (2013) Multiplex genome engineering using CRISPR/Cas systems. Science ,339, 819–823. [DOI] [PMC free article] [PubMed] [Google Scholar]
- DeKelver R.C., et al. (2010) Functional genomics, proteomics, and regulatory DNA analysis in isogenic settings using zinc finger nuclease-driven transgenesis into a safe harbor locus in the human genome. Genome Res. ,20, 1133–1142. [DOI] [PMC free article] [PubMed] [Google Scholar]
- Diao Y., et al. (2016) A new class of temporarily phenotypic enhancers identified by CRISPR/Cas9-mediated genetic screening. Genome Res. ,26, 397–405. [DOI] [PMC free article] [PubMed] [Google Scholar]
- Doench J.G., et al. (2016) Optimized sgRNA design to maximize activity and minimize off-target effects of CRISPR-Cas9. Nat. Biotechnol. ,34, 184–191. [DOI] [PMC free article] [PubMed] [Google Scholar]
- Doench J.G., et al. (2014) Rational design of highly active sgRNAs for CRISPR-Cas9-mediated gene inactivation. Nat. Biotechnol. ,32, 1262–1267. [DOI] [PMC free article] [PubMed] [Google Scholar]
- Friedman J., et al. (2010) Regularization paths for generalized linear models via coordinate descent. J. Stat. Softw. ,33, 1–22. [PMC free article] [PubMed] [Google Scholar]
- Fu Y., et al. (2014) Improving CRISPR-Cas nuclease specificity using truncated guide RNAs. Nat. Biotechnol. ,32, 279–284. [DOI] [PMC free article] [PubMed] [Google Scholar]
- Haeussler M., et al. (2016) Evaluation of off-target and on-target scoring algorithms and integration into the guide RNA selection tool CRISPOR. Genome Biol. ,17, 148. [DOI] [PMC free article] [PubMed] [Google Scholar]
- Hart T., et al. (2014) Measuring error rates in genomic perturbation screens: gold standards for human functional genomics. Mol. Syst. Biol. ,10, 733. [DOI] [PMC free article] [PubMed] [Google Scholar]
- Hart T., et al. (2015) High-resolution CRISPR screens reveal fitness genes and genotype-specific cancer liabilities. Cell ,163, 1515–1526. [DOI] [PubMed] [Google Scholar]
- Hart T., Moffat J. (2016) BAGEL: a computational framework for identifying essential genes from pooled library screens. BMC Bioinformatics ,17, 164. [DOI] [PMC free article] [PubMed] [Google Scholar]
- Horlbeck M.A., et al. (2016) Compact and highly active next-generation libraries for CRISPR-mediated gene repression and activation. Elife, 5, e19760. [DOI] [PMC free article] [PubMed] [Google Scholar]
- Hsu P.D., et al. (2013) DNA targeting specificity of RNA-guided Cas9 nucleases. Nat. Biotechnol. ,31, 827–832. [DOI] [PMC free article] [PubMed] [Google Scholar]
- Jiang P., et al. (2015) Network analysis of gene essentiality in functional genomics experiments. Genome Biol. ,16, 239. [DOI] [PMC free article] [PubMed] [Google Scholar]
- Jinek M., et al. (2012) A programmable dual-RNA-guided DNA endonuclease in adaptive bacterial immunity. Science ,337, 816–821. [DOI] [PMC free article] [PubMed] [Google Scholar]
- Knight S.C., et al. (2015) Dynamics of CRISPR-Cas9 genome interrogation in living cells. Science ,350, 823–826. [DOI] [PubMed] [Google Scholar]
- Koike-Yusa H., et al. (2014) Genome-wide recessive genetic screening in mammalian cells with a lentiviral CRISPR-guide RNA library. Nat. Biotechnol. ,32, 267–273. [DOI] [PubMed] [Google Scholar]
- Kolde R., et al. (2012) Robust rank aggregation for gene list integration and meta-analysis. Bioinformatics ,28, 573–580. [DOI] [PMC free article] [PubMed] [Google Scholar]
- Korkmaz G., et al. (2016) Functional genetic screens for enhancer elements in the human genome using CRISPR-Cas9. Nat. Biotechnol. ,34, 192–198. [DOI] [PubMed] [Google Scholar]
- Li W., et al. (2015) Quality control, modeling, and visualization of CRISPR screens with MAGeCK-VISPR. Genome Biol. ,16, 281. [DOI] [PMC free article] [PubMed] [Google Scholar]
- Li W., et al. (2014) MAGeCK enables robust identification of essential genes from genome-scale CRISPR/Cas9 knockout screens. Genome Biol. ,15, 554. [DOI] [PMC free article] [PubMed] [Google Scholar]
- Love M.I., et al. (2014) Moderated estimation of fold change and dispersion for RNA-seq data with DESeq2. Genome Biol. ,15, 550. [DOI] [PMC free article] [PubMed] [Google Scholar]
- Mali P., et al. (2013) CAS9 transcriptional activators for target specificity screening and paired nickases for cooperative genome engineering. Nat. Biotechnol. ,31, 833–838. [DOI] [PMC free article] [PubMed] [Google Scholar]
- Meyers R.M., et al. (2017) Computational correction of copy number effect improves specificity of CRISPR-Cas9 essentiality screens in cancer cells. Nat. Genet. ,49, 1779–1784. [DOI] [PMC free article] [PubMed] [Google Scholar]
- Morgens D.W., et al. (2017) Genome-scale measurement of off-target activity using Cas9 toxicity in high-throughput screens. Nat. Commun. ,8, 15178. [DOI] [PMC free article] [PubMed] [Google Scholar]
- Munoz D.M., et al. (2016) CRISPR screens provide a comprehensive assessment of cancer vulnerabilities but generate false-positive hits for highly amplified genomic regions. Cancer Discov. ,6, 900. [DOI] [PubMed] [Google Scholar]
- Ogata T., et al. (2003) Identification of an insulator in AAVS1, a preferred region for integration of adeno-associated virus DNA. J. Virol. ,77, 9000–9007. [DOI] [PMC free article] [PubMed] [Google Scholar]
- Ong S.H., et al. (2017) Optimised metrics for CRISPR-KO screens with second-generation gRNA libraries. Sci. Rep. ,7, 7384. [DOI] [PMC free article] [PubMed] [Google Scholar]
- Parnas O., et al. (2015) A genome-wide CRISPR screen in primary immune cells to dissect regulatory networks. Cell ,162, 675–686. [DOI] [PMC free article] [PubMed] [Google Scholar]
- Sadelain M., et al. (2011) Safe harbours for the integration of new DNA in the human genome. Nat. Rev. Cancer, 12, 51–58. [DOI] [PubMed] [Google Scholar]
- Shalem O., et al. (2014) Genome-scale CRISPR-Cas9 knockout screening in human cells. Science ,343, 84–87. [DOI] [PMC free article] [PubMed] [Google Scholar]
- Shi J., et al. (2015) Discovery of cancer drug targets by CRISPR-Cas9 screening of protein domains. Nat. Biotechnol. ,33, 661–667. [DOI] [PMC free article] [PubMed] [Google Scholar]
- Tsai S.Q., et al. (2015) GUIDE-seq enables genome-wide profiling of off-target cleavage by CRISPR-Cas nucleases. Nat. Biotechnol. ,33, 187–197. [DOI] [PMC free article] [PubMed] [Google Scholar]
- Wang T., et al. (2015) Identification and characterization of essential genes in the human genome. Science ,350, 1096–1101. [DOI] [PMC free article] [PubMed] [Google Scholar]
- Wang T., et al. (2014) Genetic screens in human cells using the CRISPR-Cas9 system. Science ,343, 80–84. [DOI] [PMC free article] [PubMed] [Google Scholar]
- Wang T., et al. (2017) Gene essentiality profiling reveals gene networks and synthetic lethal interactions with oncogenic Ras. Cell, 168, 890–903, e815. [DOI] [PMC free article] [PubMed] [Google Scholar]
- Xu H., et al. (2015) Sequence determinants of improved CRISPR sgRNA design. Genome Res. ,25, 1147–1157. [DOI] [PMC free article] [PubMed] [Google Scholar]
- Zhou Y., et al. (2014) High-throughput screening of a CRISPR/Cas9 library for functional genomics in human cells. Nature ,509, 487–491. [DOI] [PubMed] [Google Scholar]
- Zhu S., et al. (2016) Genome-scale deletion screening of human long non-coding RNAs using a paired-guide RNA CRISPR-Cas9 library. Nat. Biotechnol., 34, 1279–1286. [DOI] [PMC free article] [PubMed] [Google Scholar]
Associated Data
This section collects any data citations, data availability statements, or supplementary materials included in this article.