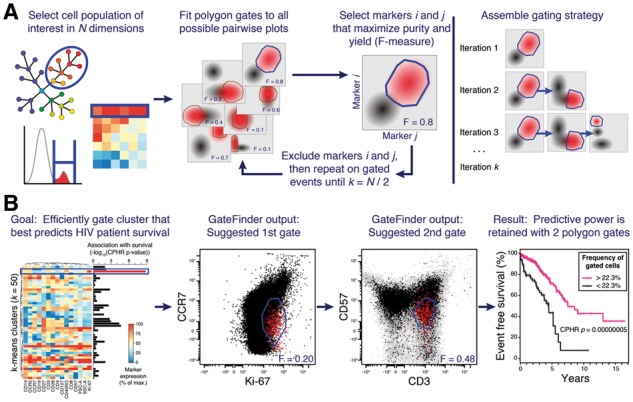
Fig. 1.

GateFinder produces optimal serial gating strategies for high-dimensional single-cell populations. (A) The researcher selects a target cell population using any number of dimensions (left panel). The algorithm searches all possible pairwise plots for the convex polygon gate that best segregates the target population (red) from the other cells in the dataset (black; center panels). To assemble a serial gating strategy, the search is repeated on the selected cells, ignoring markers used by earlier gates, until no markers are remaining (right panel). (B) In this example, the target population was defined as the k-means cluster that best predicted survival in 15-parameter polychromatic cytometry data an HIV cohort (Cluster 3; left panel, blue rectangle). Association with survival was quantified by Cox proportional hazards ratio. The first two gates from the serial gating strategy produced by GateFinder (center panels) clarified the phenotype of Cluster 3 as CCR7dim Ki-67dim CD57dim CD3+. The association with clinical outcome was nearly as strong in the cell population captured by the first two gates as it was in the 15-dimensional target population, Cluster 3 (right panel)
