

Abstract
Background
The level of suffering of chronically ill patients does not necessarily correlate with illness severity. In this study, we evaluated the burden of suffering and its impact on health-related quality of life in liver transplant recipients and liver cirrhosis patients.
Material/Methods
The Pictorial Representation of Illness and Self Measure (PRISM) was used to explore levels of suffering in outpatients of Münster University Hospital, Germany. Self-illness separation scores were analyzed as a measure of disease-specific burden of suffering. Health-related quality of life was measured using the Short Form Health Survey (SF-36).
Results
Data from 201 subjects were statistically analyzed. Median Self-illness separation scores for liver transplant recipients and patients with liver cirrhosis were 13.5 (minimum/maximum: 0.2/25.6) cm and 6.3 (0.1/25.6) cm (p<0.001), respectively. The median SF-36 Mental Component Summary and Physical Component Summary scores were 46.4 (12.5/66.2) and 40.1 (12.3/61.1), respectively. Higher health-related quality of life was associated with greater self–illness separation. Liver transplant recipients showed normal Mental Component Summary scores compared with the general German population; patients with liver cirrhosis had significantly lower Mental Component Summary scores. Physical Component Summary scores were significantly higher in liver transplant recipients than in patients with liver cirrhosis, but still lower than in the general population.
Conclusions
PRISM is a novel, simple tool for measuring the illness burden in liver transplant recipients and patients with liver cirrhosis. This measure may help to identify patients at a higher risk of psychological disorders.
MeSH Keywords: Liver Cirrhosis, Liver Transplantation, Quality of Life
Background
During the last few decades, quality of life, patient well-being, and burden of suffering have increasingly gained the interest of clinicians, as these parameters closely reflect physical and psychological aspects of patient health that may go unnoticed in daily routines. Furthermore, the assessment of health-related quality of life and suffering may help to identify patients at high risk of developing psychiatric disorders, such as reactive depression [1–3].
Several questionnaire-based tests have been used to assess health-related quality of life in patients with chronic liver diseases. One of the most widely used validated tools is the Short Form Health Survey (SF-36) [4]. This comprises 36 items that measure several aspects of physical and mental health. Final scores are expressed as T-scores and can be normalized to the population of interest [5,6]. However, the use of questionnaires to assess health-related quality of life and patient well-being in patients with chronic liver diseases is limited to clinical studies, as these tests are usually time consuming and burdensome for both clinician and patient. The Pictorial Representation of Illness and Self Measure (PRISM) provides a more practical alternative. The PRISM is a visual task that can be performed by patients in a few minutes using a magnetic board or a tablet computer and can therefore be easily incorporated into clinical routines. This innovative tool has been used to quantitatively measure illness-related suffering in various populations [2,7–11].
To the best of our knowledge, there are no studies exploring suffering in patients with chronic liver disease before and after liver transplantation (LT). However, reduction of the grade of suffering and a subsequent improvement of health-related quality of life after liver transplantation is a desirable important outcome. Therefore, the aim of this study was to assess the burden of suffering in patients with liver cirrhosis and in LT recipients using the PRISM. Moreover, we explored the impact of suffering (as quantified by the PRISM) on patients’ health-related quality of life (as measured by the SF-36).
Material and Methods
All patients referred to our outpatient clinic between October 2016 and April 2017 with a history of chronic liver disease or LT were consecutively enrolled in this prospective observational study. The study was approved by the Ethics Committee of Münster University Hospital on 28 April 2016 and was performed in accordance with the guidelines of the Declaration of Helsinki. Inclusion criteria were age over 18 years, a history of liver cirrhosis or LT, and written informed consent. Exclusion criteria were age under 18 years, inability or unwillingness to participate in the study, and decompensated chronic disease needing inpatient treatment.
PRISM procedure
We used an electronic version of the PRISM task, iPRISM, on an iPad® (Apple, Inc., Cupertino CA, USA). This electronic version of the PRISM task has been used in previous studies to assess illness-related suffering [9]. To simplify the interpretation of the results and the comparison with former studies, the diameters of the iPad were normalized to a DIN A4 format (210×297 mm). Subjects were asked to imagine that the white surface of the iPad represented their own life. A yellow circle with a diameter of 7 cm in the lower right-hand corner of the display represents the subject (the patient’s “self”). A smaller red circle with a diameter of 5 cm represents the liver disease/LT. All subjects received the following instruction: “Please drag the red circle to the position that your liver disease/LT now occupies in your life. You can position the red circle anywhere in your life, partially or even entirely on the yellow circle.” Figure 1 illustrates the iPRISM task. The distance between the centers of both circles ranging from 0 to 25.6 cm was defined as the Self–Illness Separation (SIS) score (greater distance indicates less burden of illness). The SIS was then normalized to a DIN A4 format to enable comparison with previous study findings.
Figure 1.
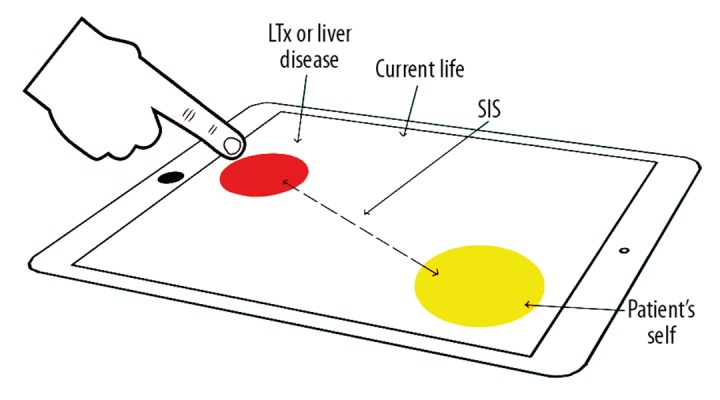
The PRISM task: Patients had to place the red illness circle on the surface of the iPad® which represents the patient’s life. The yellow circle represents the patient’s “self.” The distance between both circles reflects the patient’s burden of suffering. A greater distance between red and yellow circle indicates less burden of illness. LTx – liver transplantation; PRISM – pictorial representation of illness and self measure; SIS – self-illness separation.
Following previous studies, patients were subdivided into 3 groups according to their SIS scores: patients who placed the red “illness” circle totally outside the yellow “self” circle (SIS >6 cm), were categorized into group 1, those who placed the red circle partially in the yellow circle (SIS between 1.1 and 6 cm) were categorized into group 2, and those who placed the red circle completely inside the yellow circle (SIS between 0 and 1 cm) were categorized into group 3. This approach simplifies the calculation of the scores helps to classify the patients’ grade of suffering into minimal to mild, moderate and severe [9,12].
Quality of life and well-being
Subjects’ health-related quality of life and well-being were measured using the German version of the SF-36 questionnaire. The SF-36 assesses 8 aspects of patients’ physical and mental health-related quality of life. Subsequently, these 8 domains are reduced to 2 main summary scores: a physical health and a mental health summary component. Based on the mean and standard deviation of the German population [13], subjects’ scores were transformed to obtain a mean of 50 and a standard deviation of 10 using T-score linear transformation. Individual scores >50 are above the mean of the general German population and demonstrate a good health-related quality of life. Scores <50 are below the mean of the general population. Scores typically range from 20 to 60, with higher scores indicating better health-related quality of life [14]. Values <40 (>1 standard deviation below the standardized mean) indicate a poor health-related life quality, whereas scores >60 (>1 standard deviation above the standardized mean) represent a high health-related quality of life [14].
Statistical analysis
Statistical analysis was conducted using SPSS Statistics version 24.0 (SPSS, Inc., Chicago, Illinois, USA). Normally distributed continuous variables are presented as mean ± standard deviation. Non-normally distributed metric variables are reported as median (minimum, maximum).
As appropriate, the Mann-Whitney test or paired-samples t test was used to compare differences between 2 independent groups. Multivariable analysis (analysis of covariance [ANCOVA]) was used to assess the influence of independent factors on the target variables, which were PRISM distances and SF-36 generated scores. Resultant p-values ≤0.05 were considered statistically significant and were used as a measure of the strength of evidence against the respective null hypothesis.
Results
All patients were able to complete the iPRISM task without any difficulties. Data from 201 subjects were included in the statistical analysis. Of them, 101 (50.2%) were LT recipients and 79 (39.3%) were female. The mean age was 56 (±13.4) years. Table 1 shows detailed clinical and demographic data. There were no statistically significant differences in age, sex, body mass index, current employment, having children, educational level, or marital status between the 2 groups.
Table 1.
Patient clinical and demographic data.
| Characteristics | Liver cirrhosis patients | Liver transplant recipients | |
|---|---|---|---|
| N | 100 (49.8%) | 101 (50.2%) | |
| Age [years] | 56.0±13.8 | 56.0±13.1 | (p=0.82) |
| Sex [females/males] | 40 (40%)/60 (60%) | 39 (38.6%)/62 (61.4%) | (p=0.84) |
| BMI [kg/m2] | 26.6±5.5 | 27.0±6.0 | (p=0.82) |
| SIS [cm] | 6.3 (0.1/25.6) | 13.5 (0.2/25.6) | (p<0.001) |
| PCS | 38.9 (17.5/61.1) | 42.8 (12.3/59.7) | (p=0.046) |
| MCS | 44.0 (22.3/64.5); | 50.7 (12.5/66.2) | (p=0.007) |
| Current employment | 34 (34%) | 30 (29.7%) | (p=0.51) |
| Having children | 66 (34.0%) | 70 (69.3%) | (p=0.62) |
| MELD-Score | 11.3±5.8 (6/40) | n.a. | |
| Educational level (school years) | |||
| 9 | 48 (48%) | 35 (34.7%) | |
| 10 | 28 (28%) | 28 (27.7%) | |
| 12 | 11 (11%) | 23 (22.8%) | |
| College | 12 (12%) | 14 (13.9%) | |
| No information | – | 1 (1%) | |
| Marital status | |||
| Single | 15 (15%) | 20 (19.8%) | |
| Married/in a relationship | 69 (69%) | 62 (61.4%) | |
| Divorced | 12 (12%) | 14 (13.9%) | |
| Widowed | 3 (3%) | 5 (5%) | |
| No information | 1 (1%) | – | |
Results are reported as mean ± standard deviation; median (minimum/maximum), or absolute and relative frequencies. BMI – body mass index; LT – liver transplantation; MCS – mental component summary; MELD – model of end stage liver disease; PCS – physical component summary; SIS – self-lllness separation; n.a. – not applicable.
PRISM analysis
The median SIS score was significantly higher in LT recipients than in patients with liver cirrhosis (13.5 vs. 6.3 cm; p<0.001). We found no correlation between age and SIS (Spearman correlation coefficient=0.023). The Mann-Whitney results showed no influence of sex (p=0.64), current employment (p=0.17), having children (p=0.99), or marital status (p=0.33) on SIS scores.
SF-36 analysis
Both Physical Component Summary (PCS) and Mental Component Summary (MCS) scores, respectively, were significantly higher in LT recipients than in patients with liver cirrhosis (42.8 vs. 38.9; p=0.046 and 50.7 vs. 44.0; p=0.007).
The multivariable ANCOVA analysis showed that greater SIS was significantly associated with both higher PCS (p<0.001) and higher MCS (p<0.001). Other variables associated with higher MCS scores were LT (p=0.006) and current employment (p=0.043). Variables associated with higher PCS scores were LT (p=0.05), current employment (p=0.010), and male sex (p=0.025). Figure 2 shows mean scores on the different SF-36 domains for LT patients and liver cirrhosis patients.
Figure 2.
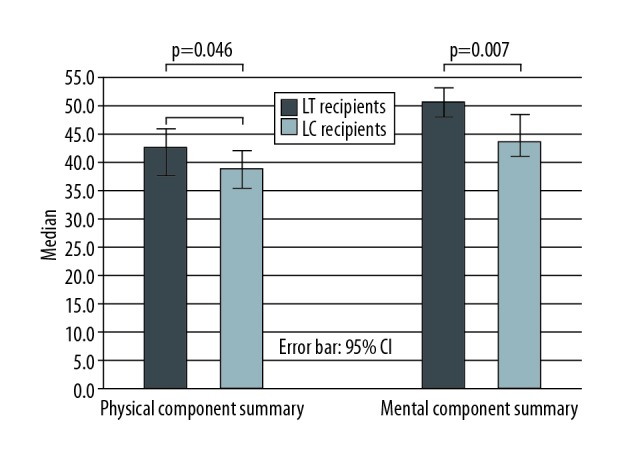
Bar chart showing median physical component summary and mental component summary scores in liver transplant recipients and patients with liver cirrhosis. CI – confidence interval; LC – liver cirrhosis; LT – liver transplantation.
Analysis of the 3 iPRISM groups
The mean MCS score in group 1 was significantly higher than in group 2 (49.4±9.3 vs. 41.8±8.8; p<0.001) and group 3 (49.4±9.3 vs. 38.4±11.8; p<0.001), but the difference in MCS scores between group 2 and group 3 was not significant (41.8±8.8 vs. 38.4±11.8; p=0.194). The mean PCS score in group 1 was significantly higher than in group 2 (42.2±11.0 vs. 37.9±9.8; p=0.01) and there was a significant difference in PCS scores between group 2 and group 3 (37.9±9.8 vs. 31.0±7.5; p=0.005). The box plots in Figure 3 show the distributions of MCS and PCS scores for the 3 iPRISM groups.
Figure 3.

Box plots of distributions of the 3 PRISM groups showing significantly higher MCS (A) and PCS (B) scores in patients who placed the red illness circle completely outside the yellow self-circle. Boxes represent the interquartile range; whiskers indicate the minimum and maximum values but are not longer than twice the length of the corresponding box. MCS – mental component summary; PCS – physical component summary; PRISM – pictorial representation of illness and self measure.
Discussion
The strengths of the PRISM method have already been discussed in detail elsewhere [2]. In summary, the method is easy to use, quickly understood, and provides immediate results. In contrast to questionnaires, the PRISM questions are less likely to elicit socially desirable responses or other types of biased responses (e.g., responses that the patient thinks are preferred or expected by the doctor). However, the PRISM task should be clearly explained to each patient.
Chronically ill individuals often find it difficult to define the severity of their disease [15]. This may result in treating physicians underestimating the level of these patients’ suffering, particularly as the clinical judgment of illness severity does not necessarily correlate with the level of patient suffering [16]. Several previous studies have confirmed that illness-related suffering is not only the result of objective illness severity (as measured by disease-related aspects), but can directly be influenced by ethnic, religious, spiritual, and cultural factors. Our results suggest this, as neither the Model of End-Stage Liver Disease (MELD) score nor the Child-Pugh score of cirrhosis severity correlated with the burden of suffering (as measured by the iPRISM) or with health-related quality of life (as measured by the SF-36) in our patients. These findings highlight the importance of implementing straightforward surveys to identify patients with a high burden of suffering that could lead to mental disorders such as depression [17–19].
In the present study, the burden of suffering as measured by the iPRISM showed a significant influence on both PCS and MCS scores. Greater SIS was associated with greater health-related quality of life in both LT recipients and patients with liver cirrhosis. In other words, a lower level of suffering results in greater health-related quality of life in these individuals. These findings demonstrate that SIS is a good indicator of illness perception in both LT recipients and patients with advanced chronic liver disease. Furthermore, patients were subdivided into 3 groups according to the severity of illness burden. This classification of patients into subgroups according to their SIS as described above helps to easily and immediately categorize patients’ grade of suffering into one of 3 levels: minimal to mild, moderate, and severe. This categorization is a sensitive psychometric instrument to sensitively assess burden of suffering and to subsequently predict patients’ psychopathological risk. MCS scores were significantly higher in patients showing minimal grade of suffering, thus having a greater self-illness separation (group 1; SIS >6 cm) than in those showing less self-illness separation (groups 2 and 3, who placed the red illness circle partially or completely into the yellow self-circle and who subsequently had a SIS <6cm), reflecting a considerably greater, moderate to severe burden of suffering, and lower health-related quality of life in these patients. The mean MCS score (49.4) for group 1 was comparable with that of the normal German population. There was no significant difference in MCS scores between groups 2 and 3. These results are consistent with those of previous studies, which found that placement of the red illness circle in the yellow self-circle reflected a substantial level of suffering [9,12,20]. As MCS scores reflect mental state, patients who place their illness circle within the self-circle during a PRISM task may be at a higher risk of developing psychological distress and depressive disorders and therefore should be evaluated for additional psychological care. Additionally, the same applies to physical-related quality of life as reflected by the PCS. Reduced PCS was associated with a higher burden of suffering. In this regard, we found significant differences in PCS scores among the 3 groups.
The only variable with a significant influence on suffering was LT. SIS in LT recipients was nearly twice as great as in patients with liver cirrhosis. This suggests that LT substantially reduces the burden of suffering in patients with advanced liver disease. In accord with this finding, LT was a significant indicator of greater health-related quality of life in our patient cohort. Furthermore, the MCS scores of LT recipients were within the mean for the normal German population. This may be because following LT, the anxiety caused by liver disease is substantially reduced [21]. Physical-related quality of life was also significantly higher in LT recipients than in patients with liver cirrhosis, but lower than that of the general German population. This may be a result of side effects of immunosuppression, such as osteoporosis and fatigue, and delayed physical recovery after LT [21,22].
In our study only 39.3% of patients were female. This may due to the fact that most of the causes of liver damage leading to LT, such as alcoholism and viral hepatitis, are more common in men than in women [23]. Moreover, former studies showed that liver diseases often arise earlier in men. This may be explained by the protective properties of estrogen against liver fibrosis [24,25]. This is also congruent with our results of a similar sex distribution in both groups (LT recipients and patients with liver cirrhosis). Data regarding sex-associated health-related quality of life are controversial [26–28]. Some of these data indicate lower physical associated scores in females. Finally, our data suggest no influence of sex on the burden of suffering. However, male subjects showed significantly higher PCS scores than females. In addition to LT, current employment was associated with greater health-related quality of life, indicated by higher MCS and PCS scores. This finding confirms previous results suggesting that employability is a relevant surrogate marker of health-related quality of life in patients after LT [22,29].
Conclusions
The findings of our study are limited due to its cross-sectional study design. To better verify our convincing results, especially concerning the impact of LT on burden of suffering and on health-related quality of life, a longitudinal study design with a follow-up of each patient before and after LT may provide more reliable information about the effect of LT in each patient.
However, our study demonstrates that the burden of suffering in both LT recipients and liver cirrhosis patients can adversely affect health-related quality of life. iPRISM is a simple and expeditious visual tool that can objectively measure patient suffering. Based on the results of iPRISM, patients’ suffering can easily and immediately be subdivided into one of 3 severity grades. This can help to identify patients with a high level of suffering who may show a higher risk of psychological disorders, such as depression, and therefore may need psychological care. IPRISM can easily be implemented in daily routine. Additionally, the present findings suggest that iPRISM should be used as an additional outcome measure in future clinical trials, as this tool clearly reflects patients’ level of suffering.
Acknowledgment
We thank Diane Williams, PhD, from Edanz Group (www.edanzediting.com/ac) for editing a draft of this manuscript.
Footnotes
Source of support: Departmental sources
Conflict of Interest
None.
References
- 1.Muhleisen B, Buchi S, Schmidhauser S, et al. Pictorial Representation of Illness and Self Measure (PRISM): A novel visual instrument to measure quality of life in dermatological inpatients. Arch Dermatol. 2009;145(7):774–80. doi: 10.1001/archdermatol.2009.121. [DOI] [PubMed] [Google Scholar]
- 2.Sensky T, Buchi S. PRISM, a novel visual metaphor measuring personally salient appraisals, attitudes and decision-making: Qualitative evidence synthesis. PLoS One. 2016;11(5):e0156284. doi: 10.1371/journal.pone.0156284. [DOI] [PMC free article] [PubMed] [Google Scholar]
- 3.Megari K. Quality of life in chronic disease patients. Health Psychol Res. 2013;1(3):e27. doi: 10.4081/hpr.2013.e27. [DOI] [PMC free article] [PubMed] [Google Scholar]
- 4.Orr JG, Homer T, Ternent L, et al. Health related quality of life in people with advanced chronic liver disease. J Hepatol. 2014;61(5):1158–65. doi: 10.1016/j.jhep.2014.06.034. [DOI] [PubMed] [Google Scholar]
- 5.Ware JE, Jr, Gandek B. Overview of the SF-36 Health Survey and the International Quality of Life Assessment (IQOLA) project. J Clin Epidemiol. 1998;51(11):903–12. doi: 10.1016/s0895-4356(98)00081-x. [DOI] [PubMed] [Google Scholar]
- 6.Ware JE, Jr, Kosinski M, Gandek B, et al. The factor structure of the SF-36 Health Survey in 10 countries: Results from the IQOLA Project. International Quality of Life Assessment. J Clin Epidemiol. 1998;51(11):1159–65. doi: 10.1016/s0895-4356(98)00107-3. [DOI] [PubMed] [Google Scholar]
- 7.Tondury B, Muehleisen B, Ballmer-Weber BK, et al. The Pictorial Representation of Illness and Self Measure (PRISM) instrument reveals a high burden of suffering in patients with chronic urticaria. J Investig Allergol Clin Immunol. 2011;21(2):93–100. [PubMed] [Google Scholar]
- 8.Klis S, Vingerhoets AJ, de Wit M, et al. Pictorial Representation of Illness and Self Measure Revised II (PRISM-RII): A novel method to assess perceived burden of illness in diabetes patients. Health Qual Life Outcomes. 2008;6:104. doi: 10.1186/1477-7525-6-104. [DOI] [PMC free article] [PubMed] [Google Scholar]
- 9.Peter N, Kleinjung T, Horat L, et al. Validation of PRISM (Pictorial Representation of Illness and Self Measure) as a novel visual assessment tool for the burden of suffering in tinnitus patients. Health Qual Life Outcomes. 2016;14:47. doi: 10.1186/s12955-016-0454-2. [DOI] [PMC free article] [PubMed] [Google Scholar]
- 10.Gielissen MF, Prins JB, Knoop H, et al. Pictorial Representation of Self and Illness Measure (PRISM): A graphic instrument to assess suffering in fatigued cancer survivors. Psychol Assess. 2013;25(2):658–63. doi: 10.1037/a0031526. [DOI] [PubMed] [Google Scholar]
- 11.Fotiou K, Hofmann M, Kaufmann R, Thaci D. Pictorial representation of illness and self measure (PRISM): An effective tool to assess the burden of psoriasis. J Eur Acad Dermatol Venereol. 2015;29(12):2356–62. doi: 10.1111/jdv.13232. [DOI] [PubMed] [Google Scholar]
- 12.Streffer ML, Buchi S, Morgeli H, et al. PRISM (pictorial representation of illness and self measure): A novel visual instrument to assess pain and suffering in orofacial pain patients. J Orofac Pain. 2009;23(2):140–46. [PubMed] [Google Scholar]
- 13.Kurth BM, Ellert U. The SF-36 questionnaire and its usefulness in population studies: Results of the German Health Interview and Examination Survey 1998. Soz Praventivmed. 2002;47(4):266–77. doi: 10.1007/BF01326408. [DOI] [PubMed] [Google Scholar]
- 14.Bjorner JB, Lyng Wolden M, Gundgaard J, Miller KA. Benchmarks for interpretation of score differences on the SF-36 health survey for patients with diabetes. Value Health. 2013;16(6):993–1000. doi: 10.1016/j.jval.2013.06.022. [DOI] [PubMed] [Google Scholar]
- 15.Scharloo M, Kaptein AA, Weinman J, et al. Illness perceptions, coping and functioning in patients with rheumatoid arthritis, chronic obstructive pulmonary disease and psoriasis. J Psychosom Res. 1998;44(5):573–85. doi: 10.1016/s0022-3999(97)00254-7. [DOI] [PubMed] [Google Scholar]
- 16.Buchi S, Sensky T, Sharpe L, Timberlake N. Graphic representation of illness: A novel method of measuring patients’ perceptions of the impact of illness. Psychother Psychosom. 1998;67(4–5):222–25. doi: 10.1159/000012284. [DOI] [PubMed] [Google Scholar]
- 17.Sensky T, Catalan J. Asking patients about their treatment. BMJ. 1992;305(6862):1109–10. doi: 10.1136/bmj.305.6862.1109. [DOI] [PMC free article] [PubMed] [Google Scholar]
- 18.Peacock S, Patel S. Cultural Influences on Pain. Rev Pain. 2008;1(2):6–9. doi: 10.1177/204946370800100203. [DOI] [PMC free article] [PubMed] [Google Scholar]
- 19.Puchalski CM. The role of spirituality in health care. Proc (Bayl Univ Med Cent) 2001;14(4):352–57. doi: 10.1080/08998280.2001.11927788. [DOI] [PMC free article] [PubMed] [Google Scholar]
- 20.Buchi S, Morgeli H, Schnyder U, et al. Grief and post-traumatic growth in parents 2–6 years after the death of their extremely premature baby. Psychother Psychosom. 2007;76(2):106–14. doi: 10.1159/000097969. [DOI] [PubMed] [Google Scholar]
- 21.Tome S, Wells JT, Said A, Lucey MR. Quality of life after liver transplantation. A systematic review. J Hepatol. 2008;48(4):567–77. doi: 10.1016/j.jhep.2007.12.013. [DOI] [PubMed] [Google Scholar]
- 22.Bownik H, Saab S. Health-related quality of life after liver transplantation for adult recipients. Liver Transpl. 2009;15(Suppl 2):S42–49. doi: 10.1002/lt.21911. [DOI] [PubMed] [Google Scholar]
- 23.Denniston MM, Jiles RB, Drobeniuc J, et al. Chronic hepatitis C virus infection in the United States, National Health and Nutrition Examination Survey 2003 to 2010. Ann Intern Med. 2014;160(5):293–300. doi: 10.7326/M13-1133. [DOI] [PMC free article] [PubMed] [Google Scholar]
- 24.Oloruntoba OO, Moylan CA. Gender-based disparities in access to and outcomes of liver transplantation. World J Hepatol. 2015;7(3):460–67. doi: 10.4254/wjh.v7.i3.460. [DOI] [PMC free article] [PubMed] [Google Scholar]
- 25.Rodríguez-Castro KI, De Martin E, Gambato M, et al. Female gender in the setting of liver transplantation. World J Transplant. 2014;4(4):229–42. doi: 10.5500/wjt.v4.i4.229. [DOI] [PMC free article] [PubMed] [Google Scholar]
- 26.Liu H, Feurer ID, Dwyer K, et al. The effects of gender and age on health related quality of life following kidney transplantation. Wiley Online Library; 2008. pp. 82–89. [DOI] [PubMed] [Google Scholar]
- 27.Chen P-X, Yan L-N, Wang W-T. Health-related quality of life of 256 recipients after liver transplantation. World J Gastroenterol. 2012;18(36):5114–21. doi: 10.3748/wjg.v18.i36.5114. [DOI] [PMC free article] [PubMed] [Google Scholar]
- 28.Rugari SM. Longitudinal quality of life in liver transplant recipients. Gastroenterol Nurs. 2010;33(3):219–30. doi: 10.1097/SGA.0b013e3181e37985. [DOI] [PubMed] [Google Scholar]
- 29.Saab S, Ibrahim AB, Shpaner A, et al. MELD fails to measure quality of life in liver transplant candidates. Liver Transpl. 2005;11(2):218–23. doi: 10.1002/lt.20345. [DOI] [PubMed] [Google Scholar]