Abstract
Background
Kidney transplantation is the treatment of choice for end stage kidney disease, but acute rejection remains a limiting factor in optimizing allograft and patient survival. Needle biopsy is the current standard of care for this diagnosis. The potential for complications with repeat biopsies limits the ability to obtain temporal immune surveillance of the allograft. The neutrophil-to-lymphocyte ratio (NLR) and platelet-to-lymphocyte ratio (PLR) have been shown to be strong predictors of inflammation and of worse prognosis in a variety of conditions.
Material/Methods
This is a single center retrospective case control study which included all patients who underwent a “for -cause biopsy” of a transplanted kidney. NLR and PLR were calculated 1 month prior, at the time, and 6 months and 1 year after the biopsy.
Results
A total of 159 biopsies were reviewed; 127 (79.9%) of these satisfied all inclusion and exclusion criteria, and 63.0% of the sample cohort (n=80) demonstrated acute cellular rejection (ACR). Patients without evidence of ACR had an average NLR of 26.8, which was approximately 7-fold greater than those patients with findings of ACR (P<0.01). A similar trend was found for PLR, where patients without ACR had a 5.5-fold greater PLR compared to those with rejection (P<0.01). The ROC showed AUC of 0.715 and 0.716 respectively. The NLR cutoff of 9.5 had a positive predictive value (PPV) of 80% and a negative predictive value (NPV) of 77.8%; the PLR cutoff of 380 had a PPV of 75% and a NPV of 100%.
Conclusions
This study showed that NLR and PLR are easily obtainable and reproducible predictors of ACR in the kidney allograft. Serial monitoring of these ratios will help identify subclinical inflammation before evidence of allograft dysfunction.
MeSH Keywords: Biopsy, Blood Platelets, Graft Rejection, Kidney Transplantation
Background
Kidney transplantation is the treatment of choice for end stage kidney disease, but acute rejection remains a limiting factor in optimizing allograft and patient survival [1–4]. Needle biopsy is the current standard of care for diagnosis of acute rejection. Despite their role in the diagnostic algorithm, biopsies are subject to numerous complications such as bleeding, infection, and allograft loss; as well as limitations like sampling errors and inter-observer variability in biopsy interpretation [5]. The potential for complications with repeat biopsies limits the ability to obtain temporal immune surveillance of the allograft and reduces it to a rather “snapshot” assessments by a single biopsy.
Non-invasive diagnosis of acute rejection offers the advantage of obtaining in vivo data on intra-graft immune events temporally, thereby allowing detection of subclinical rejection events and minimization of allograft damage. Non-invasive tests include descriptive cytological analysis, imaging modalities, and novel urine and serum biomarkers [6–9]. An immune assay based on non-invasive urinary testing is especially appealing because it provides a representative sample of the entire allograft. This is currently limited by a lack of commercially available tests (based on the aforementioned principle) that can be used at bedside. Other modalities, like flow cytometry, that can be used to analyze early T cell activation markers, and real-time polymerase chain reaction (RT-PCR) assays to measure mRNA for cytotoxic effector molecule expression in peripheral blood mononuclear cells (PBMCs), have shown promising results, but are also limited by availability [4,9].
The neutrophil-to-lymphocyte ratio (NLR) and platelet-to-lymphocyte ratio (PLR) have been shown to be strong predictors of inflammation and of worse prognosis in a variety of conditions that include end stage kidney disease [9], cancer [10], coronary artery disease, congestive heart failure, and atrial fibrillation [9,11,12]. These ratios have also been correlated with poorer outcomes in acute coronary syndrome and coronary artery bypass graft surgery [13–16]. Given the inflammatory nature of the rejection process, we hypothesized that NLR and PLR may be altered by the rejection process and therefore may serve as common, inexpensive, non-invasive screening tests for acute cellular rejection (ACR).
Material and Methods
Data collection
This was a single center retrospective case control study that included all patients who underwent a “for-cause” biopsy of a transplanted kidney at Albert Einstein Medical Center Philadelphia between January 1, 2012 and December 31, 2014; as identified from the institution’s renal pathology database. Patients were excluded if they met any of the following criteria: antibody mediated rejection, active malignancy, acute coronary syndrome, cerebrovascular event or thrombosis within 4 weeks of the biopsy, primary bone marrow disorder or hematologic malignancy, active infection, systemic inflammatory response syndrome or sepsis and septic shock within 24 hours of biopsy, active chronic inflammation due to untreated chronic infections, active autoimmune disease (e.g., lupus, rheumatoid arthritis, inflammatory bowel disease), thrombocytopenia (platelets less than 50 000), thrombocytosis (platelets greater than 500 000), and recent administration of high dose steroids. If the patient received multiple biopsies during the study period, only the first biopsy was included in the study. The absolute white blood cell count, the absolute platelet count, the percentage of neutrophils and percentage of lymphocytes was extracted from complete blood counts (CBC) taken: immediately prior to biopsy, 2 weeks prior to biopsy, 4 weeks prior to biopsy, and 8 weeks prior to biopsy. The NLR was calculated by dividing the percentage of neutrophils by the percentage of lymphocytes; the PLR was calculated by dividing the absolute platelet count by calculated lymphocyte count (obtained by multiplying the absolute white blood cell count by the percentage of lymphocytes).
Additional demographic and clinical information obtained included: age, gender, body mass index (BMI), race, medical comorbidities, number of transplants, donor type (live or cadaveric), standard or extended criteria donor, induction regimen, cold and warm ischemic time, the presence and severity of cellular and antibody mediated rejection, degree of fibrosis, cytomegalovirus serology, BK virus serology, e(GFR) at 1 month prior to biopsy, at the time of biopsy, 6 months and 1 year after the biopsy, and hemodialysis requirement at 6 months and 1 year after the biopsy. The study protocol was approved by the Albert Einstein Medical Center Philadelphia Institutional Review Board.
Statistical analysis
Normally distributed continuous variables were summarized using mean and standard deviation and compared using a Students’ t-test or analysis of variance (ANOVA) with Bonferroni post-hoc test. Categorical variables were summarized as percentages and compared using a chi-squared test or Fischer’s exact test. All statistical calculations were performed using GraphPad Prism and Stata 13.0 (StataCorp, College Station, TX, USA).
Results
A total of 159 biopsies were performed on transplanted kidneys during the study period and 127 (79.9%) of these satisfied all inclusion and exclusion criteria, and 63.0% of the sample cohort (n=80) demonstrated ACR on pathology. These patients did not significantly differ from patients without ACR with respect to age, gender, race, BMI, comorbidities, or transplantation metrics (Table 1).
Table 1.
Demographic and baseline characteristics of study population as well as biopsy results.
| Total N=127 |
Acute rejection N=80 |
No rejection N=47 |
||
|---|---|---|---|---|
| Age (years) | 54.8±12.4 | 54.32±13.17 | 56±11 | |
| Male | 62% (79) | 60% (48) | 66% (31) | |
| Race | African-American | 66% (84) | 68% (54) | 66% (31) |
| Caucasian | 20% (26) | 24% (19) | 15% (7) | |
| Hispanic | 9% (11) | 6% (5) | 13% (6) | |
| Asian | 5% (6) | 3% (2) | 9% (4) | |
| BMI | 28.9±6.81 | 29.39±6.65 | 28±7.1 | |
| Comorbid conditions | Hypertension | 96% (122) | 98% (78) | 94% (44) |
| Diabetes mellitus | 40% (51) | 39% (31) | 43% (20) | |
| Cerebrovascular disease | 6% (8) | 3% (2) | 13% (6) | |
| Coronary artery disease | 8% (10) | 9% (7) | 6% (3) | |
| Hyperlipidemia | 21% (27) | 24% (19) | 17% (8) | |
| Peripheral vascular disease | 6% (7) | 5% (4) | 6% (3) | |
| Hepatitis B | 2% (3) | 4% (3) | 0 | |
| Hepatitis C | 11% (14) | 10% (8) | 13% (6) | |
| Thromboembolic disease | 7% (9) | 9% (7) | 4% (2) | |
| Congestive heart failure | 6% (8) | 8% (6) | 4% (2) | |
| Obesity | 41% (52) | 43% (34) | 38% (18) | |
| Number of transplants | 1.25±0.56 | 1.27±0.57 | 1.22±0.55 | |
| Cadaveric donor | 87% (110) | 81% (65) | 96% (45) | |
| Standard criteria donor | 91% (115) | 86% (69) | 98% (46) | |
| Induction therapy | Anti-Thymocyte Globulin | 77% (98) | 71% (57) | 87% (41) |
| Solumedrol | 2% (3) | 4% (3) | 0 | |
| Basiliximab | 2% (3) | 3% (2) | 2% (1) | |
| Not documented | 18% (23) | 23% (18) | 11% (5) | |
| Steroid status | Yes | 98% (124) | 98% (78) | 98% (46) |
| No | 1% (1) | 1% (1) | 0 | |
| Not documented | 1% (2) | 1% (1) | 2% (1) | |
| Cold ischemic time (min) | 731.59±323.86 | 725.71±350.07 | 740.85±281.69 | |
| Warm ischemic time (min) | 28.99±7.46 | 29.27±6.63 | 28.54±8.71 | |
| Delayed graft function | 43% (54) | 46% (37) | 36% (17) | |
| Acute cellular rejection | Banff 1A | 12% (15) | 19% (15) | 0 |
| Banff 1B | 17% (21) | 26% (21) | 0 | |
| Banff 2A | 9% (12) | 15% (12) | 0 | |
| Banff 2B | 0 | 0 | 0 | |
| Banff 3 | 1% (1) | 1% (1) | 0 | |
| C4d positive | 31% (40) | 50% (40) | 0 | |
| Fibrosis | None | 20% (26) | 11% (9) | 32% (15) |
| Mild | 39% (50) | 41% (33) | 36% (17) | |
| Moderate | 29% (37) | 36% (29) | 17% (8) | |
| Severe | 11% (14) | 9% (7) | 15% (7) | |
| Borderline rejection | 17% (22) | 28% (22) | 0 | |
| Chronic rejection | 4% (5) | 6% (5) | 0 | |
| BK virus | 5% (6) | 2% (3) | 6% (3) | |
| CMV PCR positive | 1% (2) | 1% (1) | 2% (1) | |
| Pathologic diagnosis | Acute cellular rejection | 17% (21) | 26% (21) | 0 |
| Acute antibody mediated rejection | 7% (9) | 11% (9) | 0 | |
| Acute cellular and antibody mediated rejection | 19% (24) | 30% (24) | 0 | |
| Acute tubular necrosis | 23% (29) | 0 | 62% (29) | |
| Calcineurin inhibitor toxicity | 6% (7) | 0 | 15% (7) | |
| BK virus nephropathy | 1% (2) | 0 | 4% (2) | |
| Kidney function | Creatinine (mg/dL) 1 month prior to biopsy | 3.55±3.88 | 3.31±4.32 | 3.93±3.14 |
| GFR 1 month prior to biopsy | 34.26±21.31 | 34.49±21.69 | 33.92±21.18 | |
| Creatinine (mg/dL) at biopsy | 3.78±2.98 | 3.81±3.29 | 3.72±2.38 | |
| GFR at biopsy | 27.83±15.80 | 28.39±16.19 | 26.81±15.20 | |
| Creatinine (mg/dL) 6 months after biopsy | 3.24±2.68 | 3.58±2.77 | 2.67±2.45 | |
| GFR 6 months after biopsy | 35.41±20.87 | 32.09±19.97 | 41.24±21.53 | |
| Creatinine (mg/dL) 1 year after biopsy | 3.19±2.89 | 3.38±3.16 | 2.82±2.30 | |
| GFR 1 Year after biopsy | 35.96±22.05 | 35.38±22.77 | 37.12±21.18 | |
| Return to hemodialysis | 6-months post biopsy | 20% (25) | 12% (15) | 21% (10) |
| 1-year post biopsy | 20% (25) | 12% (15) | 21% (10) | |
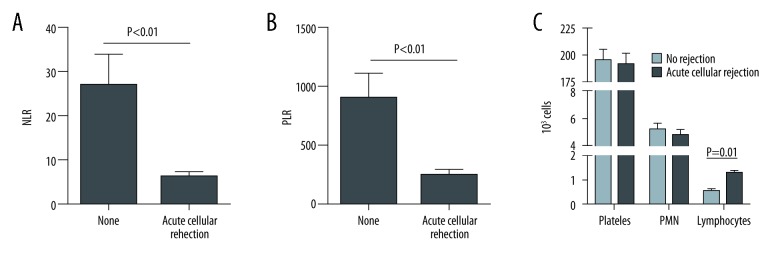
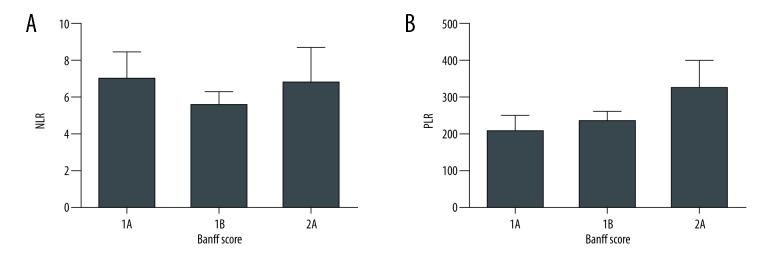
Patients without any biopsy evidence of ACR had an average NLR of 26.8. This was approximately 7-fold greater than those patients with findings of acute rejection on biopsy (P<0.01, Figure 1A). A similar trend was found with regards to the PLR, where patients without acute rejection had a 5.5-fold greater PLR compared to those with rejection (P<0.01, Figure 1B). This difference in both the NLR and PLR was due to increased numbers of lymphocytes in peripheral blood in patients with ACR (Figure 1C). There was no statistically significant correlation between either NLR or PLR with Banff grade (Figure 2A, 2B).
Figure 1.
(A) NLR in patients without and with ACR; (B) PLR in patients without and with ACR; (C) Difference in NLR and PLR was due to increased numbers of lymphocytes in peripheral blood in patients with ACR. NLR – neutrophil-to-lymphocyte ratio; ACR – acute cellular rejection; PLR – platelet-to-lymphocyte ratio.
Figure 2.
(A, B) Correlation between NLR and PLR with Banff grade. NLR – neutrophil-to-lymphocyte ratio; PLR – platelet-to-lymphocyte ratio.
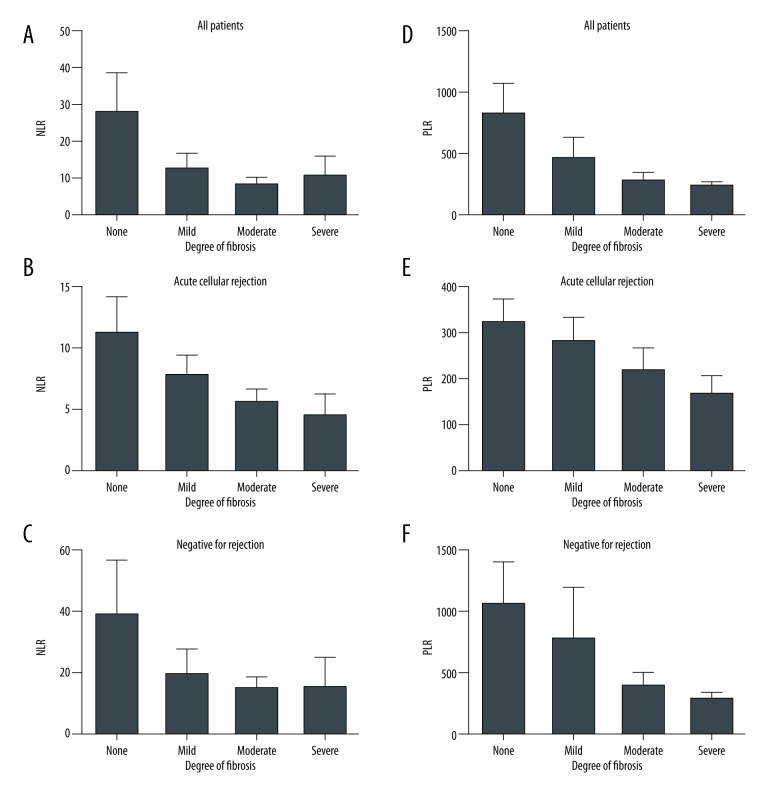
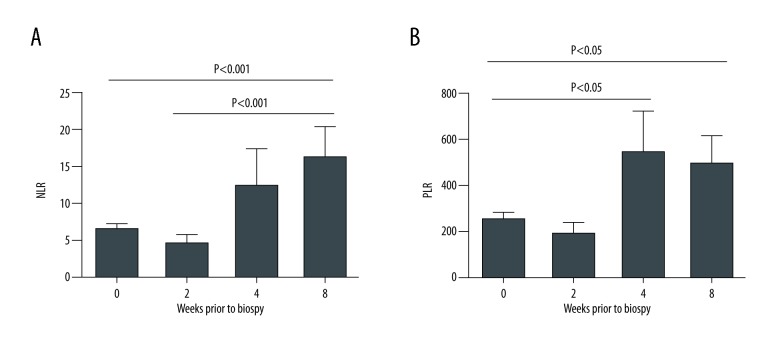
For all biopsies, NLR was suppressed in patients that showed any degree of fibrosis (Figure 3A). The negative correlation between degree of fibrosis and NLR was not statistically significant, but most obvious in patients who were found to have ACR (Figure 3B). A similar trend was noted between PLR and degree of fibrosis (Figures 3D–3F). Interestingly, patients with ACR had NLRs and PLRs similar to those without rejection at 4 to 8 weeks prior to biopsy (Figure 4A). Within 2 to 4 weeks of the biopsy, NLRs and PLRs became significantly depressed, consistent with the rejection process (P<0.01, Figure 4A, P<0.05, Figure 4B).
Figure 3.
(A–F) NLR and PLR correlation with degree of fibrosis in all patients, patients with ACR and no signs of rejection in biopsy. NLR – neutrophil-to-lymphocyte ratio; PLR – platelet-to-lymphocyte ratio; ACR – acute cellular rejection.
Figure 4.
NLRs and PLRs at 0, 2, 4, and 8 weeks prior to biopsy. NLR – neutrophil-to-lymphocyte ratio; PLR – platelet-to-lymphocyte ratio.
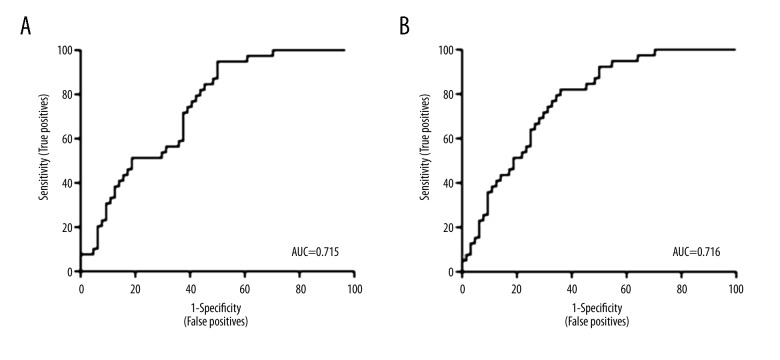
Receiver operating characteristic (ROC) curves using NLR and PLR at the time of biopsy demonstrated moderate predictive power with an area under the curve (AUC) of 0.715 and 0.716 respectively (Figure 5). NLR had an optimal cutoff of 9.5 and PLR had an optimal cutoff of 380. These cutoffs were then applied to a validation set of approximately 51 biopsies, of which 28 were transplanted kidneys. The NLR cutoff of 9.5 had a positive predictive value (PPV) of 80% and a negative predictive value (NPV) of 77.8%; the PLR cutoff of 380 had a PPV of 75% and a NPV of 100%.
Figure 5.
ROC curves using NLR and PLR at the time of biopsy. ROC – receiver operating characteristic; NLR – neutrophil-to-lymphocyte ratio; PLR – platelet-to-lymphocyte ratio.
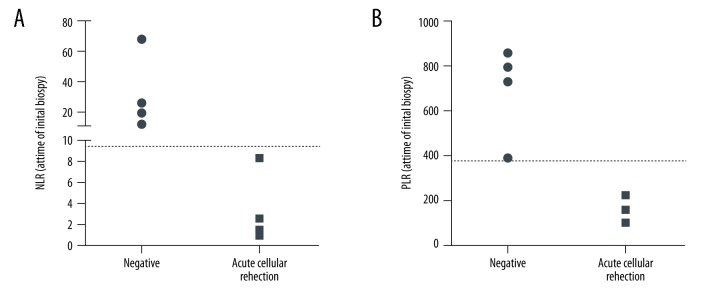
Given the predictive power of NLR and PLR, we sought to investigate whether these ratios would be able to predict future ACR in the setting of a borderline biopsy. Eight patients had a borderline biopsy followed by a repeat biopsy within 3 to 6 months. NLR and PLR drawn at the time of the initial borderline biopsy correctly identified the subset of patients who would have ACR on the following biopsy (Figure 6).
Figure 6.
NLR and PLR drawn at the time of the initial borderline biopsy. NLR – neutrophil-to-lymphocyte ratio; PLR – platelet-to-lymphocyte ratio.
Discussion
While kidney biopsies have become safer over the years, it remains an invasive procedure that can be associated with morbidity, including graft loss [5,17]. This study evaluated the NLR and PLR as simple, reproducible, and readily available non-invasive biomarkers of ACR in the renal allograft. The ubiquitous availability of a CBC with differential, and the ability to have it drawn at multiple time points in the clinical course, makes these markers appealing as part of the non-invasive immune monitoring armamentarium.
In our retrospective cohort, patients with ACR had a significant decrease in both NLR and PLR indices, as far as 2 to 4 weeks preceding clinical allograft dysfunction. While there was no correlation with the severity of acute rejection as measured by the Banff grade, there was a negative correlation between NLR and PLR with the amount of fibrosis identified on biopsy. Cutoffs established using ROC curves performed well in a validation cohort, and accurately predicted future ACR when applied to biopsies with borderline rejection. Taken together, these observations imply that the NLR and PLR are robust predictors of ACR with the ability to display evidence of smoldering inflammation preceding the clinical detection of ACR. Given that these ratios are altered before a “for-cause” biopsy is prompted, it is not surprising that the degree of allograft fibrosis inversely correlates with the degree of suppression of these ratios, thus reflecting the consequences of prolonged inflammation.
NLR and PLR are well established biomarkers of severity of inflammatory diseases ranging from malignancies to heart disease [9–13]. It is hypothesized that NLR and PLR are strong predictors of outcomes because they are both sensitive and robust reflection of the inflammatory milieu. Systemic inflammation is known to cause disruptions in hematologic cell lines, specifically neutrophilia and thrombocytosis, resulting in elevations of NLR and PLR [14]. Interestingly, our study shows the opposite effect. Not only are suppression of NLR and PLR associated with ACR, but the underlying mechanism is from a relative increase in the lymphocyte count, which is expected given the pathogenesis of rejection. While flow cytometric detection of early T cell activation, CD69 expression has yielded mixed results [4,18], quantitative competitive RT-PCR assays measuring mRNA for cytotoxic effector molecule expression by PBMCs in renal transplant recipients have yielded more favorable results [4,17,19,20]. Compared to these techniques, a routinely obtained CBC with differential easily captures the inflammatory signature that precedes detection of allograft dysfunction and allows integration of this information with ongoing allograft and urinary immune biomarkers. It is conceivable that a shift in a previously stable trend in NLR and PLR, can trigger more detailed immune monitoring of the allograft, thereby reducing fibrosis burden from untreated inflammation
This study has limitations. The single center and retrospective nature of the study mandates larger prospective studies to validate these observations. Given the relative paucity of antibody mediated rejection, this subtype was excluded from this study, thereby limiting these observations to ACR only. Lastly, NLR and PLR were not used to distinguish ACR from other causes of inflammation in the allograft such as pyelonephritis and acute interstitial nephritis, which are areas for further study.
Conclusions
NLR and PLR are easily obtainable, inexpensive, non-invasive and reproducible predictors of acute cellular rejection in the kidney allograft. Serial monitoring of these ratios will help identify subclinical inflammation before evidence of allograft dysfunction and also have predictive value in detecting progression from borderline to higher grades of acute cellular rejection.
Abbreviations
- AUC
area under the curve
- NLR
neutrophil-to-lymphocyte ratio
- PLR
platelet-to-lymphocyte ratio
- ROC
receiver operating characteristic
Footnotes
Conflict of interest
None.
Source of support: Departmental sources
References
- 1.Hariharan S, Johnson CP, Bresnahan BA, et al. Improved graft survival after renal transplantation in the United States, 1988 to 1996. N Engl J Med. 2000;342(9):605–12. doi: 10.1056/NEJM200003023420901. [DOI] [PubMed] [Google Scholar]
- 2.Tonelli M, Wiebe N, Knoll G, et al. Systematic review: Kidney transplantation compared with dialysis in clinically relevant outcomes. Am J Transplant. 2011;11(10):2093–109. doi: 10.1111/j.1600-6143.2011.03686.x. [DOI] [PubMed] [Google Scholar]
- 3.Langone AJ, Chuang P. The management of the failed renal allograft: an enigma with potential consequences. Semin Dial. 2005;18(3):185–87. doi: 10.1111/j.1525-139X.2005.18305.x. [DOI] [PubMed] [Google Scholar]
- 4.Karpinski M, Rush D, Jeffery J, et al. Heightened peripheral blood lymphocyte CD69 expression is neither sensitive nor specific as a noninvasive diagnostic test for renal allograft rejection. J Am Soc Nephrol. 2003;14(1):226–33. doi: 10.1097/01.asn.0000039543.97369.4e. [DOI] [PubMed] [Google Scholar]
- 5.Furness PN, Taub N. International variation in the interpretation of renal transplant biopsies: Report of the CERTPAP Project. Kidney Int. 2001;60(5):1998–2012. doi: 10.1046/j.1523-1755.2001.00030.x. [DOI] [PubMed] [Google Scholar]
- 6.Sharma VK, Bologa RM, Li B, et al. Intrarenal display of cytotoxic attack molecules during rejection. Transplant Proc. 1997;29(1–2):1090–91. doi: 10.1016/s0041-1345(96)00418-6. [DOI] [PubMed] [Google Scholar]
- 7.Strom TB, Suthanthiran M. Prospects and applicability of molecular diagnosis of allograft rejection. Semin Nephrol. 2000;20(2):103–7. [PubMed] [Google Scholar]
- 8.Suthanthiran M, Schwartz JE, Ding R, et al. Urinary-cell mRNA profile and acute cellular rejection in kidney allografts. N Engl J Med. 2013;369(1):20–31. doi: 10.1056/NEJMoa1215555. [DOI] [PMC free article] [PubMed] [Google Scholar]
- 9.Vasconcellos LM, Schachter AD, Zheng XX, et al. Cytotoxic lymphocyte gene expression in peripheral blood leukocytes correlates with rejecting renal allografts. Transplantation. 1998;66(5):562–66. doi: 10.1097/00007890-199809150-00002. [DOI] [PubMed] [Google Scholar]
- 10.Guthrie GJ, Charles KA, Roxburgh CS, et al. The systemic inflammation-based neutrophil-lymphocyte ratio: Experience in patients with cancer. Crit Rev Oncol Hematol. 2013;88(1):218–30. doi: 10.1016/j.critrevonc.2013.03.010. [DOI] [PubMed] [Google Scholar]
- 11.Papa A, Emdin M, Passino C, et al. Predictive value of elevated neutrophil-lymphocyte ratio on cardiac mortality in patients with stable coronary artery disease. Clin Chim Acta. 2008;395(1–2):27–31. doi: 10.1016/j.cca.2008.04.019. [DOI] [PubMed] [Google Scholar]
- 12.Tamhane UU, Aneja S, Montgomery D, et al. Association between admission neutrophil to lymphocyte ratio and outcomes in patients with acute coronary syndrome. Am J Cardiol. 2008;102(6):653–57. doi: 10.1016/j.amjcard.2008.05.006. [DOI] [PubMed] [Google Scholar]
- 13.Sunbul M, Gerin F, Durmus E, et al. Neutrophil to lymphocyte and platelet to lymphocyte ratio in patients with dipper versus non-dipper hypertension. Clin Exp Hypertens. 2014;36(4):217–21. doi: 10.3109/10641963.2013.804547. [DOI] [PubMed] [Google Scholar]
- 14.Gabay C, Kushner I. Acute-phase proteins and other systemic responses to inflammation. N Engl J Med. 1999;340(6):448–54. doi: 10.1056/NEJM199902113400607. [DOI] [PubMed] [Google Scholar]
- 15.Shin DH, Kim EJ, Kim SJ, et al. Delta neutrophil index as a marker for differential diagnosis between acute graft pyelonephritis and acute graft rejection. PLoS One. 2015;10(8):e0135819. doi: 10.1371/journal.pone.0135819. [DOI] [PMC free article] [PubMed] [Google Scholar]
- 16.García-Carro C, Dörje C, Åsberg A, et al. Kidney allograft subclinical rejection modulates systemic inflammation measured by C-reactive protein at 1 year after transplantation. Clin Transplant. 2018 doi: 10.1111/ctr.13196. [Epub ahead of print] [DOI] [PubMed] [Google Scholar]
- 17.Nissaisorakarn V, Lee JR, Lubetzky M, et al. Urine biomarkers informative of human kidney allograft rejection and tolerance. Hum Immunol. 2018 doi: 10.1016/j.humimm.2018.01.006. [Epub ahead of print] [DOI] [PubMed] [Google Scholar]
- 18.Posselt AM, Vincenti F, Bedolli M, et al. CD69 expression on peripheral CD8 T cells correlates with acute rejection in renal transplant recipients. Transplantation. 2003;76(1):190–95. doi: 10.1097/01.TP.0000073614.29680.A8. [DOI] [PubMed] [Google Scholar]
- 19.Peng B, Ming Y, Yang C. Regulatory B cells: The cutting edge of immune tolerance in kidney transplantation. Cell Death Dis. 2018;9(2):109. doi: 10.1038/s41419-017-0152-y. [DOI] [PMC free article] [PubMed] [Google Scholar]
- 20.Hasegawa J, Honda K, Omoto K, et al. Clinical and pathological features of plasma cell-rich acute rejection after kidney transplantation. Transplantation. 2018 doi: 10.1097/TP.0000000000002041. [Epub ahead of print] [DOI] [PubMed] [Google Scholar]


