Abstract
Background
BK nephropathy (BKN) affects graft function and increases the risk of graft failure. The reduction of immunosuppression is the main treatment for BKN. However, acute rejection may develop following immunosuppression reduction, and data regarding the risk factors of acute rejection during the post-reduction period are insufficient.
Material/Methods
Of 758 patients who received a kidney transplantation (KT) between 2008 and 2011, 79 who underwent immunosuppression reduction as BKN treatment were enrolled. The risk factors of acute rejection after immunosuppression reduction were identified using multivariate logistic regression analysis.
Results
During the median follow-up period (75 months), acute rejection developed in 21.5% of study group patients and in 22.5% of KT recipients without BKN. The rejection group showed a trend of higher body mass index (24.13±3.92 vs. 22.40±3.31 kg/m2, P=0.070) and lower tacrolimus levels than the no rejection group, although mycophenolate mofetil (MMF) doses were not lower in the rejection group. The rejection group showed worse graft survival than the no rejection group (P=0.001 by the log rank test). A greater number of patients in the rejection group exhibited reduced calcineurin inhibitor (CNI) level by >20% at 1 month after initial BKV detection (34.2% vs. 7.9%, P=0.008). Multivariate analysis indicated that the peak BKV PCR level (odds ratio [OR], 0.136; 95% confidence interval [CI], 0.025–0.732; P=0.020), MMF discontinuation (vs. MMF reduction; OR, 0.112; 95% CI, 0.020–0.618; P=0.012) and CNI level reduction >20% (OR, 33.752; 95% CI, 4.263–267.251; P=0.001) were significantly associated with acute rejection.
Conclusions
Acute rejection after immunosuppression reduction for BKN showed worse allograft survival than the patients without acute rejection. In addition, a CNI dose reduction >20% at 1 month after the initial BKV detection can increase the risk of acute rejection.
MeSH Keywords: BK Virus, Graft Rejection, Kidney Transplantation
Background
The BK polyomavirus was first isolated in 1971 from the urine of a kidney transplant (KT) recipient [1]. Primary infection with the BK virus (BKV) usually occurs in the first decade of life [2,3], after which the BKV establishes latency in the uroepithelium and renal tubular epithelial cells; under conditions of immunosuppression, the virus reactivates and begins to replicate [4]. The reactivation of BKV in the kidney allograft can lead to BK nephropathy in up to 10% of KT recipients [5]. BK nephropathy affects graft function and increases the risk of graft loss [6].
BK nephropathy has limited treatment options; therefore, the screening of KT recipients for BKV replication is highly recommended [6]. The mainstay of therapy for BK nephropathy is the reduction of immunosuppression. However, acute rejection can develop following immunosuppression reduction in these cases, and antirejection treatment such as steroid pulse therapy may induce BK viral activation and result in poor long-term graft function [7].
Several studies have evaluated the efficacy of immunosuppression reduction in BK nephropathy [8–10] and reported on the occurrence of acute rejection following immunosuppression reduction. However, the number of episodes overall was small, and hence, the risk factors of acute rejection and an appropriate strategy of immunosuppression reduction have not been extensively studied. Therefore, in the present study, we evaluated the risk factors of acute rejection in KT recipients after immunosuppression reduction for BK nephropathy, particularly focusing on the immunosuppression strategy in these cases.
Material and Methods
Study design and population
All patients who received KT between 2008 and 2011 at our institution were reviewed. Patients who underwent the transplantation of other organs, patients aged <18 years, and those with follow-up duration <1 year were excluded. In our study population, we identified patients with blood BKV PCR levels ≥4 log10 copies/mL in whom a presumptive diagnosis of BK nephropathy could be made in the absence of pathologic findings [6], as well as patients with blood BKV PCR levels <4 log10 copies/mL. These patients were followed until July 2016. This study was approved by the Institutional Review Board of Asan Medical Center (2017-0367).
Immunosuppression and infection monitoring
Induction therapy using 20 mg of basiliximab on the day of the surgery and on postoperative day 4 was administered in all the patients. In cases with ABO incompatibility or human leukocyte antigen (HLA)-sensitized KT, rituximab was administered 7–10 days before the operation, and several plasmapheresis sessions were administered until the patient’s ABO isoagglutinin titer was decreased to below 1: 8 or until the flow cytometry findings were negative. The maintenance immunosuppressive regimen comprised calcineurin inhibitor (CNI; either tacrolimus or cyclosporine), antimetabolites (either mycophenolate mofetil or azathioprine), and steroids. All patients received oral trimethoprim/sulfamethoxazole (80/400 mg) for 6 months postoperatively for the prophylaxis of pneumocystis pneumonia. The blood BKV PCR level was used for BKV monitoring at 3, 6, 9, and 12 months after KT (Figure 1). If the blood BKV PCR level was ≥4 log10 copies/mL, immunosuppression continued following either the reduction or discontinuation of antimetabolites or reduction of CNI inhibitors according to the physicians’ strategy.
Figure 1.
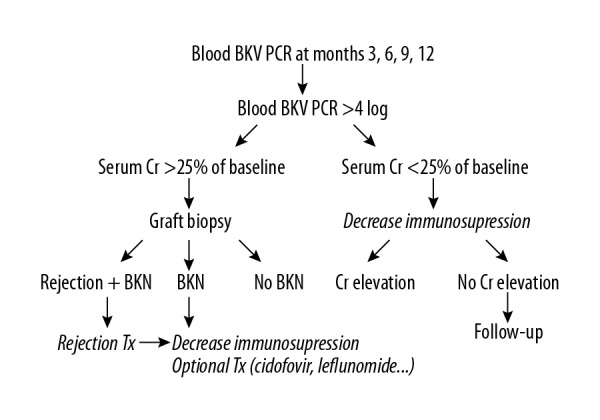
Protocol for BK virus monitoring and management.
Data collection
With regard to baseline characteristics, age, sex, body mass index (BMI), medical history, information about dialysis before transplantation, and KT data were recorded. Moreover, the date and level of the initially detected BKV and peak BKV via PCR were identified. The method of immunosuppression reduction, occurrence of acute rejection, graft survival, and renal function were also assessed. The estimated glomerular filtration rate (eGFR) was calculated using the isotope-dilution mass spectrometry-traceable Modification of Diet in Renal Disease equation as follows: eGFR (mL/min/1.73 m2)=175×serum creatinine−1.154×age−0.203×(0.742 if the patient is female)×(1.212 if the patient is of African descent). Protocol biopsy was not performed. Allograft biopsy was performed when rejection was clinically suspected, and acute rejection was defined as pathologically confirmed-acute rejection in the present study. Renal biopsies were evaluated via light, electron, and immunofluorescence microscopy, and rejection was assessed using the Banff classification. Graft failure was defined as the recommencement of dialysis or the need for a direct second transplantation.
Statistical analysis
SPSS version 21 (IBM Corp., Armonk, NY) was used for statistical analyses. Data were expressed as the mean ± standard deviation or as numbers and percentages. For categorical variables, the chi-squared test and Fisher’s exact test were used. Continuous variables were compared using the t test or Mann-Whitney U test. Graft survival was evaluated with the Kaplan-Meier method using the log rank test. The analysis of risk factors of acute rejection after immunosuppression reduction for BK nephropathy was performed using backward stepwise multivariate logistic regression analysis. All reported P values were 2-sided, and a P value < 0.05 was considered statistically significant.
Results
Study population
A total of 758 patients who received KT between 2008 and 2011 at our hospital were reviewed (Figure 2). Among these patients, 99 exhibited a blood BKV PCR level of ≥4 log10 copies/mL, and immunosuppression reduction was performed in 83 patients for the management of BKV infection. After excluding 4 patients who experienced acute rejection with BK viremia prior to immunosuppression reduction, 79 patients were finally included in the analysis. Seventeen patients developed acute rejection after immunosuppression reduction (rejection group), including 4 patients who experienced acute rejection within 1 year of immunosuppression reduction. The remaining 62 patients did not experience acute rejection despite immunosuppression reduction (no rejection group).
Figure 2.
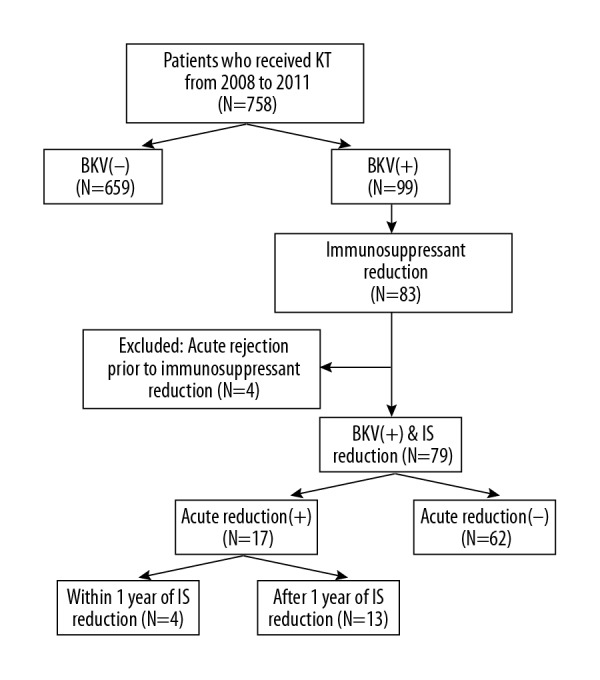
Flow chart of study population. BKV – BK virus; IS – immunosuppression; KT – kidney transplant.
Baseline characteristics
When comparing the rejection and no rejection groups, the rejection group showed a trend of a higher BMI (24.13±3.92 vs. 22.40±3.31 kg/m2; P=0.070; Table 1). However, the other baseline characteristics did not significantly differ. In the rejection group, all the 4 patients who experienced acute rejection within 1 year of immunosuppression reduction had a higher BMI (26.77±4.28 vs. 22.40±3.31 kg/m2; P=0.036) and had female donors. Moreover, a greater proportion of patients underwent HLA-sensitized KT (50.0% vs. 9.7%, P=0.069) in the rejection group. The mean follow-up duration overall was 74.11±16.12 months. The initially detected BKV PCR levels and the peak BKV PCR levels did not significantly differ between the rejection and no rejection groups.
Table 1.
Baseline characteristics of the study population.
| Rejection group (n=17) | Rejection within 1 year of IS reduction (n=4) | No rejection group (n=62) | P-value* | P-value** | |
|---|---|---|---|---|---|
| Gender (male) | 12 (70.6%) | 4 (100%) | 32 (51.6%) | 0.182 | 0.120 |
| Age (years) | 44.12±12.01 | 44.75±12.42 | 45.10±10.85 | 0.748 | 0.887 |
| Body mass index (kg/m2) | 24.13±3.92 | 26.77±4.28 | 22.40±3.31 | 0.070 | 0.036 |
| Medical history | |||||
| Diabetes mellitus | 2 (11.8%) | 0 (0%) | 11 (17.7%) | 0.723 | 1.000 |
| Hypertension | 15 (88.2%) | 4 (100%) | 54 (87.1%) | 1.000 | 1.000 |
| Cardiovascular disease | 1 (5.9%) | 0 (0%) | 4 (6.5%) | 1.000 | 1.000 |
| Hepatitis B virus | 0 (0%) | 0 (0%) | 5 (8.1%) | 0.579 | 1.000 |
| Dialysis (non-preemptive) | 15 (88.2%) | 15 (88.2%) | 55 (88.7%) | 1.000 | 1.000 |
| Hemodialysis | 11 (73.3%) | 3 (75.0%) | 47 (85.5%) | 0.271 | 1.000 |
| Duration (months) | 38.53±44.50 | 11.67±15.95 | 52.29±60.02 | 0.412 | 0.128 |
| Living-donor KT | 14 (82.4%) | 4 (100%) | 42 (67.7%) | 0.367 | 0.306 |
| Delayed graft function | 2 (11.8%) | 0 (0%) | 4 (6.5%) | 0.604 | 1.000 |
| Number of KT | |||||
| ≥2 times | 1 (5.9%) | 0 (0%) | 7 (11.3%) | 1.000 | 1.000 |
| ABO-incompatible KT | 0 (0%) | 0 (0%) | 10 (16.1%) | 0.108 | 1.000 |
| HLA-sensitized KT | 2 (11.8%) | 2 (50.0%) | 6 (9.7%) | 1.000 | 0.069 |
| HLA mismatches | |||||
| ≥4 mismatches | 7 (41.2%) | 3 (75.0%) | 26 (41.9%) | 1.000 | 0.312 |
| PRA ≥10% | 1 (5.9%) | 0 (0%) | 10 (16.1%) | 0.440 | 1.000 |
| Donor gender (male) | 6 (35.3%) | 0 (0%) | 35 (56.5%) | 0.172 | 0.044 |
| Donor age (years) | 41.24±8.63 | 42.25±9.43 | 45.87±11.32 | 0.121 | 0.397 |
| F/U duration (months) | 75.41±18.33 | 71.50±12.40 | 73.76±15.60 | 0.710 | 0.650 |
| First-detected BKV PCR (log copy/ml) | 4.48±1.30 | 4.46±0.32 | 4.53±1.00 | 0.842 | 0.866 |
| Peak BKV PCR (log copy/ml) | 4.96±1.16 | 4.74±0.39 | 5.17±0.90 | 0.427 | 0.491 |
BKV – BK virus; F/U – follow-up; HLA – human leukocyte antigen; IS – immunosuppression; KT – kidney transplantation; PRA – panel reactive antibody.
P-value – rejection group vs. no rejection group;
P-value – rejection group within 1 year vs. no rejection group.
Occurrence of acute rejection
Among the 79 patients with immunosuppression reduction for presumptive BK nephropathy, 17 (21.5%) experienced acute rejection at 31.41±22.25 months (range, 1–74 months; median, 34 months) after immunosuppression reduction. In 4 patients, acute rejection developed within 1 year of immunosuppression reduction. Antibody-mediated rejection was occurred in 2 patients, and type IIA acute T cell-mediated rejection coexisted in one of them. Acute T cell-mediated rejection was diagnosed in 16 patients. The types of acute T cell-mediated rejection were borderline in 5 patients, IA in 1 patient, IB in 5 patients, IIA in 4 patients and III in 1 patient. In 659 KT recipients without BKV nephropathy, 148 (22.5%) experienced acute rejection events during the follow-up period, and 50 developed acute rejection within 1 year of KT.
Renal function and graft survival
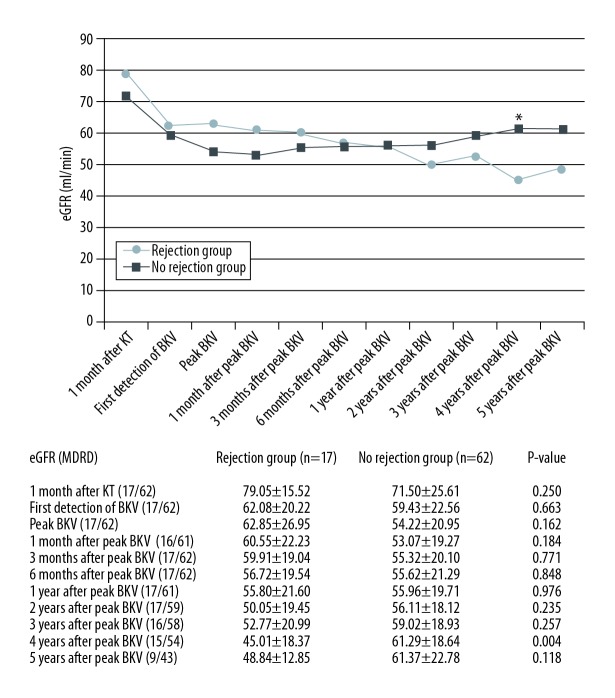
Among the 79 KT recipients with immunosuppression reduction for presumptive BK nephropathy, the eGFR of the rejection group did not significantly differ from that of the no rejection group until 3 years following the peak BKV PCR level. However, the rejection group had lower eGFR at 4 years after the peak BKV PCR level (45.01±18.37 vs. 61.29±18.64 ml/min; P=0.004) (Figure 3). The rejection group showed worse graft survival than the no rejection group (P=0.001 by the log rank test; Figure 4).
Figure 3.
Renal function among the study patients. BKV – BK virus; eGFR – estimated glomerular filtration rate; KT – kidney transplant.
Figure 4.
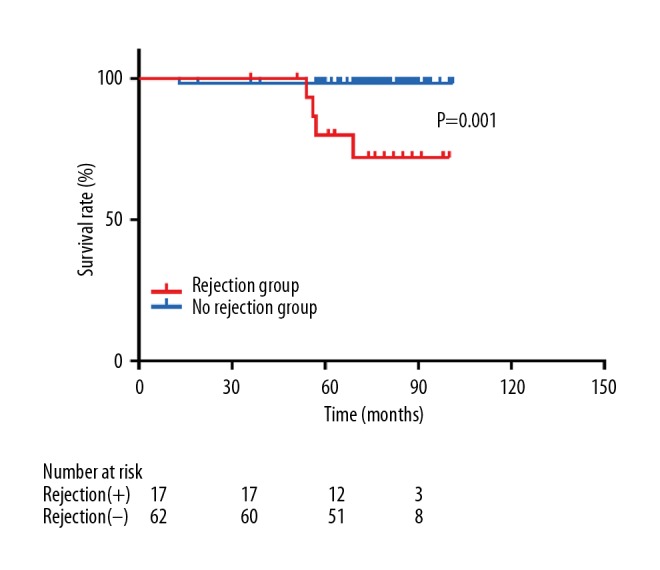
Graft survival in the rejection group and no rejection group with immunosuppressant reduction due to BKV nephropathy.
The level and dose of immunosuppressants
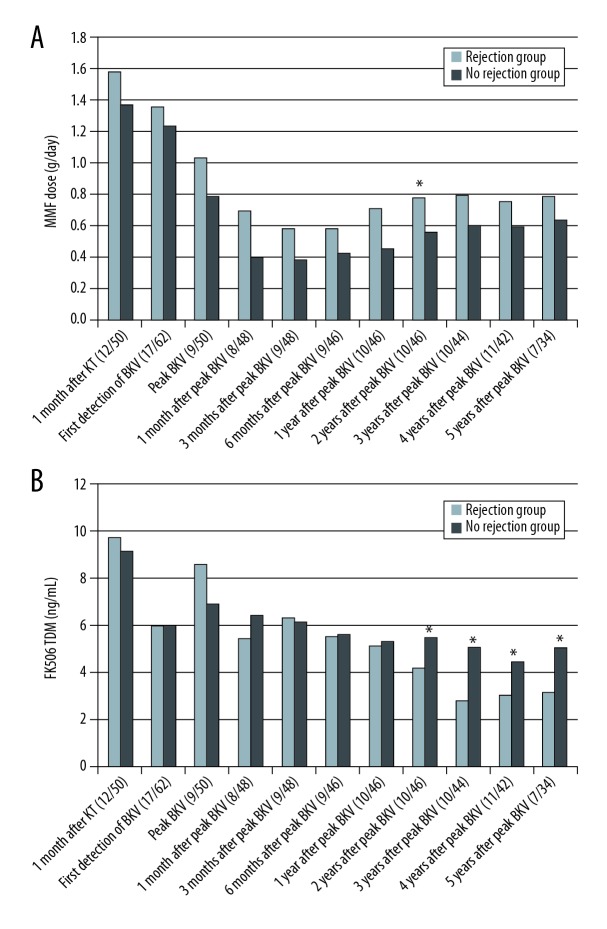
The dose of mycophenolate mofetil (MMF) was not lower in the rejection group than in the no rejection group (Figure 5A). However, the tacrolimus drug levels were lower in the rejection group after 2 years from the peak BKV PCR level (4.21±1.92 vs. 5.48±1.63 ng/ml [P=0.034] at 2 years after the peak BKV level; 2.84±1.19 vs. 5.07±2.09 ng/ml [P=0.034] at 3 years after the peak BKV PCR level; 3.07±1.21 vs. 4.45±1.29 ng/ml [P=0.002] at 4 years after the peak BKV PCR level; 3.16±1.37 vs. 5.04±2.04 ng/ml [P=0.025] at 5 years after the peak BKV PCR level; Figure 5B). The level and dose of immunosuppressants are summarized in Table 2.
Figure 5.
Dose and level of immunosuppressants. (A) Mycophenolate mofetil dose. (B) Tacrolimus levels. BKV – BK virus; KT – kidney transplant; MMF – mycophenolate mofetil.
Table 2.
Drug level and dose of immunosuppressants.
| Rejection group (n=17) | Rejection within 1 year of IS reduction (n=4) | No rejection group (n=62) | P-value* | P-value** | |
|---|---|---|---|---|---|
| FK 506 TDM (ng/mL) (N/N/N) | |||||
| 1 month after KT (12/4/50) | 9.73±3.50 | 9.00±3.00 | 9.13±3.79 | 0.615 | 0.937 |
| First detection of BKV (17/4/62) | 6.02±5.06 | 10.00±1.96 | 6.02±3.76 | 0.998 | 0.019 |
| Peak BKV (9/4/50) | 8.60±2.54 | 9.50±2.32 | 6.93±2.62 | 0.082 | 0.066 |
| 1 month after peak BKV (8/4/48) | 5.46±1.06 | 5.68±0.62 | 6.43±2.40 | 0.073 | 0.562 |
| 3 months after peak BKV (9/4/48) | 6.34±2.90 | 5.53±1.11 | 6.16±2.24 | 0.830 | 0.584 |
| 6 months after peak BKV (9/4/46) | 5.57±2.21 | 5.85±1.58 | 5.60±1.97 | 0.964 | 0.500 |
| 1 year after peak BKV (10/4/46) | 5.11±1.30 | 5.75±1.05 | 5.32±2.04 | 0.755 | 0.500 |
| 2 years after peak BKV (10/4/46) | 4.21±1.92 | 4.75±1.15 | 5.48±1.63 | 0.034 | 0.478 |
| 3 years after peak BKV (10/4/44) | 2.84±1.19 | 3.75±0.13 | 5.07±2.09 | 0.002 | 0.221 |
| 4 years after peak BKV (11/4/42) | 3.07±1.21 | 3.60±1.22 | 4.45±1.29 | 0.002 | 0.315 |
| 5 years after peak BKV (7/1/34) | 3.16±1.37 | 4.80 | 5.04±2.04 | 0.025 | 0.971 |
| MMF (g/day) | |||||
| 1 month after KT (12/3/52) | 1.58±0.34 | 1.50±0.00 | 1.37±0.36 | 0.066 | 0.536 |
| First detection of BKV (12/3/55) | 1.35±0.56 | 1.33±0.29 | 1.23±0.40 | 0.357 | 0.690 |
| Peak BKV (12/3/56) | 1.02±0.48 | 1.17±0.58 | 0.79±0.58 | 0.214 | 0.261 |
| 1 month after peak BKV (12/3/53) | 0.69±0.47 | 0.67±0.76 | 0.40±0.52 | 0.082 | 0.509 |
| 3 months after peak BKV (12/3/55) | 0.58±0.37 | 0.42±0.38 | 0.39±0.42 | 0.152 | 0.843 |
| 6 months after peak BKV (12/3/56) | 0.58±0.37 | 0.42±0.38 | 0.42±0.41 | 0.223 | 0.961 |
| 1 year after peak BKV (13/4/54) | 0.71±0.35 | 0.75±0.29 | 0.45±0.45 | 0.058 | 0.159 |
| 2 years after peak BKV (15/4/51) | 0.78±0.36 | 0.88±0.25 | 0.56±0.37 | 0.043 | 0.111 |
| 3 years after peak BKV (14/4/53) | 0.79±0.37 | 0.88±0.25 | 0.60±0.41 | 0.140 | 0.192 |
| 4 years after peak BKV (14/4/48) | 0.75±0.35 | 0.88±0.25 | 0.59±0.39 | 0.182 | 0.160 |
| 5 years after peak BKV (9/2/37) | 0.78±0.32 | 0.88±0.18 | 0.64±0.39 | 0.314 | 0.491 |
BKV – BK virus; IS – immunosuppression; KT – kidney transplantation.
P-value – rejection group vs. no rejection group;
P-value – rejection group within 1 year vs. no rejection group.
BKV profiles and risk factors of acute rejection
Among the 79 study patients, 74 (93.7%) exhibited presumptive BK nephropathy within 1 year of KT. Twelve patients underwent allograft biopsy, and BK nephropathy was diagnosed on pathological examination in these patients. The duration of positive BKV PCR level and immunosuppression reduction did not significantly differ between the rejection and no rejection groups (Table 3). All the patients in the rejection group exhibited negative BKV conversion and 86.3% of the patients in the no rejection group exhibited negative BKV conversion (P=0.336). MMF discontinuation was observed in a greater number of patients in the no rejection group than in the rejection group (71.0% vs. 41.2%; P=0.043). Moreover, patients in whom the CNI level was reduced by >20% from the initial BKV detection timepoint to 1 month indicated a higher incidence of acute rejection (34.2% vs. 7.9%; P=0.008).
Table 3.
Profiles of the BK virus and rejection-related factors.
| Rejection group (n=17) | No rejection group (n=62) | P-value | |
|---|---|---|---|
| Duration of positive BKV PCR (months) | 17.88±19.86 | 22.58±18.00 | 0.354 |
| Negative conversion of BKV | 17 (100%) | 44 (86.3%) | 0.336 |
| Duration of IS reduction (months) | 41.76±32.72 | 44.84±27.30 | 0.695 |
| Duration of IS reduction after negative conversion of BKV PCR (months) | 28.65±28.31 | 28.67±27.94 | 0.997 |
| MMF modification | 0.043 | ||
| Reduction of MMF | 10 (58.8%) | 18 (29.0%) | |
| Discontinuation of MMF | 7 (41.2%) | 44 (71.0%) | |
| Reduction of CNI level by ≥20% at 1 month after the first detection of BKV | 12 (80.0%) | 23 (39.7%) | 0.008 |
| Reduction of MMF (n=28) | Discontinuation of MMF (n=51) | P-value | |
| Duration of positive BKV PCR (months) | 16.75±12.16 | 24.22±20.67 | 0.084 |
| The level of first-detected BKV PCR | 4.14±0.73 | 4.73±1.16 | 0.007 |
| The level of peak BKV PCR | 4.76±0.60 | 5.32±1.06 | 0.003 |
| ΔCNI level ≥20% (n = 35) | ΔCNI level <20% (n=38) | P-value | |
| Negative conversion of BKV PCR | 31 (88.6%) | 35 (91.5%) | 0.703 |
| Duration of positive BKV PCR (months) | 20.92±15.05 | 20.86±19.11 | 0.987 |
BKV – BK virus; CNI – calcineurin inhibitor; IS – immunosuppression.
The analysis of CNI level was performed in all the patients, except for 6 in whom the the CNI type was changed within 1 month after BKV detection.
Multivariate analysis indicated that the peak BKV PCR level (odds ratio [OR], 0.136 95% confidence interval [CI], 0.025–0.732; P=0.020), MMF discontinuation (vs. MMF reduction; OR, 0.112; 95% CI, 0.020–0.618; P=0.012), and CNI level reduction by ≥20% (OR, 33.752; 95% CI, 4.263–267.251; P=0.001) were significantly associated with acute rejection (Table 4).
Table 4.
Unadjusted and adjusted relative ratios for acute rejection.
| Unadjusted OR (95% CI) | P-value | Adjusted OR (95% CI) | P-value | |
|---|---|---|---|---|
| Body mass index | 1.146 (0.985–1.334) | 0.078 | 1.205 (0.965–1.505) | 0.100 |
| Level of peak BKV PCR | 0.777 (0.419–1.442) | 0.424 | 0.136 (0.025–0.732) | 0.020 |
| MMF discontinuation | 0.286 (0.094–0.870) | 0.027 | 0.112 (0.020–0.618) | 0.012 |
| Reduction of CNI level by ≥20% at 1 month after the first detection of BKV | 6.087 (1.546–23.959) | 0.010 | 33.752 (4.263–267.251) | 0.001 |
BKV – BK virus; CI – confidence interval; CNI – calcineurin inhibitor; MMF – mycophenolate mofetil; OR – odds ratio.
Discussion
Immunosuppression reduction is important for the management of BK nephropathy. Although several strategies for immunosuppression reduction have been previously suggested [8–11], acute rejection was sometimes reported after immunosuppression reduction. However, it is not clear whether immunosuppression reduction for BK nephropathy increases the incidence of acute rejection, and the risk factors of acute rejection in these cases also remain unknown.
In this present study, KT recipients who experienced acute rejection after immunosuppression reduction exhibited poorer graft function than patients without acute rejection. Moreover, the rejection group showed lower tacrolimus levels than the no rejection group, although the MMF doses were not lower in the rejection group. A greater number of patients in the rejection group exhibited CNI level reduction by >20% at 1 month after the initial BKV detection. The peak BKV PCR level, MMF discontinuation or MMF reduction, and CNI level reduction by >20% were significantly associated with acute rejection.
A greater number of patients experienced acute rejection after MMF reduction than after MMF discontinuation in this study. However, when comparing the intensity of BKV infection, the initially detected BKV PCR level (4.14±0.73 vs. 4.73±1.16 log10 copies/ml; P=0.007) and the peak BKV PCR level (4.76±0.60 vs. 5.32±1.06 log10 copies/ml; P=0.003) were higher in patients with MMF discontinuation (Table 3). The duration of positive BKV on PCR was 16.75±12.16 months in patients with MMF reduction and 24.22±20.67 months in patients with MMF discontinuation (P=0.084). Thus, the intensity of BKV infection was stronger in patients with MMF discontinuation. These findings suggest that BKV infection is a manifestation of over-immunosuppression, and hence, the incidence of acute rejection did not increase in patients with MMF discontinuation due to the presence of more intense viremia.
Acute rejection occurred more often in patients with CNI level reduction by >20% from baseline to 1 month after the initial BKV detection. The duration of positive BKV on PCR (20.92±15.05 vs. 20.86±19.11 months; P=0.987) and the rate of negative BKV PCR conversion (88.6% vs. 91.5%, P=0.703) did not significantly differ between patients with CNI level reduction by >20% and those with CNI level reduction by <20% (Table 3). Thus, CNI level reduction by >20% was associated with the development of acute rejection, regardless of the intensity of BKV infection in this study.
Previous studies that evaluated the efficacy of immunosuppression reduction for BKV infection reported some cases of acute rejection [8–10,12–16]. Ginervri et al. [9] prospectively monitored the BKV levels and preemptively reduced immunosuppression. In their study, the CNI level was reduced by 15–20% as the viral load increased over 4 weeks, and if BK viremia persisted, the MMF dose was halved or discontinued in those cases. None of the patients experienced acute rejection after immunosuppression reduction. However, the recipients in that study were children, and the median follow-up was only 24 months. Hardinger et al. [14] reported the 5-year follow-up results of a 1-year prospective trial that evaluated the pre-emptive withdrawal of immunosuppression in KT recipients with BK viremia. Among the 23 patients with BK viremia, 3 experienced early rejection (within 1 year of KT) and 2 experienced late rejection. The total incidence of acute rejection (5 of 23 patients) was similar to that in the present study (17 of 79 patients). Moreover, in the study of Hardinger et al. [14], acute rejection was less common in cases receiving tacrolimus than in those receiving cyclosporine (9% vs. 18%; P=0.082). However, in the present study, the occurrence of acute rejection did not significantly differ according to the initial CNI administered (19% for tacrolimus vs. 28.6% for cyclosporine; P = 0.368).
Weiss et al. [16] reported that, in the small number of patients they examined, the risk of acute rejection did not differ according to the immunosuppression reduction strategy. However, our study showed that CNI level reduction by >20% at 1 month after the initial BKV detection was significantly associated with the occurrence of acute rejection. Moreover, the tacrolimus level was lower in the rejection group, in contrast to the MMF dose. These findings suggest that the risk of acute rejection might depend on the tacrolimus level.
Although this study has limitations of retrospective design and lack of protocol biopsies, our study evaluated the incidence of acute rejection in KT recipients after immunosuppression reduction for presumptive BK nephropathy with long-term follow-up; to our knowledge, this is the first study to assess the risk factors of acute rejection in these cases.
Conclusions
CNI dose reduction by >20% at 1 month after the initial BKV detection can increase the risk of acute rejection. KT recipients who experienced acute rejection after immunosuppression reduction showed poor graft survival in the present study. Hence, further studies are necessary to determine the optimal strategy of immunosuppression for the effective management of presumed BK nephropathy while minimizing acute rejection.
Footnotes
Conflict of interest
None.
Source of support: Departmental sources
References
- 1.Gardner SD, Field AM, Coleman DV, Hulme B. New human papovavirus (B.K.) isolated from urine after renal transplantation. Lancet. 1971;1:1253–57. doi: 10.1016/s0140-6736(71)91776-4. [DOI] [PubMed] [Google Scholar]
- 2.Egli A, Infanti L, Dumoulin A, et al. Prevalence of polyomavirus BK and JC infection and replication in 400 healthy blood donors. J Infect Dis. 2009;199:837–46. doi: 10.1086/597126. [DOI] [PubMed] [Google Scholar]
- 3.Knowles WA, Pipkin P, Andrews N, et al. Population-based study of antibody to the human polyomaviruses BKV and JCV and the simian polyomavirus SV40. J Med Virol. 2003;71:115–23. doi: 10.1002/jmv.10450. [DOI] [PubMed] [Google Scholar]
- 4.Sawinski D, Goral S. BK virus infection: An update on diagnosis and treatment. Nephrol Dial Transplant. 2015;30:209–17. doi: 10.1093/ndt/gfu023. [DOI] [PubMed] [Google Scholar]
- 5.Hirsch HH, Brennan DC, Drachenberg CB, et al. Polyomavirus-associated nephropathy in renal transplantation: Interdisciplinary analyses and recommendations. Transplantation. 2005;79:1277–86. doi: 10.1097/01.tp.0000156165.83160.09. [DOI] [PubMed] [Google Scholar]
- 6.Hirsch HH, Randhawa P AST Infectious Diseases Community of Practice. BK polyomavirus in solid organ transplantation. Am J Transplant. 2013;13(Suppl 4):179–88. doi: 10.1111/ajt.12110. [DOI] [PubMed] [Google Scholar]
- 7.Kim H, Yu H, Baek CH, et al. High-dose steroid therapy in BK viremia adversely affected the long-term graft function after kidney transplantation. Transpl Infect Dis. 2016;18:844–49. doi: 10.1111/tid.12604. [DOI] [PubMed] [Google Scholar]
- 8.Brennan DC, Agha I, Bohl DL, et al. Incidence of BK with tacrolimus versus cyclosporine and impact of preemptive immunosuppression reduction. Am J Transplant. 2005;5:582–94. doi: 10.1111/j.1600-6143.2005.00742.x. [DOI] [PubMed] [Google Scholar]
- 9.Ginevri F, Azzi A, Hirsch HH, et al. Prospective monitoring of polyomavirus BK replication and impact of pre-emptive intervention in pediatric kidney recipients. Am J Transplant. 2007;7:2727–35. doi: 10.1111/j.1600-6143.2007.01984.x. [DOI] [PubMed] [Google Scholar]
- 10.Schaub S, Hirsch HH, Dickenmann M, et al. Reducing immunosuppression preserves allograft function in presumptive and definitive polyomavirus-associated nephropathy. Am J Transplant. 2010;10:2615–23. doi: 10.1111/j.1600-6143.2010.03310.x. [DOI] [PubMed] [Google Scholar]
- 11.Johnston O, Jaswal D, Gill JS, et al. Treatment of polyomavirus infection in kidney transplant recipients: A systematic review. Transplantation. 2010;89:1057–70. doi: 10.1097/TP.0b013e3181d0e15e. [DOI] [PubMed] [Google Scholar]
- 12.Almeras C, Foulongne V, Garrigue V, et al. Does reduction in immunosuppression in viremic patients prevent BK virus nephropathy in de novo renal transplant recipients? a prospective study. Transplantation. 2008;85:1099–104. doi: 10.1097/TP.0b013e31816a33d4. [DOI] [PubMed] [Google Scholar]
- 13.Elfadawy N, Flechner SM, Liu X, et al. The impact of surveillance and rapid reduction in immunosuppression to control BK virus-related graft injury in kidney transplantation. Transpl Int. 2013;26:822–32. doi: 10.1111/tri.12134. [DOI] [PubMed] [Google Scholar]
- 14.Hardinger KL, Koch MJ, Bohl DJ, et al. BK-virus and the impact of pre-emptive immunosuppression reduction: 5-year results. Am J Transplant. 2010;10:407–15. doi: 10.1111/j.1600-6143.2009.02952.x. [DOI] [PMC free article] [PubMed] [Google Scholar]
- 15.Hirsch HH, Knowles W, Dickenmann M, et al. Prospective study of polyomavirus type BK replication and nephropathy in renal-transplant recipients. N Engl J Med. 2002;347:488–96. doi: 10.1056/NEJMoa020439. [DOI] [PubMed] [Google Scholar]
- 16.Weiss AS, Gralla J, Chan L, et al. Aggressive immunosuppression minimization reduces graft loss following diagnosis of BK virus-associated nephropathy: A comparison of two reduction strategies. Clin J Am Soc Nephrol. 2008;3:1812–19. doi: 10.2215/CJN.05691207. [DOI] [PMC free article] [PubMed] [Google Scholar]


