

Abstract
Background
We identified risk factors for acute and chronic graft-versus-host disease (aGVHD and cGVHD, respectively) in recipients after hematopoietic stem cell transplantation (HSCT) from unrelated donors in the China Marrow Donor Program (CMDP).
Material/Methods
We analyzed follow-up clinical information from 1824 patients who underwent HSCT between 2001 and 2010.
Results
The incidence of aGVHD and cGVHD after transplantation was 49.29% and 27.3%, respectively. aGVHD incidence decreased as HLA matching increased (p<0.001). Incidence of aGVHD and cGVHD was higher in 2 HLA-A locus donor/recipient groups (02: 01/02: 06 and 02: 01/02: 07; p≤0.022). aGVHD incidence was associated with patient age, absence of rabbit anti-thymocyte globulin (ATG) pretreatment, and disease status (p≤0.040). aGVHD appeared to be a risk factor for cGVHD, and total body irradiation (TBI) was also associated with cGVHD. Patients with cGVHD after transplantation had a higher survival rate than patients without cGVHD (p<0.001), which may be due to reduced relapse rates. Survival was also associated with ATG prophylaxis and disease status.
Conclusions
The incidence of GVHD after HSCT from unrelated donors in the Chinese population is similar to the results reported from other countries. A high degree of HLA matching, a conditioning regimen without TBI, and the use of ATG may reduce the incidence of aGVHD.
MeSH Keywords: Graft vs Host Disease, Whole-Body Irradiation, Hematopoietic Stem Cell Transplantation, Hematopoietic Stem Cells
Background
Peripheral blood stem cell transplantation (PBSCT) from unrelated donors has become an important therapeutic tool for patients with blood diseases, especially hematologic malignancies. Improved treatment efficacy as a result of the development of human leukocyte antigen (HLA) matching techniques and higher numbers of unrelated donors have led to its increased use [1], with an almost 3-fold increase in the last decade [2]. Peripheral blood grafts have many advantages [1,3]. As compared to bone marrow grafts, peripheral blood grafts have higher levels of CD34+ cells and faster hematopoietic reconstitution after transplantation, reducing early transplant-related mortality. In addition, anesthesia and surgery can be avoided, the number of blood transfusions is lower, and hospital stays are shorter.
Despite these advantages, most patients develop varying grades of graft-versus-host disease (GVHD) after transplantation as a result of the delivery of a large number of immunocompetent mature T cells, which interact with patient’s antigen-presenting cells, resulting in a massive release of cytokines that may further amplify the immune reaction [4,5], leading to tissue and organ damage by donor T lymphocytes. Although prophylactic immunosuppression is always used, GVHD remains the main cause of treatment-related deaths and is one of the most significant factors affecting treatment efficacy for those undergoing PBSCT from unrelated donors [6].
GVHD is divided into 2 categories according to the time of onset: acute GVHD (aGVHD) and chronic GVHD (cGVHD), with aGVHD was defined as occurring within 100 days following transplantation [7]. However, with the development of peripheral blood stem cell transplantation, the American Society of Hematology reclassified GVHD in 2012 according to the time of occurrence, pathogenesis, and clinical manifestations [7]. In this classification, aGVHD that occurs after 100 days is classified as delayed aGVHD, and cGVHD that occurs within 100 days, along with possible aGVHD symptoms, is classified as overlap syndrome.
Although the specific factors that lead to GVHD are not clear, the degree of HLA matching between donors and recipients [8,9], differences in sex between donor-recipient pairs [8,10], the conditioning regimen, GVHD prophylaxis, and cytomegalovirus (CMV) infection may be associated with GVHD. The present retrospective analysis aimed to investigate the risk factors associated with aGVHD and cGVHD, including sex, age, degree of human leukocyte antigen (HLA) matching, CD34+ cell dose, mononuclear cell (MNC) dose, conditioning regimen, and GVHD prophylaxis, in patients undergoing hematopoietic stem cell transplantation (HSCT) from unrelated donors in the China Marrow Donor Program (CMDP). This is the first large-scale, multicenter analysis of the factors associated with GVHD in China through the CMDP. Identification of factors associated with GVHD will enable earlier prophylactic treatment for patients at increased risk.
Material and Methods
Study participants
This retrospective study analyzed the clinical follow-up information from patients that received HSCT from unrelated donors between 2001 and 2010 using a database maintained by the China Marrow Donor Program. After duplicate and incomplete data were eliminated, 1824 cases were analyzed. Follow-up was completed in March 2013, with a median follow-up time of 620 days. The shortest follow-up time was 12 days, and the longest follow-up time was 2771 days. Patient informed consent was waived due to the characteristics of a retrospective study.
Disease diagnosis and status before transplantation
The diagnostic criteria of GVHD used in present study included the Seattle Gluckaberg criteria and the International Bone Marrow Transplant Registry (IBMTR) severity index [11].
Pretreatment disease status was defined as follows. Status I included complete remission (first time) (CR1), chronic phase-phase one (CP1), and myelodysplastic syndrome (MDS), including refractory anemia (RA), refractory anemia with ring sideroblasts (RARS), refractory cytopenia with multilineage dysplasia (RCMD), refractory cytopenia with multilineage dysplasia and ringed sideroblasts (RCMD-RS), and myelodysplastic syndrome-unclassified (MDS-U). Status II included complete remission (second time) (CR2), accelerated phase (AP), chronic phase-phase 2 (CP2), partial remission (PR), and myelodysplastic syndrome (MDS), including MDS RAEB I and RAEB II. Status III included no remission (NR), blastic crisis (BC), ≥CR3 (greater than or equal to 3 times that of complete remission), and MDS treatment-related acute myeloid leukemia (tAML).
HSCT protocol
Donors were given granulocyte colony-stimulating factor (G-CSF) at a dosage of 10 μg/kg/d to mobilize peripheral blood stem cells, and the peripheral blood cells were collected at 5 and 6 days following mobilization, as previously described [12]. For the transplantation, the mononuclear cell (MNC) median dose was 6.6×10⁸ cells/kg and the CD34+ cell median dose was 4.36×10⁶ cells/kg [13].
Conditioning regimen and GVHD prophylaxis protocols
The conditioning regimen included total body irradiation (TBI) at a dose of 5 Gy administered 2 times for 268 (19.2%) patients. Furthermore, 83.9% of the patients received myeloablative conditioning (MAC) while the remaining 16.1% received reduced-intensity conditioning (RIC). For those 898 (64.5%) patients receiving GVHD prophylaxis, treatment included rabbit anti-(human) thymocyte globulin (ATG) for 2.5 mg/kg/d for 3 or 4 days, the total dose was 7.5–10 mg/Kg.
Statistical analysis
General data and demographic and clinical data are summarized as mean±standard deviation (SD) with range (minimum to maximum) for age, median with range (minimum to maximum) for time-related data, and n(%) for categorical data. Demographic and clinical data and were analyzed by 2-sample t tests for continuous data with normal distribution, Mann-Whitney tests for continuous data without normal distribution, Pearson chi-square or Fisher’s exact tests for categorical data, and log-rank tests for survival time. Moreover, a univariate Cox regression model was used to identify the association of GVHD occurrence and overall survival (OS) with mismatch of HLA loci. A multivariate Cox regression model was used to identify the association of GVHD occurrence and OS with multiple variables that had a significant association in univariate analysis. Results are shown as hazard rates (HRs) with corresponding 95% confidence intervals (95% CI) and p values. Additionally, for the survival time, the estimated mean survival time with 95%CI was determined by disease status for a given disease diagnosis and compared using log-rank tests. Kaplan-Meier survival curves were also used to determine the cumulative survival rate by disease status for a given disease diagnosis. All statistical assessments were 2-tailed and considered significant for p values <0.05. All statistical analyses were carried out with IBM SPSS statistical software version 22 for Windows (IBM Corp., New York, NY).
Results
Incidence and occurrence of GVHD
A total of 1824 patients who underwent HSCT using stem cells from unrelated donors between 2001 and 2010 were analyzed. The median leukocyte engraftment time was 13 days, and the median platelet engraftment time was 14 days. The primary graft failure rate was 1.8%.
As shown in Table 1, the incidence of aGVHD was 49.3% (899/1824); cGVHD occurred in 27.3% (498/1824) of the patients. aGVHD occurrence was at 24 days (range, 0 to 128 days), and most patients (863/899) developed aGVHD within 100 days after transplantation, irrespective of grade. In contrast, cGVHD occurred at 150 days (range, 1 to 1645 day). Of the 498 patients with cGVHD, 299 were diagnosed with extensive cGVHD, and 145 patients had the limited stage (Table 1). The sites of aGVHD and cGVHD are all summarized in Supplementary Table 1.
Table 1.
Incidence and occurrence time of GVHD (N=1824).
| aGVHD | cGVHD | |
|---|---|---|
| Total incidence | 899 (49.3%) | 498 (27.3%) |
| At ≤100 days | 863 | 124 |
| At >100 days | 2 | 350 |
| Undefined occurrence time | 34 | 24 |
| Time of occurrence, median days (range, min to max) | 24 (0* to 128) | 150 (1 to 1645) |
| Grade of aGVHD occurred (at ≤100 days/total) | ||
| I | 381/390 | |
| II | 267/277 | |
| III | 101/110 | |
| IV | 109/113 | |
| Undefined | 6/9 | |
| Type of cGVHD | ||
| Extensive stage | – | 299 |
| Limited stage | – | 145 |
| Undefined | – | 54 |
One subject died at the transplantation date.
Donor and patient characteristics
The donor and patient demographic and clinical data are shown in Table 2. The mean age of the donors was 30.83 years (range, 18 to 52 years); it was 27.38 years (range, 1 to 76 years) for the patients. The 3 most frequent disease diagnoses were acute myeloid leukemia (AML), acute lymphoblastic leukemia (ALL), and chronic myeloid leukemia (CML) (31.5%, 25.9%, and 25.1%, respectively). Before the transplantation, 76.1% of the patients had CR1, CP, and MDS.
Table 2.
Donor and patient demographics and clinical data by acute and chronic GVHD (N=1824).
| Parameters | Total (n=1824) | aGVHD | cGVHD | ||||
|---|---|---|---|---|---|---|---|
| aGVHD (n=899) | Non-aGVHD (n=925) | p-value | cGVHD (n=498) | Non-cGVHD (n=1326) | p-value | ||
| Donor’s age, mean ±SD (range, min. to max.) | 30.83±6.47 (18 to 52) | 31.04±6.50 (18 to 52) | 30.64±6.45 (19 to 50) | 0.198 | 30.80±6.40 (18 to 50) | 30.84±6.51 (18 to 52) | 0.975 |
| Patients’ age, mean ±SD (range, min. to max.) | 27.38±11.85 (1 to 76) | 26.70±11.54 (1 to 69) | 28.05±12.10 (1 to 76) | 0.033* | 27.36±11.79 (1 to 76) | 27.39±11.87 (1 to 69) | 0.920 |
| Sex1 (Donor-Patient) | 0.099 | 0.014* | |||||
| Male vs. Male | 707 (47.1) | 342 (47.5) | 365 (46.7) | 195 (47.6) | 512 (46.9) | ||
| Male vs. Female | 383 (25.5) | 170 (23.6) | 213 (27.2) | 84 (20.5) | 299 (27.4) | ||
| Female vs. Female | 148 (9.9) | 66 (9.2) | 82 (10.5) | 51 (12.4) | 97 (8.9) | ||
| Female vs. Male | 264 (17.6) | 142 (19.7) | 122 (15.6) | 80 (19.5) | 184 (16.8) | ||
| Diagnostic results | 0.051 | 0.025* | |||||
| AML | 476 (31.5) | 220 (29.0) | 256 (34.1) | 126 (29.7) | 350 (32.3) | ||
| ALL | 391 (25.9) | 205 (27.0) | 186 (24.8) | 107 (25.2) | 284 (26.2) | ||
| CML | 379 (25.1) | 210 (27.7) | 169 (22.5) | 130 (30.7) | 249 (22.9) | ||
| AA | 77 (5.1) | 34 (4.5) | 43 (5.7) | 13 (3.1) | 64 (5.9) | ||
| MDS | 70 (4.6) | 29 (3.8) | 41 (5.5) | 16 (3.8) | 54 (5.0) | ||
| NHL | 50 (3.3) | 50 (3.3) | 28 (3.7) | 17 (4.0) | 33 (3.0) | ||
| HAL | 13 (0.9) | 9 (1.2) | 4 (0.5) | 4 (0.9) | 9 (0.8) | ||
| MM | 7 (0.5) | 2 (0.3) | 5 (0.7) | 2 (0.5) | 5 (0.5) | ||
| CMML | 3 (0.2) | 2 (0.3) | 1 (0.1) | 2 (0.5) | 1 (0.1) | ||
| CLL | 2 (0.1) | 1 (0.1) | 1 (0.1) | 0 (0) | 2 (0.2) | ||
| Other | 41 (2.7) | 25 (3.3) | 16 (2.1) | 7 (1.7) | 34 (3.1) | ||
| Pre-transplant disease statusa | 0.020* | 0.778 | |||||
| Status I | 969 (76.1) | 477 (73.2) | 492 (79.2) | 285 (77.4) | 684 (75.6) | ||
| Status II | 191 (15.0) | 105 (16.1) | 86 (13.8) | 52 (14.1) | 139 (15.4) | ||
| Status III | 113 (8.9) | 70 (10.7) | 43 (6.9) | 31 (8.4) | 82 (9.1) | ||
| HLA matching type | <.001* | 0.347 | |||||
| 10/10 | 757 (44.8) | 320 (39.1) | 437 (50.1) | 191 (40.9) | 566 (46.2) | ||
| 9/10 | 591 (34.9) | 303 (37.0) | 288 (33.0) | 174 (37.3) | 417 (34.1) | ||
| 8/10 | 246 (14.5) | 140 (17.1) | 106 (12.1) | 70 (15.0) | 176 (14.4) | ||
| 7/10 | 81 (4.8) | 45 (5.5) | 36 (4.1) | 26 (5.6) | 55 (4.5) | ||
| 6/10 | 13 (0.8) | 9 (1.1) | 4 (0.5) | 5 (1.1) | 8 (0.7) | ||
| 5/10 | 3 (0.2) | 1 (0.1) | 2 (0.2) | 1 (0.2) | 2 (0.2) | ||
| Conditioning regimens, TBI | <0.001* | 0.011* | |||||
| (+) | 268 (19.2) | 169 (25.0) | 99 (13.8) | 90 (23.6) | 178 (17.6) | ||
| (−) | 1125 (80.8) | 508 (75.0) | 617 (86.2) | 291 (76.4) | 834 (82.4) | ||
| Pretreatment with ATG | <0.001* | 0.014* | |||||
| (+) | 898 (64.5) | 388 (57.3) | 510 (71.2) | 226 (59.3) | 672 (66.4) | ||
| (−) | 495 (35.5) | 289 (42.7) | 206 (28.8) | 155 (40.7) | 340 (33.6) | ||
| MNC dose | 0.887 | 0.063 | |||||
| <5×10⁸/Kg | 281 (18.1) | 141 (17.7) | 140 (18.5) | 91 (21.0) | 190 (17.0) | ||
| 5–10×108/Kg | 1058 (68.3) | 547 (68.8) | 511 (67.7) | 277 (63.8) | 781 (70.0) | ||
| >10×108/Kg | 211 (13.6) | 107 (13.5) | 104 (13.8) | 66 (15.2) | 145 (13.0) | ||
| CD34+ cell dose | 0.786 | 0.743 | |||||
| < 2×10⁶/Kg | 143 (9.6) | 74 (9.8) | 69 (9.3) | 38 (9.2) | 105 (9.7) | ||
| ≥2×10⁶/Kg | 1353 (90.4) | 669 (90.2) | 684 (90.7) | 377 (90.8) | 976 (90.3) | ||
| Relapse | 0.499 | 0.036* | |||||
| Yes | 175 (9.6) | 82 (9.1) | 93 (10.1) | 36 (7.2) | 139 (10.5) | ||
| No | 1649 (90.4) | 817 (90.9) | 832 (89.9) | 462 (92.8) | 1187 (89.5) | ||
| Survival status | 0.001* | ||||||
| Alive | 1385 (75.9) | 655 (72.9) | 730 (78.9) | 0.002* | 406 (81.5) | 979 (73.8) | |
| Dead | 439 (24.1) | 244 (27.1) | 195 (21.1) | 92 (18.5) | 347 (26.2) | ||
| Survival time, median days (range, min. to max.) | 365 (0 to 2812) | 365 (7 to 2664) | 365 (0 to 2812) | 0.030* | 465 (7 to 2388) | 302 (0 to 2812) | <0.001* |
There were 322 patients with undefined or missing data for donor/patient sex, 315 cases of undefined/missing diagnostic results, 551 cases of undefined/missing pre-transplant disease status, 133 cases of undefined/missing HLA matching, 431 cases of undefined/missing TBI-ATG therapy, 274 cases of undefined/missing MNC number, 328 cases of undefined/missing CD34+ cell dose, and 207 cases of undefined/missing survival times.
Pre-transplant disease Status I included complete remission (first time) (CR1), chronic phase-phase one (CP1), and myelodysplastic syndrome (MDS), including refractory anemia (RA), refractory anemia with ring sideroblasts (RARS), refractory cytopenia with multilineage (RCMD), refractory cytopenia with multilineage dysplasia and ringed sideroblasts (RCMD-RS), and myelodysplastic syndrome-unclassified (MDS-U). Status II included complete remission (second time) (CR2), accelerated phase (AP), chronic phase-phase two (CP2), partial remission (PR), and MDS (RAEB-I and RAEB-II). Status III included no remission (NR), blastic crisis (BC), ≥CR3 (greater than or equal to three times that of complete remission), and MDS treatment-related acute myeloid leukemia (tAML).
AML – acute myeloid leukemia; ALL – acute lymphoblastic leukemia; CML – chronic myeloid leukemia; AA – aplastic anemia; MDS – myelodysplastic syndrome; NHL – non-Hodgkin’s lymphomas; ALL (Ph+) – acute lymphoblastic leukemia (with Ph chromosome); HAL – hairy cell leukemia; MM – multiple myeloma; CMML – chronic myelomonocytic leukemia; CLL – chronic lymphoblastic leukemia; TBI – total body irradiation; ATG – anti-thymocyte globulin; MNCs – mononuclear cells.
Categorical data were summarized as n (%).
p-values were derived via two-sample t-tests for continuous data with normal distribution, Mann-Whitney tests for continuous data without normal distribution, Pearson Chi-square or Fisher’s exact tests for categorical data, and log-rank tests for survival time.
p<0.05.
To prevent GVHD, ATG therapy was administered to 64.5% of the patients; 19.2% of patients were treated with TBI. In the HSCT, 81.9% of patients received ≥5×10⁸/kg MNCs and 90.4% received ≥2×10⁶/kg CD34+cells (Table 2). Regarding HLA matching, 757 patients had a full match, 934 patients had mismatched types (9/10–5/10), and 133 had undefined (missing) matched type.
Univariate analysis of factors associated with GVHD
Univariate analysis to identify donors and patient characteristics associated with GVHD revealed that aGVHD might be associated with patient age, pre-transplant disease status, HLA matching type, ATG therapy, TBI pre-managed therapy, and survival time (all p<0.05; Table 2). In contrast, cGVHD was associated with donor and patient sex, diagnostic results, ATG therapy, TBI pre-managed therapy, and survival time (all p<0.05; Table 2).
Association between HLA loci matching with GVHD
Univariate analysis to compare the association between aGVHD, high-grade aGVHD, cGVHD, and OS with HLA loci matching, was next undertaken (Table 3). The occurrence of aGVHD was associated with HLA loci mismatch at A02: 01-A02: 06 and A02: 01-A02: 07 as compared to the fully matched type (A02: 01-A02: 06: HR=1.667, 95%CI= [1.08 to 2.57], p=0.021; A02: 01-A02: 07: HR=2.19, 95%CI=[1.39 to 3.44], p=0.001). However, no associations were observed with high-grade aGVHD (Table 3). Similarly, cGVHD was associated with HLA loci mismatch at A02: 01-A02: 06 and A02: 01-A02: 07 as compared to the full-matched type (A02: 01-A02: 06: HR=1.78, 95%CI= [1.09 to 2.94], p=0.022; A02: 01-A02: 07: HR=2.31, 95%CI=[1.34 to 3.98], p=0.003; Table 3).
Table 3.
Associations HLA loci mismatch and aGVHD, high-grade aGVHD, cGVHD, and overall survival.
| Matched site (Donor–Patient) | aGVHD | High grade aGVHD | cGVHD | Overall survival | ||||||||
|---|---|---|---|---|---|---|---|---|---|---|---|---|
| n | HR (95%CI) | P-value | n | HR (95%CI) | P-value | n | HR (95%CI) | P-value | n | HR (95%CI) | P-value | |
| A site | ||||||||||||
| Fully matched | 757 | Reference | – | 57 | Reference | – | 680 | Reference | – | 670 | Reference | – |
| A0201-A0206 | 36 | 1.667 (1.082–2.570) | 0.021* | 5 | 0.982 (0.392–2.462) | 0.969 | 34 | 1.785 (1.086–2.935) | 0.022* | 33 | 0.667 (0.313–1.420) | 0.294 |
| A0201-A0207 | 30 | 2.187 (1.391–3.440) | 0.001* | 5 | 0.781 (0.312–1.956) | 0.598 | 27 | 2.308 (1.339–3.977) | 0.003* | 27 | 1.198 (0.613–2.341) | 0.597 |
| A0206-A0201 | 22 | 0.982 (0.506–1.905) | 0.957 | 2 | 1.840 (0.442–2.101) | 0.907 | 19 | 1.241 (0.583–2.641) | 0.575 | 18 | 1.251 (0.588–2.662) | 0.562 |
| A0207-A0201 | 28 | 1.346 (0.788–2.300) | 0.227 | 7 | 0.954 (0.433–2.101) | 0.907 | 25 | 1.496 (0.790–2.833) | 0.216 | 24 | 1.045 (0.491–2.224) | 0.909 |
| A0207-A0206 | 14 | 1.516 (0.751–3.060) | 0.245 | 1 | 1.593 (0.218–11.662) | 0.647 | 14 | 0.764 (0.284–2.057) | 0.594 | 14 | 1.594 (0.749–3.393) | 0.226 |
| Others | 104 | 1.086 (0.801–1.472) | 0.595 | 17 | 1.049 (0.608–1.810) | 0.865 | 102 | 0.906 (0.604–1.359) | 0.634 | 100 | 1.005 (0.674–1.498) | 0.981 |
| DR site | ||||||||||||
| Fully matched | 696 | Reference | – | 57 | Reference | – | 680 | Reference | – | 670 | Reference | – |
| DRB1 1202-1201 | 24 | 1.494 (0.874–2.552) | 0.142 | 2 | 1.368 (0.331–5.654) | 0.665 | 21 | 1.300 (0.611–2.765) | 0.497 | 22 | 1.048 (0.465–2.365) | 0.910 |
| Others | 74 | 1.757 (1.299–2.375) | <0.001* | 15 | 1.178 (0.652–2.130) | 0.587 | 73 | 1.391 (0.945–2.048) | 0.095 | 70 | 0.521 (0.284–0.959) | 0.036* |
| CW site | ||||||||||||
| Fully matched | 696 | Reference | – | 57 | Reference | – | 680 | Reference | – | 670 | Reference | – |
| CW 304-702 | 27 | 0.968 (0.544–1.723) | 0.912 | 1 | 0.515 (0.071–3.740) | 0.512 | 27 | 1.098 (0.541–2.229) | 0.797 | 27 | 1.149 (0.566–2.334) | 0.701 |
| CW 702-304 | 24 | 0.987 (0.526–1.853) | 0.968 | 4 | 0.975 (0.351–2.712) | 0.961 | 23 | 0.409 (0.131–1.282) | 0.125 | 23 | 0.973 (0.431–2.196) | 0.948 |
| Others | 260 | 1.447 (1.190–1.759) | <0.001* | 41 | 0.795 (0.528–1.196) | 0.271 | 257 | 1.132 (0.864–1.484) | 0.368 | 249 | 0.901 (0.669–1.214) | 0.494 |
HR – hazard ratio; 95%CI – 95% confidence interval of HR. Results were presented as HR with corresponding 95%CI and p-value through univariate Cox-regression analysis.
p<0.05.
Multivariate analysis to examine the factors associated with aGVHD and cGVHD was next carried out using variables with significant association in the univariate analysis. aGVHD was associated with patients with HLA loci in A site (donor – patients: A02: 01–A02: 06; HR=1.94), decreased patient age (HR=0.99), absence of ATG prophylaxis (HR=1.69), and pre-transplant disease status (status II: CR2, AP, CP2, PR, MDS [RAEB-I, RAEB-II], HR=1.52; status III: NR, BC, ≥CR3, MDS [tAML], HR=1.67) (all p≤0.040; Table 4). cGVHD was associated with HLA loci in A site (donor – patients: A02: 01–A02: 06, HR=2.29; A201-A207, HR=2.69), TBI therapy conditioning regimen (HR=1.48), and the presence of aGVHD (HR=1.72) (all p≤0.039; Table 4).
Table 4.
Multivariate analysis to identify clinical characteristics associated with aGVHD, cGVHD, and overall survival.
| Variables | Model I (aGVHD) | Model II (cGVHD) | Model III (Overall survival) | ||||||
|---|---|---|---|---|---|---|---|---|---|
| n | HR (95% CI) | P-value | n | HR (95% CI) | P-value | n | HR (95% CI) | P-value | |
| Matched site – A site (Donor–Patient) | |||||||||
| Fully matched | 331 | 1 | 432 | 1 | 314 | 1 | |||
| A0201-A0206 | 19 | 1.941 (1.121, 3.361) | 0.018* | 24 | 2.287 (1.307–4.003) | 0.004* | 19 | 0.607 (0.225, 1.637) | 0.324 |
| A0201-A0207 | 14 | 1.717 (0.889, 3.314) | 0.107 | 20 | 2.692 (1.418–5.110) | 0.002* | 13 | 1.465 (0.594, 3.612) | 0.407 |
| A0206-A0201 | 10 | 0.955 (0.387, 2.360) | 0.921 | 13 | 1.355 (0.587–3.131) | 0.477 | 9 | 0.985 (0.298, 3.253) | 0.980 |
| A0207-A0201 | 15 | 1.027 (0.502, 2.098) | 0.942 | 16 | 1.170 (0.510–2.684) | 0.711 | 15 | 0.775 (0.279, 2.148) | 0.624 |
| A0207-A0206 | 6 | 1.169 (0.424, 3.225) | 0.763 | 9 | 0.758 (0.238–2.410) | 0.638 | 6 | 0.911 (0.278, 2.979) | 0.877 |
| Others | 56 | 0.953 (0.625, 1.452) | 0.821 | 74 | 0.897 (0.553–1.455) | 0.659 | 56 | 0.763 (0.428, 1.360) | 0.360 |
| Donor’s age, yrs | 993 | 1.001 (0.981, 1.021) | 0.923 | 993 | 0.992 (0.970–1.016) | 0.524 | 993 | 0.988 (0.960, 1.018) | 0.425 |
| Patients’ age, yrs | 993 | 0.987 (0.975, 0.999) | 0.040* | 993 | 1.005 (0.992–1.019) | 0.453 | 993 | 1.011 (0.995, 1.027) | 0.178 |
| Sex (Donor–Patient) | |||||||||
| Male vs. Male | 230 | 1.094 (0.645, 1.858) | 0.739 | 306 | 0.889 (0.506–1.564) | 0.683 | 220 | 1.386 (0.587, 3.269) | 0.457 |
| Male vs. Female | 117 | 0.998 (0.570, 1.749) | 0.995 | 147 | 0.601 (0.322–1.124) | 0.111 | 110 | 0.923 (0.370, 2.304) | 0.864 |
| Female vs. Female | 34 | 1 | 41 | 1 | 29 | 1 | |||
| Female vs. Male | 70 | 1.139 (0.625, 2.079) | 0.670 | 94 | 0.898 (0.464–1.737) | 0.749 | 73 | 1.732 (0.698, 4.302) | 0.236 |
| Conditioning regimens, TBI | |||||||||
| (+) | 99 | 1.322 (0.968, 1.805) | 0.079 | 116 | 1.475 (1.020–2.133) | 0.039* | 95 | 0.781 (0.478, 1.254) | 0.306 |
| (−) | 352 | 1 | 472 | 1 | 150 | 1 | |||
| Pretreatment with ATG | |||||||||
| (+) | 295 | 0.591 (0.446, 0.784) | <0.001* | 394 | 0.889 (0.638–1.237) | 0.484 | 282 | 0.553 (0.375, 0.817) | 0.003* |
| (−) | 156 | 1 | 194 | 1 | 150 | 1 | |||
| CD34+ cell dose | |||||||||
| <2×10⁶/Kg | 39 | 1 | 38 | 1 | |||||
| ≥2×10⁶/Kg | 412 | 1.053 (0.654, 1.693) | 0.832 | 0.930 (0.485, 1.182) | 0.826 | ||||
| Pre-transplant disease statusa | |||||||||
| Status I | 350 | 1 | 336 | 1 | |||||
| Status II | 59 | 1.520 (1.046, 2.209) | 0.028* | 53 | 1.268 (0.716, 2.245) | 0.415 | |||
| Status III | 42 | 1.671 (1.092, 2.557) | 0.018* | 43 | 2.503 (1.492, 4.198) | 0.001* | |||
| aGVHD | |||||||||
| (+) | 262 | 1.715 (1.241–2.371) | 0.001* | ||||||
| (−) | 326 | 1 | |||||||
| aGVHD level | |||||||||
| III–IV | 46 | 3.183 (1.796, 5.643) | <0.001* | ||||||
| I–II | 155 | 0.753 (0.492, 1.152) | 0.191 | ||||||
| (−) | 228 | 1 | |||||||
| cGVHD | |||||||||
| (+) | 120 | 0.356 (0.224, 0.566) | <.001* | ||||||
| (−) | 312 | 1 | |||||||
| Relapse | |||||||||
| Yes | 54 | 5.916 (3.935, 8.894) | <0.001* | ||||||
| No | 375 | 1 | |||||||
Pre-transplant disease status included Status I: complete remission (first time) (CR1), chronic phase-phase one (CP1), and myelodysplastic syndrome (MDS), including refractory anemia (RA), refractory anemia with ring sideroblasts (RARS), refractory cytopenia with multilineage (RCMD), refractory cytopenia with multilineage dysplasia and ringed sideroblasts (RCMD-RS), and myelodysplastic syndrome-unclassified (MDS-U). Status II included complete remission (second time) (CR2), accelerated phase (AP), chronic phase-phase two (CP2), partial remission (PR), and MDS (RAEB-I and RAEB-II). Status III included no remission (NR), blastic crisis (BC), ≥CR3 (greater than or equal to three times that of complete remission), and MDS treatment-related acute myeloid leukemia (tAML).
TBI – total body irradiation; ATG – anti-thymocyte globulin; HR – hazard ratio; 95%CI – 95% confidence interval of HR.
Variables with significant association in univariate analysis were selected for multivariate analysis.
Results were presented as HR with corresponding 95%CI and p-value through multivariate Cox-regression analysis.
p<0.05.
Analysis of factors associated with OS
In the present study, 439 patients died during the follow-up period, and the overall survival (OS) time was a median of 365 days (range, 0 day to 7.7 y). One patient died on the day of transplantation (Table 2). The mortality rate by disease status for an AML, ALL, CML, and MDS diagnosis is shown in Figure 1. For patients with AML, ALL, and CML, the mortality rates were highest with stage III disease. Indeed, disease status was associated with the survival times of patients with AML, ALL, CML, and MDS (all p≤0.05; Supplementary Table 2). The survival times by disease status for a given disease diagnosis were also analyzed by Kaplan-Meier survival curve analysis (Figure 2).
Figure 1.

Proportion of patients who died at last follow-up by disease status for a given diagnosis.
Figure 2.

Kaplan-Meier survival curve by disease status for given disease diagnosis. AML (A), ALL (B), CML (C), MDS (D), NHL, HAL, MM, CMML, CLL (E), and others (F).
Although univariate analysis found no association between HLA loci matching and OS, an association with other DR site status was observed (p=0.036; Table 3). Subsequent multivariate analysis using variables associated with aGVHD and cGVHD in univariate analysis showed that pre-transplant disease status III (including NR, BC, ≥CR3, MDS [tAML], HR=2.50), aGVHD level III-IV (HR= 3.18), and relapse (HR=5.92) were associated with reduced OS (both p≤0.001; Table 4). Furthermore, ATG therapy (HR=0.55) and cGVHD (HR=0.36) were associated with prolonged survival time (both p≤0.003; Table 4). However, the relapsed rate was higher for patients without cGVHD than those with cGVHD (10.5% vs. 7.2%, p=0.036; Table 2).
Analysis of OS by aGVHD level revealed that HLA loci mismatching at A02: 01-A02: 07 (HR=6.76), pretreatment with ATG (HR=0.39), pre-transplant disease status II (HR=2.89), cGVHD (HR=0.19), and relapse (HR=12.64) were all associated with the survival time in patients with aGVHD levels I–II (all p≤0.036; Supplementary Table 3). In patients with aGVHD levels III–IV, OS was associated with patient age (HR=1.05) and relapse (HR=16.43) (both p≤0.046; Supplementary Table 3).
Event-free survival and time to relapse
Of the 1617 patients with known survival status, the transplant-related mortality rate was 22.9% (371/1617) with a median time to event-free survival (EFS) of 88.8 months (95% CI, 43.8–133.7 months; Figure 3). Log-rank tests showed that EFS times were associated with aGVHD types (p=0.002; Figure 4A). Kaplan-Meier curves showed that the EFS rates for patients with aGVHD or in non-aGVHD were both >50%, and the estimated mean EFS times were 60.0 months (95% CI, 55.6–64.3 months) and 69.6 months (95% CI, 65.1–74.1 months) for patients with aGVHD and non-aGVHD, respectively (Figure 4A). Log-rank tests showed that the EFS times were also associated with the cGVHD (p<0.001; Figure 4B). Kaplan-Meier curves showed that the estimated mean EFS times were 62.7 months (95% CI, 58.2–67.3 months) and 62.1 months (95% CI, 57.9–66.4 months) for patients with cGVHD and non-cGVHD, respectively (Figure 4B). The relapse curves with respect to aGVHD (Figure 5A) and cGVHD (Figure 5B) were also determined. The estimated mean time to relapse was 80.4 months (95%CI, 78.5–82.3 months). Although the log-rank test showed the relapse time was associated with cGVHD, it was not associated with aGVHD (cGVHD: 71.6 months [95% CI, 69–74.1 months] vs. 78.8 months [95% CI, 76.4–81.2 months], p<0.001 and aGVHD: 77.1 months, [95% CI, 74.7–79.5 months] vs. 79.4 months [95% CI, 76.5–82.3 months], p=0.508).
Figure 3.
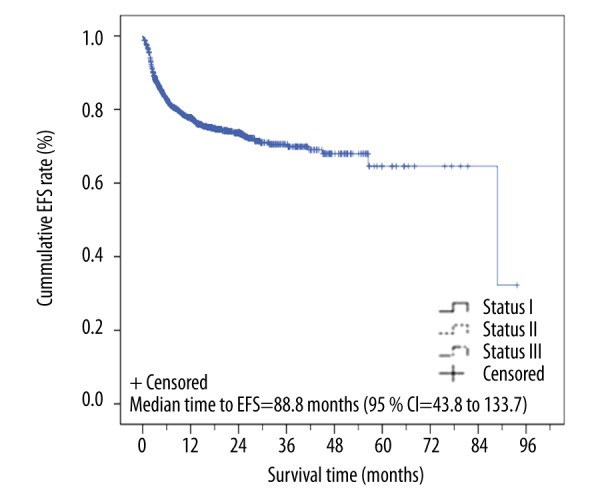
Kaplan-Meier curve of event-free survival (EFS) time of patients (n=1617). The events included all transplant-related deaths.
Figure 4.

Kaplan-Meier curve of event-free survival (EFS) time of patients by aGVHD status. The events included all transplant-related deaths.
Figure 5.

Kaplan-Meier curve of relapse-free survival of patients by aGVHD (A) and cGVHD (B) status. The events included all cases of relapse after transplantation. The estimated mean relapse time was 77.1 months (95% CI, 74.7–79.5 months) and 79.4 months (95% CI, (76.5–82.3 months) for the aGVHD and non-aGVHD groups, respectively (p=0.508). The estimated mean relapse time was 71.6 (95% CI, 69–74.1 months) and 78.8 months [95% CI, 76.4–81.2 months) for the cGVHD and non-cGVHD groups (p<0.001).
Discussion
The development of HLA typing techniques makes it possible to identify matched unrelated donors for patients who lack related HLA-matched donors. However, a large proportion of patients experience GVHD following HSCT, despite prophylactic treatment. The present study was undertaken to identify factors associated with GVHD following HSCT from unrelated donors in the CMDP. aGVHD incidence decreased significantly as HLA matching increased. In addition, aGVHD was associated with patient age, absence of ATG pretreatment, and disease status. cGVHD was associated with aGVHD and TBI. Survival analysis revealed that patients with cGVHD after transplantation had a higher survival rate than patients without cGVHD, which may be due to lower relapse rates. Survival was also associated with ATG prophylaxis and disease status.
Post-transplantation outcomes are worse with HLA-C loci match and DP1 site mismatch [14], and worse outcomes were noted with HLA-A and DRB1 site mismatches as compared to B and C site mismatches [15,16]. The degree of HLA loci matching is associated with aGVHD [17]; as it increases, the incidence of aGVHD significantly decreases [15,18,19]. Inferior outcomes have also been noted regardless of HLA allele mismatch [20]. In an analysis by the China Marrow Donor Program that included 1874 cases of HSCT from unrelated donors, mismatch of the HLA-A, B, CW, and DRB1 alleles were significantly associated with an increased risk of mortality and GVHD. A similar analysis of 2941 cases of allogeneic HSCT found that HLA mismatch was associated with an increased risk of moderate-to-high-grade aGVHD [21]. Similarly, HLA loci matching status was significantly associated with a composite endpoint of GVHD-free/relapse-free survival [22]. Furthermore, in Chinese patients, HLA-A, B, C locus mismatch was associated with lower OS and grade II–IV acute GVHD compared with HLA-matched pairs [23]. Morishima et al. [24] also showed that mismatch in the HLA-C alleles was a significant risk factor for cGVHD; mismatch between HLA-A2 alleles (donor 02: 01 with patient 02: 06) was associated with GVHD and negatively impacted patient survival [25]. Similarly, in the present study, aGVHD was significantly associated with the degree of HLA matching. Furthermore, HLA loci mismatch at A02: 01-A02: 06 was significantly associated with increased risk of aGVHD and cGVHD; mismatch at A02: 01-A02: 07 was also associated with cGVHD by multivariate analysis. Mismatch at CW sites other than CW 304–702 and 702–304 was also associated with aGVHD only. However, mismatch at the A, DR, and CW loci were not associated with high-grade aGVHD. This is in contrast to results reported by Kawase et al. [26], who analyzed 5210 donor/patient pairs and found that both the A and CW loci mismatches were significantly correlated with high-grade GVHD. This discrepancy may be due to ethnic differences or the small sample size in the present study. Nevertheless, post-transplant cyclophosphamide may prevent GVHD despite HLA donor mismatch [27]. The influence of a HLA mismatch site on post-transplantation GVHD is connected with the degree of HLA allele mismatch, which leads to inconsistent HLA matching conclusions. Thus, our results must be verified in larger studies with more patients.
Previous studies have also shown that donor and patient age and sex were associated with GVHD [8–10,28]. Specifically, Punatar et al. [29] reported that cGVHD incidence was higher in male patients with female donors. In the present study, univariate and multivariate analyses revealed that patient age was significantly associated with aGVHD; patients with aGVHD were significantly younger. This may be due to the strict age limits applied in our study as opposed to general transplantation, which resulted in a young patient cohort with a mean age of 27.38±11.85 years. Furthermore, a greater proportion of male patients with male donors had cGVHD as compared to female patients with female donors.
In addition to HLA matching, the conditioning regimen, including myeloablative conditioning regimen (MAC) and the reduced-intensity conditioning regimen (RIC) [30–35], is an important factor dictating the success of HSCT. Although analysis from a large multicenter registry showed no differences in outcomes between RIC and MAC for those age <50 years, RIC was superior for adults >50 years [36]. RIC uses fludarabine and rabbit ATG to strengthen immune inhibition and lower the doses of cytotoxic drugs and steroids [37], thereby reducing tissue damage, inflammatory cytokine secretion, and, therefore, the incidence of aGVHD. In the current study, the same immunosuppression strategy (CSA plus short-MTX and mycophenolate mofetil) was used for GVHD prophylaxis in almost all cases. The only difference was that rabbit ATG was used in some cases to remove T lymphocytes in the grafts. Here, the absence of ATG prophylaxis was associated with aGVHD, which is consistent with a previous study of HSCT from Korea [38], in which the incidence of grade II–IV aGVHD was reduced from 41.9% to 25.0% with ATG. In addition, ATG may reduce the incidence of moderate-to-high-grade/severe aGVHD [39,40] as well as increase the 6-year OS [41]. ATG may also reduce the 5-year non-relapse mortality following bone marrow transplantation from unrelated donors (VIII) and III–IV aGVHD [41] when fludarabine is used in the conditioning regimen. Finally, ATG prophylaxis was associated with improved patient survival, especially in those with aGVHD levels I–II, in the present study.
In addition to aGVHD, ATG can reduce the incidence of cGVHD [26,37,42] as well as the occurrence of widespread cGVHD [41,43]. A cooperative study by multiple centers in Germany further showed that ATG can significantly reduce the incidence of cGVHD [44]. Although univariate analysis identified that ATG prophylaxis was associated with reduced incidence of cGVHD, multivariate analysis did not show this association, which may be due to lack of follow-up data. It is possible that this discrepancy is due to the fact that the majority of cases in this study used ATG to prevent aGVHD.
Previous studies have found that pretreatment regimens, including TBI, are advantageous in highly malignant diseases, especially in younger patients [40]. In patients with CML, TBI significantly reduced the incidence of cGVHD (30% vs. 65%); however, there is no significant difference in the incidence of aGVHD and OS [45]. In contrast, TBI was associated with incidence of aGVHD and cGVHD by univariate analysis in the present study, and it continued to be associated with incidence of cGVHD by multivariate analysis. Furthermore, although it appears to have a protective effect for OS (HR=0.78), it was not significant (p=0.306). These results are consistent with those of Cahu et al. [46] in which a pretreatment regimen, including TBI, increased the incidence of Grade II–IV aGVHD in T-ALL patients after 100 days, and the 5-year cumulative cGVHD (localized and general) also increased. TBI-containing pretreatment regimens also significantly improved OS and LFS in patients <35 years of age [46]. This is also similar to an analysis that included 2941 cases of allogeneic HSCT in which moderate-to-medium aGVHD was associated with using a conditioning regimen that included TBI, which may be related to TBI-mediated endothelial and epithelial cell injury. However, other studies have shown that TBI is safe in patients with unrelated donors [14]. Because Kornbilt et al. [47] showed that the addition of sirolimus to tacrolimus and mycophenolate mofetil was associated with reduced incidence of GVHD, selection of the conditioning regimen should consider patient age, type of illness, disease status, and organ function.
Some studies have shown that different types of disease diagnoses at transplantation may lead to differences in the incidences of post-transplant cGVHD. For example, aplastic anemia (AA) and chronic myeloid leukemia (CML) have been associated with higher incidences of cGVHD. In this study, cGVHD incidence was associated with diagnostic results; a greater proportion of patients with cGVHD were diagnosed with CML. In addition, aGVHD was found to be an important risk factor for cGVHD, indicating that patients with aGVHD had high possibility of developing cGVHD. Although Czerw et al. [44] showed that CD34+ cell content was associated with increased GVHD in an analysis of 203 adults, no such associations with either aGVHD or cGVHD were observed in the present study.
Studies have shown that HLA mismatches may have a significant impact on the incidence of GVHD without altering patient survival [48]. Similarly, with the exception of DR sites other than a full match or the DRB1 12: 02-12: 01 mismatch, HLA loci matching was not associated with OS in the present study. This is in agreement with previous studies that showed similar survival rates for patients undergoing matched related and unrelated, single-antigen mismatched unrelated, double cord blood [49,50], and haploidentical relative procedures [51]. Given the association of the natural killer cell immunoglobulin-like receptors with HLA class I ligands and patient survival and relapse [52], further studies will examine these haplotypes with GVHD occurrence in patients undergoing HSCT.
In the present study, patients with cGVHD after transplantation had a higher survival rate than patients without cGVHD. This is similar to that reported by Punatar et al. [29] in which the authors concluded that this observation may be due to lower relapse rates in the cGVHD group versus those without cGVHD (18% vs. 51%). Similarly, the cGVHD group had significantly lower relapse rates as compared to those without cGVHD in the present study (7.2% vs. 10.5%, respectively), which may account for the survival effects.
Conclusions
The degree of HLA matching, conditioning regimen, and ATG prophylaxis may affect the incidence of aGVHD and cGVHD. Thus, improvements in HLA matching, a non-TBI conditioning regimen, and the use of ATG prophylaxis will likely reduce the incidence of GVHD.
Supplementary Tables
Supplementary Table 1.
Sites of aGVHD and cGVHD.
| Site | aGVHD | cGVHD |
|---|---|---|
| Skin | 457 (25.1) | 181 (9.9) |
| GI tract | 133 (7.3) | – |
| Liver | 32 (1.8) | 39 (2.1) |
| Mouth | – | 17 (0.9) |
| Kidney | – | 1 (0.05) |
| Eye | – | 4 (0.2) |
| Lung | – | 5 (0.3) |
| Skin and GI tract | 104 (5.7) | – |
| Skin and Liver | 24 (1.3) | 40 (2.2) |
| Skin, Mouth | – | 1 (0.05) |
| Skin, Muscle | – | 1 (0.05) |
| Skin, Lung | – | 1 (0.05) |
| Mouth, Lung | – | 2 (0.1) |
| Mouth, Liver | – | 3 (0.15) |
| Liver and GI tract | 14 (0.8) | – |
| Skin, liver, and GI tract | 122 (6.7) | – |
| Mouth, Skin, Liver | – | 4 (0.2) |
| Mouth, Skin, Eye | – | 1 (0.05) |
| Mouth, Liver, Eye | – | 1 (0.05) |
| Mouth, Skin, Liver, Eye | – | 2 (0.1) |
| Undefined | 938 (51.4) | 1521 (83.39) |
Data were summarized as n (%).
Supplementary Table 2.
Summary of the estimated survival times (months) for a given disease diagnosis.
| Diagnosis disease | Disease status | Estimated mean survival time | 95% Confidence Interval of mean | Log-rank p-value | |
|---|---|---|---|---|---|
| Lower bound | Upper bound | ||||
| AML | I | 62.585 | 53.662 | 71.508 | <0.001 |
| II | 37.348 | 29.534 | 45.162 | ||
| III | 20.715 | 14.240 | 27.190 | ||
| Overall | 59.255 | 51.126 | 67.383 | ||
| ALL | I | 43.308 | 39.724 | 46.891 | 0.006 |
| II | 39.227 | 29.164 | 49.290 | ||
| III | 35.038 | 21.354 | 48.722 | ||
| Overall | 47.036 | 42.938 | 51.134 | ||
| CML | I | 63.428 | 57.332 | 69.524 | 0.002 |
| II | 49.280 | 34.974 | 63.587 | ||
| III | 26.065 | 15.074 | 37.056 | ||
| Overall | 60.911 | 55.404 | 66.417 | ||
| AA | I | .767 | .767 | .767 | n/a |
| Overall | .767 | .767 | .767 | ||
| MDS | I | 11.799 | 3.678 | 19.919 | 0.032 |
| II | 24.046 | 20.895 | 27.198 | ||
| Overall | 21.898 | 18.580 | 25.217 | ||
| NHL, HAL, MM, CMML, or CLL | I | 27.086 | 19.379 | 34.792 | 0.577 |
| II | 13.778 | 3.111 | 24.444 | ||
| III | 25.711 | 23.488 | 27.934 | ||
| Overall | 27.806 | 20.867 | 34.745 | ||
| others | I | 30.252 | 17.663 | 42.841 | 0.008 |
| III | 2.500 | 2.500 | 2.500 | ||
| Overall | 26.783 | 14.064 | 39.503 | ||
AML – acute myeloid leukemia; ALL – acute lymphoblastic leukemia; CML – chronic myeloid leukemia; AA – aplastic anemia; MDS – myelodysplastic syndrome; NHL – non-Hodgkin’s lymphomas; ALL (Ph+) – acute lymphoblastic leukemia (with Ph chromosome); HAL – hairy cell leukemia; MM – multiple myeloma; CMML – chronic myelomonocytic leukemia; CLL – chronic lymphoblastic leukemia; TBI – total body irradiation; ATG – anti-thymocyte globulin; MNCs – mononuclear cells.
Supplementary Table 3.
Multivariate Cox-regression analysis of the association of mismatches and clinical characteristics on aGVHD, cGVHD, and overall survival for given aGVHD level.
| Variables | aGVHD (I–II) patients only Model III (Overall survival) |
aGVHD (III–IV) patients only Model III (Overall survival) |
||
|---|---|---|---|---|
| HR (95%CI) | P-value | HR (95%CI) | P-value | |
| Matched site – A site (Donor–Patient) | ||||
| Fully matched | 1 | 1 | ||
| A0201-A0206 | 1.003 (0.214, 4.707) | 0.997 | 0.289 (0.023, 3.658) | 0.289 |
| A0201-A0207 | 6.756 (1.129, 40.425) | 0.036* | n/a | |
| A0206-A0201 | 1.470 (0.159, 13.604) | 0.734 | 0.776 (0.058, 10.414) | 0.848 |
| A0207-A0201 | 1.725 (0.200, 14.901) | 0.620 | 4.951 (0.233, 105.405) | 0.305 |
| A0207-A0206 | 0.503 (0.052, 4.833) | 0.552 | 0.219 (0.048, 1.010) | 0.052 |
| Others | 1.530 (0.382, 6.130) | 0.549 | n/a | |
| Donor age, y | 0.966 (0.910, 1.025) | 0.249 | 0.983 (0.885, 1.091) | 0.742 |
| Patient age, y | 0.994 (0.966, 1.023) | 0.689 | 1.054 (1.001, 1.109) | 0.046* |
| Sex (Donor–Patient) | ||||
| Male vs. Male | 0.685 (0.181, 2.590) | 0.577 | n/a | |
| Male vs. Female | 0.362 (0.079, 1.652) | 0.189 | n/a | |
| Female vs. Female | 1 | 1 | ||
| Female vs.. Male | 0.745 (0.157, 3.539) | 0.712 | n/a | |
| Conditioning regimens, TBI | ||||
| (+) | 0.824 (0.292, 2.331) | 0.716 | 0.390 (0.120, 1.313) | 0.130 |
| (−) | 1 | 1 | ||
| Pretreatment with ATG | ||||
| (+) | 0.391 (0.169, 0.904) | 0.028* | 0.712 (0.229, 2.211) | 0.557 |
| (−) | 1 | 1 | ||
| CD34+ cell dose | ||||
| <2×10⁶/Kg | 1 | 1 | ||
| ≥2×10⁶/Kg | 1.045 (0.304, 3.596) | 0.944 | 0.287 (0.038, 2.146) | 0.224 |
| Pre-transplant disease statusa | ||||
| Status I | 1 | 1 | ||
| Status II | 2.886 (1.130, 7.369) | 0.027* | 1.610 (1.160, 16.205) | 0.686 |
| Status III | 1.803 (0.602, 5.399) | 0.292 | 1.062 (0.299, 3.767) | 0.926 |
| cGVHD | ||||
| (+) | 0.192 (0.065, 0.572) | 0.003* | 0.193 (0.037, 1.007) | 0.051 |
| (−) | 1 | 1 | ||
| Relapse | ||||
| Yes | 12.642 (5.197, 30.756) | <0.001* | 16.428 (3.426, 78.776) | <0.001* |
| No | 1 | 1 | ||
Pre-transplant disease status included Status I: complete remission (first time) (CR1), chronic phase-phase one (CP1), and myelodysplastic syndrome (MDS), including refractory anemia (RA), refractory anemia with ring sideroblasts (RARS), refractory cytopenia with multilineage (RCMD), refractory cytopenia with multilineage dysplasia and ringed sideroblasts (RCMD-RS), and myelodysplastic syndrome-unclassified (MDS-U). Status II included complete remission (second time) (CR2), accelerated phase (AP), chronic phase-phase two (CP2), partial remission (PR), and MDS (RAEB-I and RAEB-II). Status III included no remission (NR), blastic crisis (BC), ≥CR3 (greater than or equal to three times that of complete remission), and MDS treatment-related acute myeloid leukemia (tAML).
TBI – total body irradiation; ATG – anti-thymocyte globulin; HR – hazard ratio; 95%CI – 95% confidence interval of HR.
Variables with significant association in univariate analysis were selected for the multivariate analysis.
Results were presented as HR with corresponding 95% CI and p-values through multivariate Cox-regression analysis.
p<0.05.
Acknowledgement
The authors acknowledge the efforts and help of CMDP (China Marrow Donor Program).
Footnotes
Source of support: Departmental sources
Conflict of interest
The authors declare they have no conflict of interest.
References
- 1.Bensinger WI, Martin PJ, Storer B, et al. Transplantation of bone marrow as compared with peripheral-blood cells from HLA-identical relatives in patients with hematologic cancers. N Engl J Med. 2001;344:175–81. doi: 10.1056/NEJM200101183440303. [DOI] [PubMed] [Google Scholar]
- 2.Lown RN, Shaw BE. Beating the odds: factors implicated in the speed and availability of unrelated haematopoietic cell donor provision. Bone Marrow Transplant. 2013;48:210–19. doi: 10.1038/bmt.2012.54. [DOI] [PubMed] [Google Scholar]
- 3.Bensinger WI. Allogeneic transplantation: peripheral blood vs. bone marrow. Curr Opin Oncol. 2012;24:191–96. doi: 10.1097/CCO.0b013e32834f5c27. [DOI] [PMC free article] [PubMed] [Google Scholar]
- 4.Tanaka J, Imamura M, Kasai M, et al. The important balance between cytokines derived from type 1 and 2 helper T Cell in the control of graft-versus-host disease. Bone Marrow Transplant. 1997;19:571–76. doi: 10.1038/sj.bmt.1700708. [DOI] [PubMed] [Google Scholar]
- 5.Ju XP, Xu B, Xiao ZP, et al. Cytokine expression during acute graft-versusu-host disease after allofeneic peripheral stem cell transplantation. Bone Marrow Transplant. 2005;35:1179–86. doi: 10.1038/sj.bmt.1704972. [DOI] [PubMed] [Google Scholar]
- 6.Shlomchik WD. Graft-versus-host disease. Nat Rev Immunol. 2007;7:340–52. doi: 10.1038/nri2000. [DOI] [PubMed] [Google Scholar]
- 7.Socié G, Ritz J. Current issues in chronic graft-versus-host disease. Blood. 2014;124:374–84. doi: 10.1182/blood-2014-01-514752. [DOI] [PMC free article] [PubMed] [Google Scholar]
- 8.Gale RP, Bortin MM, van Bekkum DW, et al. Risk factors for acute graft-versusu-host disease. Br J Haematol. 1987;67:397–406. doi: 10.1111/j.1365-2141.1987.tb06160.x. [DOI] [PubMed] [Google Scholar]
- 9.Hansen JA, et al. HLA and marrow transplantation. In: Lee I, editor. The HLA System, A New Approach. Vol. 59. New York: Springer-Verlag Press; 1990. [Google Scholar]
- 10.Nash RA, Pepe MS, Storb R, et al. Acute graft-versus-host-disease: analysis of risk factors after allogeneic marrow transplantation and prophylaxis with cyclosporine and methotrexate. Blood. 1992;80:1838–45. [PubMed] [Google Scholar]
- 11.Rowlings PA, Przepiorka D, Klein JP, et al. IBMTR severity index for grading acute graft-versus-host disease: retrospective comparison with Glucksberg grade. Br J Haematol. 1997;97:855–64. doi: 10.1046/j.1365-2141.1997.1112925.x. [DOI] [PubMed] [Google Scholar]
- 12.Dreger P, Haferlach T, Eckstein V, et al. G-CSF-mobilzed blood progenitor cells for allogeneic transplantation: Safety, kinetics of mobilization, and composition of the grafts. Br J Haematol. 1994;87:609–13. doi: 10.1111/j.1365-2141.1994.tb08321.x. [DOI] [PubMed] [Google Scholar]
- 13.Armitage S, Hargreaves R, Samson D, et al. CD34 counts to predict the adequate collection of peripheral blood progenitor cells. Marrow Transplant. 1997;20:587–91. doi: 10.1038/sj.bmt.1700938. [DOI] [PubMed] [Google Scholar]
- 14.Solomon SR, Sizemore CA, Sanacore M, et al. Total body irradiation-based myeloablative haploidentical stem cell transplantation is a safe and effective alternative to unrelated donor transplantation in patients without matched sibling donors. Biol Blood Marrow Transplant. 2015;21:1299–307. doi: 10.1016/j.bbmt.2015.03.003. [DOI] [PubMed] [Google Scholar]
- 15.Lee SJ, Klein J, Haagenson M, et al. High-resolution donor-recipient HLA matching contributes to the success of unrelated donor marrow transplantation. Blood. 2007;110:4576–83. doi: 10.1182/blood-2007-06-097386. [DOI] [PubMed] [Google Scholar]
- 16.Woolfrey A, Klein JP, Haagenson M, et al. HLA-C antigen mismatch is associated with worse outcome in unrelated donor peripheral blood stem cell transplantation. Biol Blood Marrow Transplant. 2011;17:885–92. doi: 10.1016/j.bbmt.2010.09.012. [DOI] [PMC free article] [PubMed] [Google Scholar]
- 17.Bray RA, Hurley CK, Kamani NR, et al. National marrow donor program HLA matching guidelines for unrelated adult donor hematopoietic cell transplants. Biol Blood Marrow Transplant. 2008;14:45–53. doi: 10.1016/j.bbmt.2008.06.014. [DOI] [PubMed] [Google Scholar]
- 18.Petersdorf EW, Anasetti C, Martin PJ, et al. Limits of HLA mismatching in unrelated hematopoietic cell transplantation. Blood. 2004;104:2976–80. doi: 10.1182/blood-2004-04-1674. [DOI] [PubMed] [Google Scholar]
- 19.Shaw BE, Gooley TA, Malkki M, et al. The importance of HLA-DPB1 in unrelated donor hematopoietic cell transplantation. Blood. 2007;110:4560–66. doi: 10.1182/blood-2007-06-095265. [DOI] [PubMed] [Google Scholar]
- 20.Verneris MR, Lee SJ, Ahn KW, et al. HLA mismatch is associated with worse outcomes after unrelated donor reduced-intensity conditioning hematopoietic cell transplantation: An analysis from the center for international blood and marrow transplant research. Biol Blood Marrow Transplant. 2015;21:1783–89. doi: 10.1016/j.bbmt.2015.05.028. [DOI] [PMC free article] [PubMed] [Google Scholar]
- 21.Flowers MED, Inamoto Y, Carpenter PA, et al. Comparative analysis of risk factors for acute graft-versus-host disease and for chronic graft-versus-host disease according to National Institutes of Health consensus criteria. Blood. 2011;117:3214–19. doi: 10.1182/blood-2010-08-302109. [DOI] [PMC free article] [PubMed] [Google Scholar]
- 22.Holtan SG, DeFor TE, Lazaryan A, et al. Composite end point of graft-versus-host disease-free, relapse-free survival after allogeneic hematopoietic cell transplantation. Blood. 2015;125:1333–38. doi: 10.1182/blood-2014-10-609032. [DOI] [PMC free article] [PubMed] [Google Scholar]
- 23.He J, Xu C, Wu XJ, et al. The impact of HLA high resolution typing mismatching of donor-recipient pairs on outcome of unrelated donor hematopoietic stem cell transplantation. Zhonghua Xue Ye Xue Za Zhi. 2012;33:353–57. [PubMed] [Google Scholar]
- 24.Morishima Y, Kashiwase K, Matsuo K, et al. Biological significance of HLA locus matching in unrelated donor bone marrow transplantation. Blood. 2015;125:1189–97. doi: 10.1182/blood-2014-10-604785. [DOI] [PMC free article] [PubMed] [Google Scholar]
- 25.Morishima Y, Kawase T, Malkki M, Petersdorf EW International Histocompatibility Working Group in Hematopoietic Cell Transplantation Component. Effect of HLA-A2 allele disparity on clinical outcome in hematopoietic cell transplantation from unrelated donors. Tissue Antigens. 2007;69:31–35. doi: 10.1111/j.1399-0039.2006.759_3.x. [DOI] [PubMed] [Google Scholar]
- 26.Kawase T, Morishima Y, Matsuo K, et al. High-risk HLA allele mismatch combinations responsible for severe acute graft-vesus-host disease and implication for its molecular mechanism. Blood. 2007;110:2235–41. doi: 10.1182/blood-2007-02-072405. [DOI] [PubMed] [Google Scholar]
- 27.Anasetti C. Use of alternative donors for allogeneic stem cell transplantation. Hematology Am Soc Hematol Educ Program. 2015;2015:220–24. doi: 10.1182/asheducation-2015.1.220. [DOI] [PubMed] [Google Scholar]
- 28.Kollman C, Howe CW, Anasetti C, et al. Donor characteristics as risk factors in recipients after transplantation of bone marrow from unrelated doner: The effect of donor age. Blood. 2001;98:2043–51. doi: 10.1182/blood.v98.7.2043. [DOI] [PubMed] [Google Scholar]
- 29.Punatar S, Gupta A, Gawande J, et al. Chronic graft versus host disease in acute leukemia patients undergoing allogeneic hematopoietic stem cell transplant: Analysis of risk factors, pattern and long term outcome. Indian J Hematol Blood Transfus. 2016;32:32–38. doi: 10.1007/s12288-015-0506-5. [DOI] [PMC free article] [PubMed] [Google Scholar]
- 30.Schmid C, Schleuning M, Ledderose G, et al. Sequential regimen of chemotherapy, reduced-intensity conditioning for allogeneic stem-cell transplantation, and prophylactic donor lymphocyte transfusion in high-risk acute myeloid leukemia and myelodysplastic syndrome. J Clin Oncol. 2005;23:5675–87. doi: 10.1200/JCO.2005.07.061. [DOI] [PubMed] [Google Scholar]
- 31.Schmid C, Schleuning M, Schwerdtfeger R, et al. Long-term survival in refractory acute myeloid leukemia after sequential treatment with chemotherapy and reduced-intensity conditioning for allogeneic stem cell transplantation. Blood. 2006;108:1092–99. doi: 10.1182/blood-2005-10-4165. [DOI] [PubMed] [Google Scholar]
- 32.de Lima M, Couriel D, Thall PF, et al. Once-daily intravenous busulfan and fludarabine: clinical and pharmacokinetic results of a myeloablative, reduced-toxicity conditioning regimen for allogeneic stem cell transplantation in AML and MDS. Blood. 2004;104:857–64. doi: 10.1182/blood-2004-02-0414. [DOI] [PubMed] [Google Scholar]
- 33.de Lavallade H, Faucher C, Furst S, et al. Allogeneic stem cell transplantation after reduced-intensity conditioning in a patient with T-cell prolymphocytic leukemia: Graft-versus-tumor effect and long-term remission. Bone Marrow Transplantation. 2006;37:709–10. doi: 10.1038/sj.bmt.1705294. [DOI] [PubMed] [Google Scholar]
- 34.Grigg AP, Gibson J, Bardy PG, et al. A prospective multicenter trial of peripheral blood stem cell sibling allografts for acute myeloid leukemia in first complete remission using fludarabine-cyclophosphamide reduced intensity conditioning. Biol Blood Marrow Transplant. 2007;13:560–67. doi: 10.1016/j.bbmt.2006.12.449. [DOI] [PubMed] [Google Scholar]
- 35.Craddock CF. Full-intensity and reduced-intensity allogeneic stem cell transplantation in AML. Bone Marrow Transplantation. 2008;41:415–23. doi: 10.1038/sj.bmt.1705975. [DOI] [PubMed] [Google Scholar]
- 36.Savani BN, Labopin M, Kröger N, et al. Expanding transplant options to patients over 50 years-Improved outcome after reduced intensity conditioning mismatched-unrelated donor transplantation for patients with acute myeloid leukemia: A report from the Acute Leukemia Working Party of the EBMT. Haematologica. 2016;101(6):773–80. doi: 10.3324/haematol.2015.138180. [DOI] [PMC free article] [PubMed] [Google Scholar]
- 37.Walker I, Panzarella T, Couban S, et al. Pretreatment with anti-thymocyte globulin versus no anti-thymocyte globulin in patients with haematological malignancies undergoing haemopoietic cell transplantation from unrelated donors: A randomised, controlled, open-label, phase 3, multicentre trial. Lancet Oncol. 2016;17:164–73. doi: 10.1016/S1470-2045(15)00462-3. [DOI] [PubMed] [Google Scholar]
- 38.Kim HJ, Kim SY, Lee MH, Min WS. Peripheral blood stem cell transplantation from human leukocyte antigen-matched sibling donors and unrelated donors in acute myeloid leukemia patients. Acta Haematol. 2013;130:206–16. doi: 10.1159/000350481. [DOI] [PubMed] [Google Scholar]
- 39.Pidala J, Tomblyn M, Nishihori T, et al. ATG prevents severe acute graft-versus-host disease in mismatched unrelated donor hematopoietic cell transplantation. Biol Blood Marrow Transplant. 2011;17:1237–44. doi: 10.1016/j.bbmt.2010.12.705. [DOI] [PMC free article] [PubMed] [Google Scholar]
- 40.Kim HJ, Min WS, Cho BS, et al. Successful prevention of acute graft-versus-host disease using low-dose antithymocyte globulin after mismatched, unrelated, hematopoietic stem cell transplantation for acute myelogenous leukemia. Biol Blood Marrow Transplant. 2009;15:704–17. doi: 10.1016/j.bbmt.2009.02.010. [DOI] [PubMed] [Google Scholar]
- 41.Mohty M, Labopin M, Balère ML, et al. Antithymocyte globulins and chronic graft-vs-host disease after myeloablative allogeneic stem cell transplantation from HLA-matched unrelated donors: A report from the Sociéte Française de Greffe de Moelle et de Thérapie Cellulaire. Leukemia. 2010;24:1867–74. doi: 10.1038/leu.2010.200. [DOI] [PubMed] [Google Scholar]
- 42.Bacigalupo A, Lamparelli T, Barisione G, et al. Thymoglobulin prevents chronic graft-versus-host disease, chronic lung dysfunction, and late transplant-related mortality: Long-term follow-up of a randomized trial in patients undergoing unrelated donor transplantation. Biol Blood Marrow Transplant. 2006;12:560–65. doi: 10.1016/j.bbmt.2005.12.034. [DOI] [PubMed] [Google Scholar]
- 43.Basara N, Baurmann H, Kolbe K, et al. Antithymocyte globulin for the prevention of graft-versus-host disease after unrelated hematopoietic stem cell transplantation for acute myeloid leukemia: Results from the multicenter German cooperative study group. Bone Marrow Transplant. 2005;35:1011–18. doi: 10.1038/sj.bmt.1704957. [DOI] [PubMed] [Google Scholar]
- 44.Czerw T, Labopin M, Schmid C, et al. High CD3+ and CD34+ peripheral blood stem cell grafts content is associated with increased risk of graft-versus-host disease without beneficial effect on disease control after reduced-intensity conditioning allogeneic transplantation from matched unrelated donors for acute myeloid leukemia – an analysis from the Acute Leukemia Working Party of the European Society for Blood and Marrow Transplantation. Oncotarget. 2016;7(19):27255–66. doi: 10.18632/oncotarget.8463. [DOI] [PMC free article] [PubMed] [Google Scholar]
- 45.Gupta T, Kannan S, Dantkale V, Laskar S. Cyclophosphamide plus total body irradiation compared with busulfan plus cyclophosphamide as a conditioning regimen prior to hematopoietic stem cell transplantation in patients with leukemia: A systematic review and meta-analysis. Hematol Oncol Stem Cell Ther. 2011;4:17–29. doi: 10.5144/1658-3876.2011.17. [DOI] [PubMed] [Google Scholar]
- 46.Cahu X, Labopin M, Giebel S, et al. Impact of conditioning with TBI in adult patients with T-cell ALL who receive a myeloablative allogeneic stem cell transplantation: A report from the acute leukemia working party of EBMT. Bone Marrow Transplant. 2016;51:351–57. doi: 10.1038/bmt.2015.278. [DOI] [PubMed] [Google Scholar]
- 47.Kornblit B, Maloney DG, Storer BE, et al. A randomized phase II trial of tacrolimus, mycophenolate mofetil and sirolimus after non-myeloablative unrelated donor transplantation. Haematologica. 2014;99:1624–31. doi: 10.3324/haematol.2014.108340. [DOI] [PMC free article] [PubMed] [Google Scholar]
- 48.Gagne K, Loiseau P, Dubois V, et al. Is there any impact of HLA-DPB1 disparity in 10/10 HLA-matched unrelated hematopoietic SCT? Results of a French multicentric retrospective study. Bone Marrow Transplant. 2015;50:232–36. doi: 10.1038/bmt.2014.253. [DOI] [PubMed] [Google Scholar]
- 49.Appelbaum FR. Alternative donor transplantation for adults with acute leukemia. Best Pract Res Clin Haematol. 2014;27:272–77. doi: 10.1016/j.beha.2014.10.009. [DOI] [PubMed] [Google Scholar]
- 50.Granier C, Biard L, Masson E, et al. Impact of the source of hematopoietic stem cell in unrelated transplants: Comparison between 10/10, 9/10-HLA matched donors and cord blood. Am J Hematol. 2015;90:897–903. doi: 10.1002/ajh.24112. [DOI] [PubMed] [Google Scholar]
- 51.Eapen M, O’Donnell P, Brunstein CG, et al. Mismatched related and unrelated donors for allogeneic hematopoietic cell transplantation for adults with hematologic malignancies. Biol Blood Marrow Transplant. 2014;20:1485–92. doi: 10.1016/j.bbmt.2014.05.015. [DOI] [PMC free article] [PubMed] [Google Scholar]
- 52.Cooley S, Weisdorf DJ, Guethlein LA, et al. Donor killer cell Ig-like receptor B haplotypes, recipient HLA-C1, and HLA-C mismatch enhance the clinical benefit of unrelated transplantation for acute myelogenous leukemia. J Immunol. 2014;192:4592–600. doi: 10.4049/jimmunol.1302517. [DOI] [PMC free article] [PubMed] [Google Scholar]
Associated Data
This section collects any data citations, data availability statements, or supplementary materials included in this article.
Supplementary Materials
Supplementary Table 1.
Sites of aGVHD and cGVHD.
| Site | aGVHD | cGVHD |
|---|---|---|
| Skin | 457 (25.1) | 181 (9.9) |
| GI tract | 133 (7.3) | – |
| Liver | 32 (1.8) | 39 (2.1) |
| Mouth | – | 17 (0.9) |
| Kidney | – | 1 (0.05) |
| Eye | – | 4 (0.2) |
| Lung | – | 5 (0.3) |
| Skin and GI tract | 104 (5.7) | – |
| Skin and Liver | 24 (1.3) | 40 (2.2) |
| Skin, Mouth | – | 1 (0.05) |
| Skin, Muscle | – | 1 (0.05) |
| Skin, Lung | – | 1 (0.05) |
| Mouth, Lung | – | 2 (0.1) |
| Mouth, Liver | – | 3 (0.15) |
| Liver and GI tract | 14 (0.8) | – |
| Skin, liver, and GI tract | 122 (6.7) | – |
| Mouth, Skin, Liver | – | 4 (0.2) |
| Mouth, Skin, Eye | – | 1 (0.05) |
| Mouth, Liver, Eye | – | 1 (0.05) |
| Mouth, Skin, Liver, Eye | – | 2 (0.1) |
| Undefined | 938 (51.4) | 1521 (83.39) |
Data were summarized as n (%).
Supplementary Table 2.
Summary of the estimated survival times (months) for a given disease diagnosis.
| Diagnosis disease | Disease status | Estimated mean survival time | 95% Confidence Interval of mean | Log-rank p-value | |
|---|---|---|---|---|---|
| Lower bound | Upper bound | ||||
| AML | I | 62.585 | 53.662 | 71.508 | <0.001 |
| II | 37.348 | 29.534 | 45.162 | ||
| III | 20.715 | 14.240 | 27.190 | ||
| Overall | 59.255 | 51.126 | 67.383 | ||
| ALL | I | 43.308 | 39.724 | 46.891 | 0.006 |
| II | 39.227 | 29.164 | 49.290 | ||
| III | 35.038 | 21.354 | 48.722 | ||
| Overall | 47.036 | 42.938 | 51.134 | ||
| CML | I | 63.428 | 57.332 | 69.524 | 0.002 |
| II | 49.280 | 34.974 | 63.587 | ||
| III | 26.065 | 15.074 | 37.056 | ||
| Overall | 60.911 | 55.404 | 66.417 | ||
| AA | I | .767 | .767 | .767 | n/a |
| Overall | .767 | .767 | .767 | ||
| MDS | I | 11.799 | 3.678 | 19.919 | 0.032 |
| II | 24.046 | 20.895 | 27.198 | ||
| Overall | 21.898 | 18.580 | 25.217 | ||
| NHL, HAL, MM, CMML, or CLL | I | 27.086 | 19.379 | 34.792 | 0.577 |
| II | 13.778 | 3.111 | 24.444 | ||
| III | 25.711 | 23.488 | 27.934 | ||
| Overall | 27.806 | 20.867 | 34.745 | ||
| others | I | 30.252 | 17.663 | 42.841 | 0.008 |
| III | 2.500 | 2.500 | 2.500 | ||
| Overall | 26.783 | 14.064 | 39.503 | ||
AML – acute myeloid leukemia; ALL – acute lymphoblastic leukemia; CML – chronic myeloid leukemia; AA – aplastic anemia; MDS – myelodysplastic syndrome; NHL – non-Hodgkin’s lymphomas; ALL (Ph+) – acute lymphoblastic leukemia (with Ph chromosome); HAL – hairy cell leukemia; MM – multiple myeloma; CMML – chronic myelomonocytic leukemia; CLL – chronic lymphoblastic leukemia; TBI – total body irradiation; ATG – anti-thymocyte globulin; MNCs – mononuclear cells.
Supplementary Table 3.
Multivariate Cox-regression analysis of the association of mismatches and clinical characteristics on aGVHD, cGVHD, and overall survival for given aGVHD level.
| Variables | aGVHD (I–II) patients only Model III (Overall survival) |
aGVHD (III–IV) patients only Model III (Overall survival) |
||
|---|---|---|---|---|
| HR (95%CI) | P-value | HR (95%CI) | P-value | |
| Matched site – A site (Donor–Patient) | ||||
| Fully matched | 1 | 1 | ||
| A0201-A0206 | 1.003 (0.214, 4.707) | 0.997 | 0.289 (0.023, 3.658) | 0.289 |
| A0201-A0207 | 6.756 (1.129, 40.425) | 0.036* | n/a | |
| A0206-A0201 | 1.470 (0.159, 13.604) | 0.734 | 0.776 (0.058, 10.414) | 0.848 |
| A0207-A0201 | 1.725 (0.200, 14.901) | 0.620 | 4.951 (0.233, 105.405) | 0.305 |
| A0207-A0206 | 0.503 (0.052, 4.833) | 0.552 | 0.219 (0.048, 1.010) | 0.052 |
| Others | 1.530 (0.382, 6.130) | 0.549 | n/a | |
| Donor age, y | 0.966 (0.910, 1.025) | 0.249 | 0.983 (0.885, 1.091) | 0.742 |
| Patient age, y | 0.994 (0.966, 1.023) | 0.689 | 1.054 (1.001, 1.109) | 0.046* |
| Sex (Donor–Patient) | ||||
| Male vs. Male | 0.685 (0.181, 2.590) | 0.577 | n/a | |
| Male vs. Female | 0.362 (0.079, 1.652) | 0.189 | n/a | |
| Female vs. Female | 1 | 1 | ||
| Female vs.. Male | 0.745 (0.157, 3.539) | 0.712 | n/a | |
| Conditioning regimens, TBI | ||||
| (+) | 0.824 (0.292, 2.331) | 0.716 | 0.390 (0.120, 1.313) | 0.130 |
| (−) | 1 | 1 | ||
| Pretreatment with ATG | ||||
| (+) | 0.391 (0.169, 0.904) | 0.028* | 0.712 (0.229, 2.211) | 0.557 |
| (−) | 1 | 1 | ||
| CD34+ cell dose | ||||
| <2×10⁶/Kg | 1 | 1 | ||
| ≥2×10⁶/Kg | 1.045 (0.304, 3.596) | 0.944 | 0.287 (0.038, 2.146) | 0.224 |
| Pre-transplant disease statusa | ||||
| Status I | 1 | 1 | ||
| Status II | 2.886 (1.130, 7.369) | 0.027* | 1.610 (1.160, 16.205) | 0.686 |
| Status III | 1.803 (0.602, 5.399) | 0.292 | 1.062 (0.299, 3.767) | 0.926 |
| cGVHD | ||||
| (+) | 0.192 (0.065, 0.572) | 0.003* | 0.193 (0.037, 1.007) | 0.051 |
| (−) | 1 | 1 | ||
| Relapse | ||||
| Yes | 12.642 (5.197, 30.756) | <0.001* | 16.428 (3.426, 78.776) | <0.001* |
| No | 1 | 1 | ||
Pre-transplant disease status included Status I: complete remission (first time) (CR1), chronic phase-phase one (CP1), and myelodysplastic syndrome (MDS), including refractory anemia (RA), refractory anemia with ring sideroblasts (RARS), refractory cytopenia with multilineage (RCMD), refractory cytopenia with multilineage dysplasia and ringed sideroblasts (RCMD-RS), and myelodysplastic syndrome-unclassified (MDS-U). Status II included complete remission (second time) (CR2), accelerated phase (AP), chronic phase-phase two (CP2), partial remission (PR), and MDS (RAEB-I and RAEB-II). Status III included no remission (NR), blastic crisis (BC), ≥CR3 (greater than or equal to three times that of complete remission), and MDS treatment-related acute myeloid leukemia (tAML).
TBI – total body irradiation; ATG – anti-thymocyte globulin; HR – hazard ratio; 95%CI – 95% confidence interval of HR.
Variables with significant association in univariate analysis were selected for the multivariate analysis.
Results were presented as HR with corresponding 95% CI and p-values through multivariate Cox-regression analysis.
p<0.05.