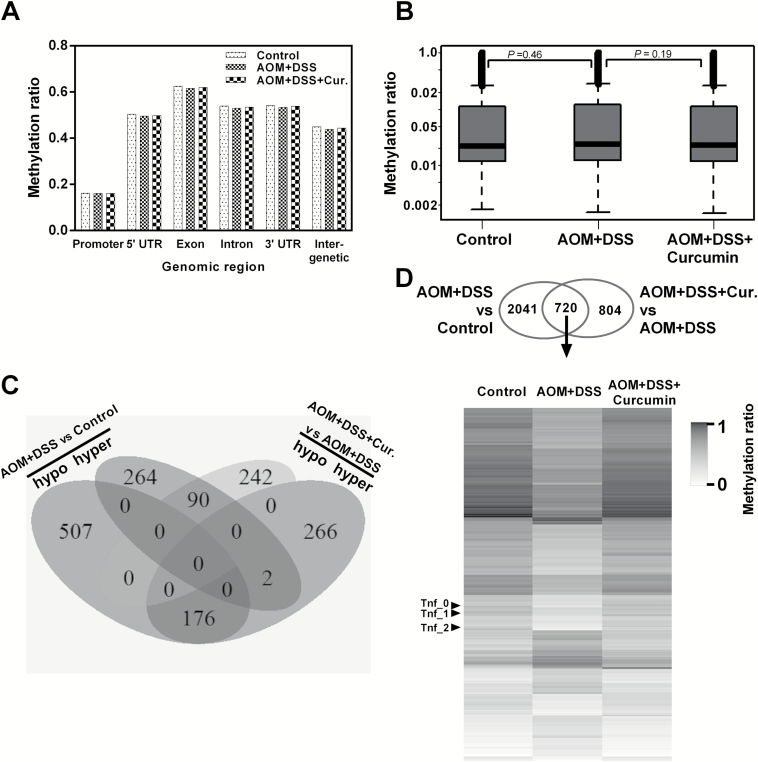
Figure 3.
Overview of DNA methylation level changes. (A) Methylation level of gene substructures in control, AOM+DSS and AOM+DSS+Curcumin groups. (B) Box plots showing the distribution of DMRs in control, AOM+DSS and AOM+DSS+Curcumin groups. Only DMRs with >12 CpG sites were included in this analysis to ensure comparability and analytical robustness. Differences between groups were not significant. P-values, Mann–Whitney. (C) Venn diagram showing the number of DMRs within promoter regions in the comparisons of control versus AOM+DSS and AOM+DSS versus AOM+DSS+Curcumin. (D) Venn diagram showing the number of DMRs in all genomic locations except distal intergenic regions, in the comparisons of control versus AOM+DSS and AOM+DSS versus AOM+DSS+Curcumin. Methylation ratio of DMRs from both comparisons is shown in heatmap for all three groups.

