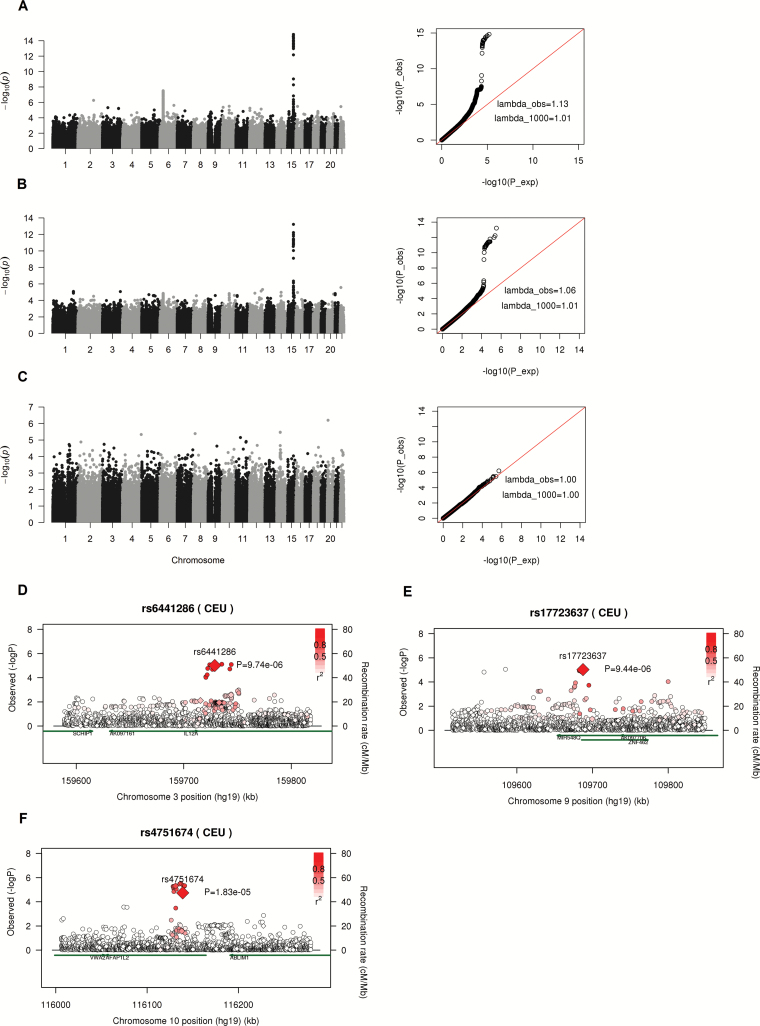
Figure 1.
(A–C) Manhattan plot (left) and Q–Q plot (right) of P-values from case-only genome-wide interaction analysis (step 1) in NSCLC, adenocarcinoma and SQC patients using discovery data. lambda_obs and lambda_1000 indicate genomic inflation factor from observed data and from an equivalent study of 1000 cases, respectively. λ_1000=1+(λ_obs-1)×(1/n_cases)/(1/1000). (D–F) Regional association plot around three significant SNPs validated in replication study using imputed SNPs from Oncoarray data. Diamonds and circles denote genotyped and imputed SNPs. Since the genotype data for imputation analysis went through additional QC procedures so the final sample size was a little smaller than that in genotype analysis. There were 12624 controls and 12979 NSCLC cases in imputed data analysis. So the signals at the genotyped SNPs (indicated by diamond) were a little bit different from that at genome-wide interaction analysis in discovery stage as shown in Table 2.

