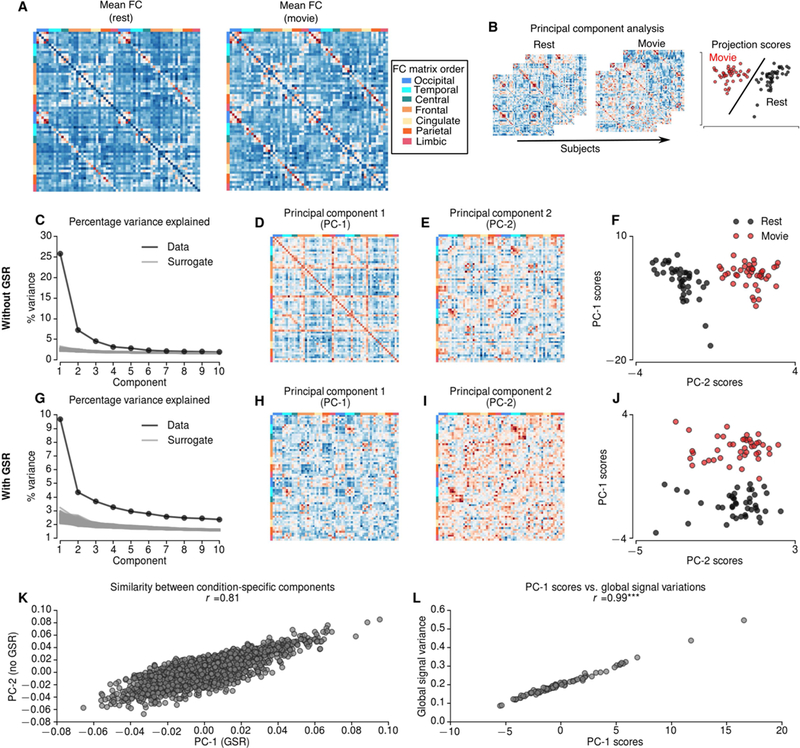
Figure 1.

A Mean functional connectivity (FC) during resting-state and movie-watching conditions. B Schematic describing principal component analysis (PCA) over FCs of 2 resting-state and 2 movie-watching condition concatenated across 21 subjects. C-F PCA results without global signal regression (GSR). Explained variance by each PC (black) and random surrogates (gray) without GSR (C). Compared to 1000 random surrogates the dimensionality of FCs without GSR was 13. The first PC (D) explains 25.8% of the variation, whereas second PC (E) explains 7.2% of the variation. The projections of first two PCs shows that the second component is specific to movie runs (F). The first PC of the FCs without GSR reflects global signal standard deviation (L). G-J PCA results with global signal regression (GSR). G Explained variance by each PC (black) and random surrogates (gray) with GSR. Compared to random surrogates the dimensionality of FCs with GSR is 22. The first PC, which is specific to movie runs explains 9.69% of the variation (J). K The similarity between condition-specific components with and without GSR. *** indicates p<0.0001.
