

Combining in silico and in vitro systems reveals a mechanical feedback regulation of 3D tissue formation during organogenesis.
Abstract
Organogenesis is a self-organizing process of multiple cells in three-dimensional (3D) space, where macroscopic tissue deformations are robustly regulated by multicellular autonomy. It is clear that this robust regulation requires cells to sense and modulate 3D tissue formation across different scales, but its underlying mechanisms are still unclear. To address this question, we developed a versatile computational model of 3D multicellular dynamics at single-cell resolution and combined it with the 3D culture system of pluripotent stem cell–derived optic-cup organoid. The complementary approach enabled quantitative prediction of morphogenesis and its corresponding verification and elucidated that the macroscopic 3D tissue deformation is fed back to individual cellular force generations via mechanosensing. We hereby conclude that mechanical force plays a key role as a feedback regulator to establish the robustness of organogenesis.
INTRODUCTION
During organogenesis, morphogens dynamically organize spatial patterns of cell differentiation in three-dimensional (3D) tissues (1, 2). According to the pattern, individual cells generate characteristic mechanical forces to form the entire organ structure in 3D space (3–5). Many molecules have been identified as key signaling factors that regulate each step of patterning and force generation. However, these molecular signals are not enough to explain the entire regulatory mechanism of morphogenesis. In particular, it is still unclear how individual cells sense and modulate the entire 3D tissue formation across different scales. Previous studies have revealed cellular mechanosensing mechanisms (6–8), which may also be involved in the cross-scale regulatory mechanism of 3D tissue formation. Therefore, in this study, we focus on the mechanical aspect of morphogenesis and reveal the role of mechanical force in regulating 3D tissue formation across different scales.
Recent progress in the stem cell field has enabled us to form various 3D tissues in vitro (9, 10). For instance, we have reported a culture system of pluripotent stem cell–derived optic-cup organoids, which well recapitulates a typical process seen in vivo (11, 12); on the basis of the Wnt antagonism, the distal part of optic vesicle (OV) differentiates into neural retina (NR), whereas the adjacent part becomes retinal pigment epithelium (RPE). According to the differentiation pattern, the NR invaginates into the surrounding RPE in the apically convex direction. Subsequently, a hinge structure is formed along the boundary between the inner NR and outer RPE to generate a cup-like tissue shape. From a mechanical point of view, this stepwise process proceeds autonomously without external forces from the surroundings such as lens placode and periocular mesenchyme.
To explain this self-organizing process, we have previously found several key candidates of driving force and suggested a relaxation-expansion model (11) that explains the mechanism of optic-cup formation through four sequential phases (fig. S1A). In phase 1, semispherical OV autonomously generates the differentiation pattern composed of distal NR and the surrounding RPE. In phase 2, the distal NR decreases its stiffness according to the reduction of apical myosin accumulation. In phase 3, the boundary between NR and RPE causes apical constriction, by which the NR is passively invaginated. In phase 4, the NR causes rapid proliferation and facilitates the NR invagination by itself. Although this model is consistent with previous experimental findings, our further mechanical analyses have prompted the investigation of more elaborate mechanisms.
In the present study, we elucidate a mechanical force that is fed back from macroscopic 3D tissue deformation to individual cellular force generation during optic-cup morphogenesis. On the basis of previous mathematical models (13–19), we developed a versatile 3D vertex model that adequately describes general 3D multicellular dynamics at single-cell resolution. The in vitro culture of optic-cup formation enables us to observe and perturb specific cell behaviors in 3D living tissues, whereas the in silico recapitulation enables us to predict its mechanisms comprehensively (15, 16, 20, 21). By combining the in vitro and in silico approaches, we found key cell behaviors required for the NR invagination and the subsequent hinge formation along the NR-RPE boundary and elucidate the key role of mechanical force in the self-organizing optic-cup formation.
RESULTS
Quantitative simulations predict key mechanisms in optic-cup morphogenesis
To elucidate mechanisms of 3D tissue morphogenesis, we attempted to combine in vitro and in silico systems. The optic-cup formation is a complex 3D deformation process to form several characteristic structures such as the apically convex, thicker NR, the adjacent, thinner RPE, and the sharply wedged hinge structure at the NR-RPE boundary (Fig. 1, A to D). The optic-cup formation follows various single-cell behaviors in 3D space, such as cellular contraction, extension, stiffening, softening, adhesion, growth, rearrangement, division, and apoptosis (11). In particular, cells at the NR-RPE boundary form an anisotropic hinge shape (Fig. 1E and movie S1). These cell behaviors dynamically change according to the differentiation state of individual cells from OV to NR and RPE in a dorsoventrally asymmetric manner (2, 12, 22).
Fig. 1. Quantitative simulations of 3D multicellular dynamics during optic-cup morphogenesis.
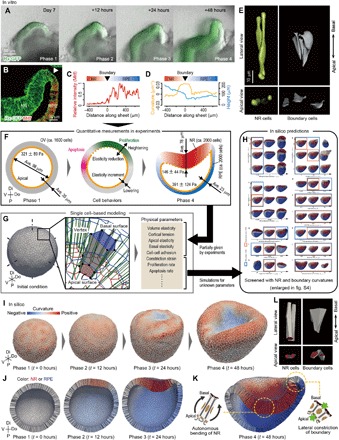
(A) Time-lapse imaging of in vitro optic-cup formation. (B) Immunostaining assay of the in vitro optic cup. (C and D) Spatial pattern of Mitf intensity and the curvature and thickness of epithelium along the epithelial sheet in (B). (E) Shape of in vitro single cell at NR and the NR-RPE boundary in day 9 (also shown in movie S1). (F) Quantities of cell behaviors obtained from experiments [morphologies were measured as shown in fig. S2; epithelial thickness and surface stiffness were partly obtained from our previous study (11)]. (G) Geometric structures of OV and cells on the 3D vertex model (described in fig. S3). The model involves several physical parameters, a part of which are given by experiments in (F), and the other unknown parameters are entirely varied in computational simulations. (H) Phase diagram resulting from computational simulations for all of the unknown physical parameters (enlarged in fig. S4). Several phenotypes in the phase diagram are verified to correspond to those resulting from pharmacological assays in experiments (fig. S5; in silico phenotypes also shown in movie S3). (I to K) Outer and cross-sectional views of the recapitulated optic-cup formation steps (movies S2 and S3). For this recapitulation, two key factors are required: the autonomous bending of NR in the apically convex direction and the constriction of the NR-RPE boundary along the apicobasal (lateral) direction (K). (L) Shape of in silico single cell at NR and the NR-RPE boundary, where apical surfaces are colored red. Tissue morphologies are shown in 3D coordinates with the distal-proximal (Di-P), dorsal-ventral (Do-V), and anterior-posterior axis in (G) and (I) and are projected on the plane normal to the anterior-posterior plane in (F), (J), and (K).
To understand the mechanisms of this morphogenesis, we developed a versatile 3D vertex model that describes 3D multicellular dynamics, involving all of the abovementioned single-cell behaviors (fig. S2). By approximating individual cell shapes to polyhedrons, this model can express the entire pattern of 3D compacted multicellular dynamics at a single-cell resolution in a physically and mathematically consistent manner (18, 23). Thereby, this model enables us to predict 3D tissue deformation based on physical interactions among cells.
Using the developed 3D vertex model, we performed computational simulations based on experimental data. First, we developed a mechanical model of single-cell behaviors in 3D space that involves several physical parameters of individual cells such as spontaneous volume/height/curvature, apical/basal surface stiffness, and proliferation/apoptosis rate, which dynamically change during the optic-cup formation (Fig. 1G). Second, we had measured some of the physical parameters experimentally (Fig. 1F and fig. S3) and introduced them into this model. Last, we carried out computational simulations for all of the other unsettled parameters by assuming a quasi-static deformation process and predicted effects of individual single-cell behaviors on the optic-cup formation (Fig. 1H, enlarged in fig. S4). The computational simulations succeeded in recapitulating the 3D deformation process of the optic-cup formation at the single-cell level (Fig. 1, I to K, and movies S2 and S3), which included the apically convex NR and the sharply wedged hinge structure along the NR-RPE boundary as well as the cell morphologies in columnar NR cells, cuboidal RPE cells, and hinge boundary cells (Fig. 1L), respectively.
The computational simulations also produced a variety of phenotypes with respect to a set of parameters (fig. S4 and movie S4). This is noteworthy since the importance of retinal differentiation and cell proliferation in optic-cup formation has been pointed out in previous studies (11, 24). The phenotypes with respect to these cell behaviors are consistent with our previous in vitro experiments (11) and were also verified via ex vivo inhibitor assays (fig. S5): (i) The simulations predicted that the NR invagination requires the proper proportion of NR to RPE regions (fig. S5, B and C), which corresponds to the dependence of the penetrance of cup formation on tissue sizes (24) and the phenotypes given under the Wnt inhibitor IWP2 (fig. S5, F and I) and the Wnt activators CHIR and BIO (fig. S5, G and I). Here, an overlarge proportion of the NR region (fig. S5B) prevented the invagination by increasing the energy gap to revert the NR curvature from the apically concave to convex, while an excessively small proportion of the NR region (fig. S5C) prevented the NR invagination by reducing the total amount of cell proliferation. (ii) The simulations predicted that frequent cell proliferation around the NR, observed in fig. S3, plays a key role in generating a driving force for the NR invagination (fig. S5D), which corresponds to the phenotype given by aphidicolin-induced cell cycle arrest (fig. S5, H and I). Here, the role of the cell proliferation is to generate pushing forces on the surrounding tissues, leading to a mechanical instability that buckle the NR to either the apically convex or concave direction.
By screening the resulting in silico tissues with the magnitude of local tissue curvatures around NR and the NR-RPE boundary, we narrowed down the parameters that provide the proper optic-cup shape (Fig. 1H, enlarged in fig. S4). This screening predicted two key mechanisms that have not been previously mentioned and are novel to the best of our knowledge (Fig. 1K): (i) The apically convex NR invagination is autonomously driven by the force generations of NR cells themselves, and (ii) the NR invagination is facilitated by the force generations of NR-RPE boundary cells that actively constrict along the apicobasal (lateral) direction. Further, we attempted to verify each of these predictions experimentally.
Apical actomyosin reduction causes autonomous epithelial bending in the apically convex direction
Previously, we had suggested that the apically convex NR invagination is driven by the bending force generated at the NR-RPE boundary (fig. S1A) (11, 25). However, in contrast, the present in silico screening suggests that NR would autonomously bend owing to the inversion of its spontaneous curvature (Fig. 2, A and B; figs. S4A and 6A; and movie S5). It is well known that the increase in actomyosin accumulation on the apical surface causes apical constriction and bends epithelial sheet in the apically concave direction (fig. S1C) (3–5, 17, 21). By reversing this concept, it could be possible that the reduction of actomyosin accumulation on the apical surface relaxes the apical contractility and bends the epithelial sheet in the apically convex direction (Fig. 2A and fig. S1D).
Fig. 2. Autonomous epithelial bending in apically convex direction due to apical actomyosin reduction.
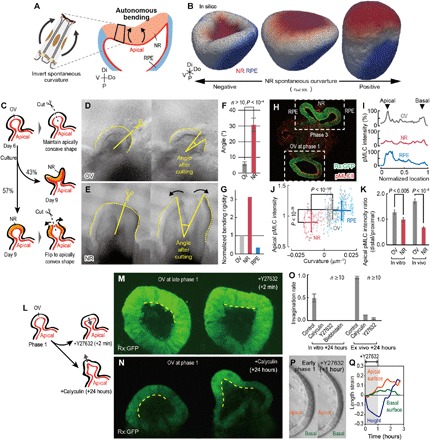
(A) The NR autonomous bending in the apically convex direction driven by the inversion of NR spontaneous curvature. (B) In silico screening assay of optic-cup formation with respect to the NR spontaneous curvature (fig. S6A and movie S5). Tissue morphologies are shown in the 3D coordinates with the distal-proximal, dorsal-ventral, and anterior-posterior axis. (C to F) Mechanical assays of spherical OV at day 6 (D) and spherical NR at day 9 (E). The angle displacements by incising (F). (G) Normalized bending rigidities of OV, NR, and RPE estimated from their apical elasticities and cell heights. (H) Immunostaining assay of pMLC in vitro. (I) pMLC distributions along the apicobasal (lateral) axis in (H). (J) Correlation between local pMLC intensity and curvature in epithelium shown in (H). (K) pMLC intensity on the apical side in the distal area, normalized by those in the proximal area, in vitro and in vivo. (L to N) Inhibitor assays of in vitro OV. (M) Inhibitor assay of in vitro OV with ROCK inhibitor, Y27632, at late phase 1 (movie S6). (N) Inhibitor assay of in vitro OV with calyculin. (O) Invagination probability in in vitro and ex vivo cultures. (P and Q) Inhibitor assay of in vitro OV at early phase 1, where Y27632 was locally applied to the distal portion of OV. The apical length, basal length, and height of the epithelium were measured (Q). Bars in (F), (J), (K), and (O) indicate SEs.
To clarify this point, we investigated the residual stress within OV and NR. The in vitro NRs show variance in morphology depending on its size at day 9 (24); some deform into a cup-like shape (Fig. 1A), and others maintain a spherical shape, even when vesicles have differentiated to Ceh-10 homeodomain-containing homolog (Chx10)+ NRs (Fig. 2C). We incised spherical OV and spherical NR using micro tweezers. As a result, the distal portion of the spherical OV maintained its curvature, while the spherical NR buckled in the apically convex direction (Fig. 2, C to F). This suggests that, while differentiating from OV to NR, cells generate the inner bending force and the NR autonomously invaginates in an apically convex manner. Consistently, the estimated bending rigidity of NR is much higher than those of OV and RPE (Fig. 2G), implying that NR is unlikely deformed by the external force generated at the surrounding tissues. Furthermore, as demonstrated in a previous report, the isolated human NR autonomously inverted its curvature into an apically convex direction (26). These results suggest that NR generates autonomous bending force in the apically convex direction.
In addition, as reported previously (11), the phospho–myosin light chain (pMLC) accumulates at the apical surface of OV and RPE and is markedly reduced in NR during the in vitro and in vivo optic-cup formation (Fig. 2, H and I, and fig. S6, B and C). Therefore, we performed quantitative measurements of actomyosin distribution and epithelial curvature and revealed that the actomyosin reduction correlates with the epithelial curvature both in vitro (Fig. 2, J and K) and in vivo (Fig. 2K and fig. S6, E to G).
To address effects of the actomyosin reduction on the epithelial curvature, we performed pharmacological assays of OV in vitro at late phase 1 (Fig. 2L). The inhibition of myosin activity by the Rho-associated protein kinase (ROCK) inhibitor, Y27632, inverted the distal portion of OV locally (Fig. 2M and movie S6), and maintaining myosin activity using the inhibitor for myosin phosphatase, calyculin A (fig. S6D) (27), everted the distal portion of OV locally (Fig. 2N and movie S6). In addition, the inhibition of the actomyosin reduction also prevented OV from invaginating in the ex vivo culture (Fig. 2O and fig. S6, H to L). Consistently, the ROCK inhibitor treatment on the inverted NR at phase 3 did not affect its morphology in both mouse and human embryonic stem cell–derived tissues (11, 26). These results suggest that actomyosin reduction could possibly cause apically convex epithelial invagination in optic-cup formation.
For further confirmation, we locally inhibited actomyosin accumulations on OV in early phase 1 and quantitatively measured the changes in the lengths of apical and basal surfaces (Fig. 2P and movie S6); while the actomyosin inhibition extended both apical and basal surfaces, the apical extension was much larger than the basal one (Fig. 2Q). This suggests that the actomyosin reduction specifically relaxes apical contractility and generates bending force in the apically convex direction. Furthermore, by measuring the effective stiffness of apical surfaces, which reflects contractility, we clarify the positive correlation between actomyosin accumulation and apical contractility (fig. S6M); i.e., down-regulating myosin activity by Y27632 decreases OV stiffness, and up-regulating myosin activity by calyculin A increases NR stiffness.
These results strongly support the idea that actomyosin-dependent apical relaxation is a driving force of the NR autonomous bending, although myosin-dependent cellular activities and the mechanical properties of extracellular matrices on the basal side, as reported in fish and chick embryonic optic cups (28, 29), may also contribute.
Lateral constriction amplifies epithelial curvature to form a hinge structure
Although apical constriction is well known to bend epithelial sheets (3–5, 17), the in silico screening indicated that apical constriction distorts the epithelial sheet around the NR-RPE boundary (Fig. 3, A and D, and fig. S4B) and could not facilitate the NR invagination (Fig. 3E). As an alternative cell behavior, we assumed that lateral constriction, whereby cells constrict along the apicobasal axis (Fig. 3A), may be involved. The simulations showed that lateral constriction forms a smooth hinge structure along the NR-RPE boundary (Fig. 3C and fig. S4B) and facilitates NR invagination (Fig. 3E and movie S7).
Fig. 3. Calcium-dependent lateral cell constriction in epithelial hinge structure formation.
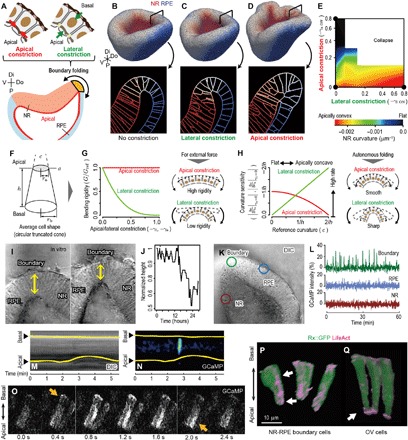
(A) Concept of apical and lateral cell constrictions at the NR-RPE boundary. (B to E) In silico screening assay of optic-cup formation with respect to the apical and lateral cell contractility (movie S7). External view of the entire tissue and the sections around the NR-RPE boundary obtained under conditions with no constriction (B), lateral constriction (C), and apical constriction (D). Dependence of NR curvature on apical and lateral constrictions (E), where apical and lateral constrictions are expressed as the length strains of the spontaneous perimeter and height of cells (nondimensions). Tissue morphologies are shown in the 3D coordinates with the distal-proximal, dorsal-ventral, and anterior-posterior axis in (B) to (D). (F to H) Theoretical analyses of cell mechanics; a simple mathematical model of cell mechanics based on assuming a conical frustum as an average cell shape (F). Epithelial bending rigidity as a function of apical/lateral strain (G). Sensitivity of epithelial curvature to apical/lateral strain as a function of the reference curvature of epithelium (H). (I and J) Time-lapse imaging of the in vitro optic cup at the NR-RPE boundary (movie S8). Time displacement of epithelial height (J). (K and L) Calcium observation in the in vitro optic cup; time variance of local GCaMP intensity at NR, RPE, and the NR-RPE boundary (L). (M and N) Kymographs of GCaMP intensity and cell shape along the apicobasal axis, respectively. (O) Time-lapse imaging of calcium transients within a single cell. (P and Q) Actin accumulation within individual cells (movie S9). Actin aligning along the apicobasal axis in the NR-RPE boundary (P) and actin accumulated around the apical surface in OV (Q). DIC, differential interference contrast.
To address the difference in mechanical roles between apical and lateral constrictions, we theoretically estimated their effects on epithelial deformation by assuming single-cell mechanics (Fig. 3F). According to first-order estimations, the bending rigidity of epithelium hardly depends on apical strain but is markedly decreased by lateral strain (Fig. 3G), demonstrating that lateral constriction facilitates epithelial curvature. Besides, when an epithelial sheet is already curved like the NR-RPE boundary, lateral constriction plays a role in amplifying its curvature more effectively than apical constriction to form a hinge structure (Fig. 3H and fig. S1E). Furthermore, while apical constriction shrinks apical surfaces of individual cells, lateral constriction does not (fig. S6N); therefore, lateral constriction rather maintains the smooth epithelial structure to form proper organ shape.
To clarify whether lateral constriction occurs during optic-cup formation, we observed the dynamics of epithelial thickness (corresponding to the lateral lengths of cells) in vitro and found that lateral constriction certainly occurs at the NR-RPE boundary (Fig. 3I and movie S8). While the epithelial thickness gradually decreases in an irreversible manner, it dynamically oscillates during the invagination process (Fig. 3J). This oscillating lateral constriction had been unknown, whereas similar constrictions have been reported, such as oscillating apical constrictions observed in Drosophila (30) and mouse cleavage cells (31). In addition, nonoscillating lateral constrictions have been reported in a mathematical model (32), in Drosophila apoptotic cells (33), and in ascidian gastrulation (34).
To address the upstream regulation, we monitored calcium activity that is known to cause cell constriction (35, 36). As a result, we found that calcium transients occur specifically at the NR-RPE boundary (Fig. 3, K and L) and that the calcium transients correlated with lateral constriction (Fig. 3, M and N, and movie S8). The lateral constriction that is correlated with calcium transients causes almost reversible deformations (Fig. 3M), and the time scale of their frequency is much smaller than that observed in the prolonged observation of the macroscopic tissue deformations (Fig. 3J). This implies that the accumulation of the short-term reversible constriction leads to the long-term irreversible constriction in a plastic manner.
We also found that the calcium transients propagate from the basal to apical surfaces within cells (Fig. 3O). In addition, we visualized actin cytoskeletons using LifeAct (37) and noticed a characteristic structure of actin fibers aligning along the apicobasal axis in NR-RPE boundary cells (Fig. 3P and movie S9). Actin fibers normally accumulated on the apical side of epithelial cells such as those in OV cells (Fig. 3Q) and RPE cells (data not shown). Because calcium triggers cell contractions by regulating actin-myosin interactions (35, 36), these results imply that the lateral constriction is driven by actomyosin contractility and is triggered by calcium activity on the basal surface.
Strain-triggered cell constriction facilitates epithelial invagination as a mechanical feedback
As shown above, during optic-cup formation, NR cells autonomously generate bending force, and subsequently, NR-RPE boundary cells cause lateral constriction to form a hinge structure. We considered the possibility that these two behaviors might be mechanically linked (fig. S1A); the bending force generated at the NR region propagates to the NR-RPE boundary and triggers lateral constriction via cellular mechanical strain (which we refer to as strain-triggered constriction).
We first investigated whether the bending force generated at the NR region triggers cells at the NR-RPE boundary to facilitate NR invagination. To clarify this point, we artificially exerted the mechanical force on OV, imitating the effect of NR autonomous bending on the NR-RPE boundary; by pushing a thick micropipette on the epithelial surface of OV, we forcedly deformed a distal portion of the epithelium to be apically convex and the surrounding portion to be apically concave (Fig. 4, A and B). The epithelia expressed an elastic response to the brief pushing, whereas they expressed a plastic response to sustained pushing over a longer time; while pushing the epithelia, the concave region of the epithelia gradually became acute (Fig. 4B and movie S10). The acute shape was maintained even after removing the pipette (Fig. 4, C and D). These results suggest that the epithelia express a time-dependent rheological response to external force, which plays a role in adaptively facilitating NR invagination during optic-cup morphogenesis.
Fig. 4. Strain-triggered cell constriction in epithelial folding.
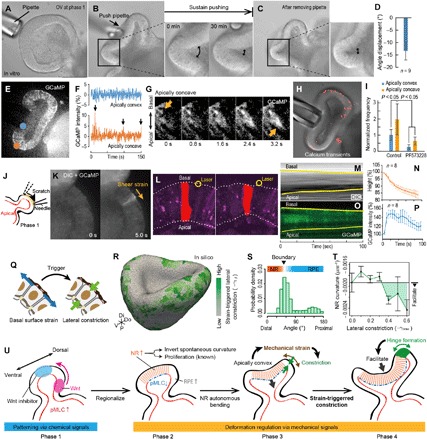
(A to I) Mechanical assay in the in vitro OV using a micropipette (movie S10); the distal portion of the vesicle forcedly invaginated, and the surrounding portion is forcedly folded (A and B). The pipette was gently removed after sustained pushing for 30 min (C). Enlarged frames in (B) and (C) show the time-lapse images of the folded region of the epithelium. (D) Difference in the epithelial angles before and after pushing for 30 min in (B) and (C). (E and F) Calcium distribution and local dynamics in (B). Arrows in (F) indicate the peaks of GCaMP intensity corresponding to calcium transients. (G) Time-lapse images of calcium transients in a single cell around the folded region under pushing. (H and I) Spatial distribution of the calcium transient events under pushing (H), from which the average frequencies are counted in each region (I). (J and K) Time-lapse imaging of calcium responses to shear stress on the basal surface (movie S11). (L to P) Time-lapse imaging of single-cell dynamics under the assay of focusing two-photon laser locally on the basal cell surfaces (movie S12) (41): single-cell shape (L), epithelial height (M and N), and calcium concentration (O and P). (Q to T) Proof of concept by computational simulations under the condition with the strain-triggered lateral constriction using the 3D vertex model; in silico optic cup obtained by the simulation at t = 48 (R) (movie S13), probability density of strain-triggered lateral constriction along the proximal-distal axis (S), and dependence of NR curvature on lateral contractility (T). Tissue morphology is represented in the 3D coordinates with the distal-proximal, dorsal-ventral, and anterior-posterior axis in (R). In (R) and (T), lateral constriction is expressed as the length strain of the spontaneous height of cells (nondimensions). (U) Proposed model for the stepwise optic-cup morphogenesis with the strain-triggered mechanical feedback. Bars in (D), (I), (N), and (P) indicate SEs, and bars in (T) indicate SDs.
Since the lateral constrictions correlated with calcium transients in the optic-cup formation (Fig. 3, L to N), we further examine whether the bending force generated at NR causes calcium transients selectively at the NR-RPE boundary. To address this point, we observed calcium transients in the artificially deformed OV. The frequency of calcium transients increased at the apically concave region but not at the apically convex region (Fig. 4, E to H). Moreover, these calcium transients propagated from the basal to the apical sides (Fig. 4I), similar to the cells at the NR-RPE boundary (Fig. 3O). These results suggest that the time-dependent mechanical response of the epithelium (Fig. 4B) may be triggered by calcium transients, corresponding with previous reports that inhibiting calcium prevents cell constriction (38) and optic-cup formation (39).
On the basis of calcium activity (Figs. 3O and 4, E to I), we expected that the cells at the NR-RPE boundary sense mechanical stress on their basal surfaces generated by autonomous NR bending. To clarify this point, shear stress was exerted on the basal surface of OV by gently scratching it with a glass needle, and we found that the shear stress on the basal surface triggers calcium transients (Fig. 4, J and K, and movie S11). Consistently, inhibiting focal adhesion kinases that are relevant to the mechanosensing on the basal surface (40) by PF573228 reduced the frequency of calcium transients (Fig. 4H). Moreover, to clarify effects of calcium transients on lateral constriction, we locally induced calcium transients using laser ablations according to the reported method (41) and revealed that the local up-regulation of intracellular calcium concentration drives lateral constriction (Fig. 4, L to P, and movie S12). These results suggest that lateral constriction may be triggered by mechanical strain via calcium transients based on cellular mechanosensing on the basal surfaces.
Last, for the proof of concept of the strain-triggered cell constriction, we performed further computational simulations using the 3D vertex model. On the basis of the experimental results (Figs. 3O and 4, A to P), we assumed that the tensile strain of cell surfaces on the basal side triggers transient lateral constriction (Fig. 4Q). As a result, the simulations successfully recapitulated optic-cup formation (Fig. 4R and movie S13), wherein the strain-triggered lateral constriction autonomously occurred at the NR-RPE boundary (Fig. 4S) and facilitated the NR invagination (Fig. 4T).
In summary, our results suggest that the mechanical force plays a key role as a feedback regulator in self-organizing the 3D optic-cup formation (Fig. 4U). During optic-cup formation, OV autonomously generates the differentiation pattern of NR and RPE. According to the differentiation, the NR reduces actomyosin accumulation and causes autonomous bending in the apically convex direction. The macroscopic bending force propagates to the NR-RPE boundary region, generates mechanical strain on individual cells across different scales, and triggers lateral constriction via mechanosensing on the basal cell surfaces. The lateral constriction forms a hinge structure along the NR-RPE boundary and facilitates NR invagination as a mechanical feedback.
DISCUSSION
It has long been known that diffusible molecules are key players in providing signals between cells during embryogenesis. While the molecular signaling has been successfully explained, many aspects of morphogenesis, including the regulation of macroscopic 3D tissue deformation, remain unclear. For example, cellular force generation driving morphogenesis had been thought to be triggered by molecular cues according to cell differentiation patterns, but the present study has revealed that the hinge structure formation along the NR-RPE boundary is actually triggered by mechanical strain via mechanosensing during optic-cup formation (i.e., mechanical force plays a key role in feeding back the 3D tissue deformation to the force generations of individual cells across different scales). A complete understanding of this molecular mechanism requires further investigation, but this finding challenges the conventional thought process about the development of multicellular organisms. The role of mechanical force in multicellular communication via macroscopic epithelial deformation has been suspected since the pioneer computational work in 1981 (42), and the present study is probably the first study to the best of our knowledge to identify this role in living tissue development.
The present study has provided several findings relevant to epithelial mechanics such as the mechanism of the myosin reduction–induced apically convex invagination and the role of myosin-dependent lateral constriction. These findings can be attributed to the versatility and predictability of the developed 3D vertex model. Besides the optic-cup formation, this model can also be applied to various physiologies in morphogenesis, homeostasis, and disease. While this model has been validated from physical and topological points of view (18, 23), further validations are required in several points such as the applicable range of the model and the quantifiability of its predictions, in practical uses to each biological phenomenon.
The present study has also suggested that mechanical force plays a role in causing feedback during optic-cup formation. Since the mechanical feedback occurs adaptively according to the 3D tissue deformation, it may have a role in sustaining the robustness of morphogenesis. In particular, in the optic-cup formation, it may play a key role in robustly forming the smooth hinge structure along the NR-RPE boundary under environmental disturbances; at least in the in vitro culture system of optic cups, the location of the NR-RPE boundary largely varies (24). Because the presence of a hinge structure is observed in a variety of boundaries between different tissues, the effect of mechanical feedback is likely to be often involved in self-organizing developmental processes.
The mechanical feedback between cells is a typical example of phenomena emerging from the multicellular dynamics comprising dynamic intracellular systems [referred to as cytosystems dynamics (17)]. Because the multicellular dynamics involve nonlinear effects of multicellularity, it is difficult to predict the integrated dynamics from individual cell behaviors. For example, while the existence of the lateral constriction in optic-cup formation might have been predictable, its role in forming the smooth hinge structure had been unexpected (Fig. 3, A to E). The complementary approach of in vitro and in silico systems used in the present study has helped to partly overcome the challenges. This complementary approach could be applied widely to explore new aspects of the biological nature of multicellular systems and for predicting their dynamics. This approach may also open up a new avenue in the field of highly organized tissue engineering, providing a basis for manipulating the 3D structure of stem cell–derived tissues.
MATERIALS AND METHODS
In vitro and ex vivo cultures
In vitro optic cup was derived using serum-free floating culture of embryoid body-like aggregates with quick reaggregation (SFEBq) culture, as described previously (11). The optic-cup formation has been successfully recapitulated in several laboratories (11, 24, 43). Ex vivo culture was performed by excising the heads of embryonic day 9 mouse embryos and incubating them in Dulbecco’s modified Eagle’s medium and F-12 nutrient mixture supplemented with N2 and penicillin additive under 40% O2 and 5% CO2.
Observation of single-cell shapes in vitro
Single-cell shapes in the regions of NR and the NR-RPE boundary were obtained from the organoids at day 9 in the mixed culture of Rx–GFP (green fluorescent protein) and Sox1-GFP cell lines. Because Rx-GFP cells generate positive fluorescence but Sox1-GFP do not in the optic region, cells in the organoid generate fluorescence in a mosaic manner (11). We obtained their images using a two-photon fluorescence microscopy (Olympus) and extracted cell shapes using the image processing software (ZEISS, Imaris).
Quantification of epithelial curvature, height, and signal intensity
The epithelial curvature, height, and signal intensity were measured from the immunostaining images of sliced tissues and/or the confocal images of whole tissues, where the curvature is measured by a sequential three-point method (12).
Immunohistochemistry
Immunohistochemistry was performed as described previously. Antibodies against the following proteins were used at the indicated dilutions: Chx10 (sheep/1:1000, Exalpha Biologicals), microphthalmia-associated transcription factor (Mitf) (mouse/1:1000, Exalpha Biologicals), and pMLC2 (rabbit/1:50, Cell Signaling Technology). DAPI (4′,6-diamidino-2-phenylindole) was used for counterstaining the nuclei (Molecular Probes). Stained sections were analyzed with an LSM780 Confocal Microscope (Carl Zeiss).
Measurements of cell stiffness
The cell stiffness was examined by indentation assay using an atomic force microscopy (AFM) cantilever as described previously (11), where OV and NR regions were defined on the basis of the GFP fluorescence of Rx-GFP lines and tissue structures on days 7 and 9, respectively. Similarly to surface stiffness, surface contractility was measured using AFM, since, in the use of AFM, the displacement of cantilever is measured and can be translated into contractility and stiffness (44).
Mechanical perturbation and calcium observation
Mechanical perturbations on OVs were examined using thin- and thick-glass micropipettes, whose diameters were 10 and 100 μm, respectively. The calcium concentration was observed via inverted microscopes (confocal or multiphoton) combined with a full-sized CO2/O2 incubator (Olympus) using mouse embryonic stem cells on the Sox1-GFP cell line in which the GCaMP3 gene is knocked-in on the Rosa26 locus. As Rx-GFP cells generate positive fluorescence but Sox1-GFP cells do not in the optic region, cells in the organoid generate fluorescence in a mosaic manner. For the quantification of calcium transients, we regarded that a calcium transient occurs when the GCaMP intensity exceeds the threshold and counted the number of transients per unit time and area. The threshold was defined as the multiple values of the SD of GCaMP intensity more than the average in each sequence of images. The frequency was measured after processing the images via the median, Gaussian, Laplacian, and banalization filters. Local induction of calcium transients was completed with the same multiphoton optical system for 3D live imaging, where the 900-nm laser beam from Mai Tai eHP DeepSee was condensed at target cells via a ×25 water immersion lens (numerical aperture, 1.05) using a spot illumination or line scan (typically 0.1 to 0.5 s duration). Mechanical stimulation was performed using sharp-pointed glass micropipettes controlled by a piezo manipulator (MM3A-LS, Kleindiek Nanotechnik) under the inverted microscope combined with a spinning disc confocal unit (CSUW1, Yokogawa).
Theoretical analyses of epithelial properties and deformation
On the basis of the mean field approximation of the epithelial sheet (17, 45), we assumed that an average cell shape embedded in a monolayer epithelial sheet is a conical frustum, whose apical and basal radii and height are represented by ra, rb, and h (Fig. 3F). The curvature of the epithelial sheet, represented by c (positive in the case of apically concave and −2/h < c < 2/h), was obtained as c = (2/h)(rb − ra)/(rb + ra). We assumed that cells cause apical and lateral constrictions, whose active strains on apical perimeter and height are represented by γa and γl, respectively (negative in the case of constriction). We represent the apical cell surface area before apical and lateral constrictions by sa ref. The apical surface area, represented by sa, was given by sa/sa ref = (1 − γa)−2 in the case of apical constriction and sa/sa ref = 1 in the case of lateral constriction (fig. S6N).
On the basis of continuum mechanics, the bending rigidity of the epithelial sheet was estimated as the bending rigidity of beams with homogeneous elasticity for individual tissues. We represent the bending stiffness before apical and lateral constrictions by Gref. Bending rigidity of plate, represented by G, can be expressed by G ∝ Eh3, where E is an elastic module. Immediately, we obtained G/Gref = 1 in the case of apical constriction and G/Gref = (1 − γl)3 in the case of lateral constriction (Fig. 3G). Similarly, the ratio of the bending stiffness of OV, NR, and RPE was estimated from the experimental data of cell heights and apical elasticity (Fig. 2G).
The dependence of the epithelial curvature on the apical and lateral constrictions can be expressed as the partial differential equations of c for these active strains as follows
| (1) |
| (2) |
These results are shown in Fig. 3H. The functions in Eqs. 1 and 2 intersect at in c > 0. In the case that epithelial sheet is almost flat (), apical constriction is more effective on the curvature than lateral constriction for increasing the curvature. On the contrary, in the case that epithelial sheet is already bent (), the lateral constriction is more effective to facilitate the curvature.
Computational simulations using a versatile 3D vertex model of optic-cup formation
The 3D multicellular dynamics were expressed using the versatile 3D vertex model (fig. S2). The main symbols in this model are listed in table S1. In this model, each cell shape is represented by a single polyhedron, and each cell-cell boundary is represented by a polygonal face (fig. S2, A and B) (13). Because the polygonal faces are shared by neighboring polyhedrons, the entire tissue structure is represented by a single network composed of vertices and edges (fig. S2C).
Topological dynamics of 3D multicellular dynamics such as cell rearrangement, division, and apoptosis were expressed by several types of network reconnections. Cell rearrangement is expressed by reconnecting local network patterns using the reversible network reconnection model (fig. S2D). Previously, we have mathematically proved a part of physical validities of this model; i.e., this model can express continuous cell rearrangements with geometric and energetic reversibility (18). Cell proliferation was expressed using a cell proliferation model that expresses cell proliferation by cell growth (increase in cell volume) and cell division (increase in cell number; fig. S2E) (46). Cell apoptosis was expressed using a cell apoptosis model that expresses cell apoptosis by cell shrinkage (decrease in cell volume) and cell disappearance (decrease in cell number; fig. S2F) (47). Previously, we have also mathematically proved a part of topological validities of this model; i.e., this model can express the entire pattern of multicellular topological dynamics in 3D space (23). This model has been applied to several 3D multicellular dynamics (48–51) and can potentially be applied to various physiologies in morphogenesis, homeostasis, and disease.
The 3D multicellular dynamics were expressed by the vertex movements according to the total energy, represented by U. As the deformation process of the optic-cup formation takes approximately 2 days, we regarded it as the quasi-static process from a thermodynamic point of view, where viscous forces are relaxed in an instance. Under this process, the energetic force satisfies the force balance at each time point as ∇U = 0. Here, we defined the total energy as U = U({ri}, {ζjα}, {ξjkβ}), where {…} indicates a set of components, ri is the position vector of the ith vertex, ζjα is the αth physical parameter of the jth cell, and ξjkβ is the βth physical parameter of the jth and kth cells. Under ∇U = 0, the vertex locations {ri} at each time point are obtained by seeking the local minimum of U, and thereby the time displacements of the vertex locations {ri} are obtained as the changes in {ri} against those in physical parameters {ζjα} and {ξjkβ}. The local minimum of U is solved by the Euler method of the overdamped equation (52).
We introduced the jth cell volume vj, height hj, apical perimeter length pj, basal surface area sbj, total surface area stj, and the apical edge between jth and kth cells lajk, as a function of {ri}. The total energy function U is expressed as follows
| (3) |
where H is the Heaviside step function with a value of 1 when the variable is positive and 0 otherwise. In Eq. 3, the first term denotes the elastic energy of individual cell volumes, where Kvj and veqj are the jth cell volume elasticity and equilibrium volume, respectively. The second term is the elastic energy of individual cell heights (fig. S2G), where Khj and heqj are the jth cell height elasticity and equilibrium height, respectively. The third term is the elastic energy of individual cell apical perimeters (fig. S2H), where Kaj and peqj are the jth cell apical perimeter elasticity and equilibrium apical perimeter length, respectively. The fourth term is the boundary length energy between cells on the apical surface (fig. S2I), where λgjk is the apical edge length energy between the jth and kth cells. The fifth term is the elastic energy of individual cell basal surfaces (fig. S1J), where Kbj and peqj are the jth cell basal surface elasticity and equilibrium basal surface area, respectively. The last term is the total surface energy of individual cells (fig. S2K), where κsj is the jth cell surface elasticity. Hence, in Eq. 3, {ζjα} is described as a set of parameters Kvj, Khj, Kaj, Kbj, κsj, veqj, heqj, peqj, and sbeqj, and {ξjkβ} is a set of λgjk.
The optic cup is formed even under the condition where the root of the OV is cut (11), and the shape of the root of the OV is not important for morphogenesis. Hence, the initial condition was set to be a monolayer spherical OV. The initial OV is composed of 1600 cells, which was estimated from the tissue size and cell density measured in experiments. In the initial OV, the dorsal-ventral and distal-proximal axes are defined to be orthogonal in the 3D orthogonal coordinates. Moreover, the optic cup is formed even under conditions where a hole is made in the epithelial sheet or the surrounding tissues are removed (11); therefore, the inner pressure and extrinsic forces are unnecessary. Hence, the boundary condition was set to be free with fixing the center of all vertex positions on the coordinates.
By varying all the unknown parameters, we obtained a standard set of physical parameter values (table S4) that recapitulates the optic-cup formation (Fig. 1, I to L). We also varied all of the unknown parameters around the standard values and obtained many phenotypes (table S5 and fig. S4). The resulting optic cups were screened by two evaluation parameters: the NR curvature and the NR-RPE boundary curvature, represented by cNR and cB, respectively (closed regions in fig. S4). By varying cNR and cB, we determined several dominant physical parameters for the proper optic-cup formation, from which Figs. 2B and 3 (B to E) were extracted.
To test whether the strain-triggered mechanical feedback is inherited in the optic-cup formation, we modeled this cell response and implemented it to the above model for the in silico screening by replacing the part of lateral constriction (Fig. 4Q). Because the lateral constriction oscillates in the optic-cup formation, we expressed that cells transiently constrict depending on the basal surface strain and relax for a while. In biological experiments, the basal calcium transients in NR are much lower than those in OV and RPE, since the gap junction is poor in NR (53); hence, we assumed that this strain-triggered constriction occurs only in the OV and RPE regions. By varying the relevant physical parameters, we obtained the optic-cup morphogenesis that contains the mechanical feedback (Fig. 4, R to T). Details of the model are described in Supplementary Text.
Numerical calculations were performed using customized C++ software on a computer comprising 2.9-GHz Intel Xeon dual processors and 64-GB random-access memory and RIKEN Super Combined Cluster. The results were visualized with ParaView (54).
Supplementary Material
Acknowledgments
We are grateful to S. Hayashi for critical reading and invaluable comments and to all the laboratory members for fruitful discussions. This article is dedicated to the memory of the late Dr. Yoshiki Sasai. Funding: This research was supported by JST/PRESTO grant number JPMJPR16F3 (to S.O.), JSPS KAKENHI grant numbers 16H04799 and 16H06485 (to M.E.), Research Center Network for Realization of Regenerative Medicine of AMED (to M.E.), and Strategic Programs for R&D (President’s Discretionary Fund) of RIKEN (to M.E.). Author contributions: S.O., M.E., and Y.S. conceived and designed this study. S.O. and M.E. performed experiments, image processing, experimental data analyses, and theoretical and computational analyses and wrote the manuscript. N.T., Y.H., and M.K. also performed experiments. Y.I. and T.A. discussed theoretical and computational analyses. Competing interests: The authors declare that they have no competing interests. Data and materials availability: All data needed to evaluate the conclusions in the paper are present in the paper and/or the Supplementary Materials. Additional data and source codes related to this paper may be requested from the authors. The Rx-GFP cell line is available from RIKEN BioResource Research Center (ID: AES0145). The Sox1-EGFP-GCaMP3 cell line will be deposited at the cell bank of RIKEN BioResource Research Center.
SUPPLEMENTARY MATERIALS
Supplementary material for this article is available at http://advances.sciencemag.org/cgi/content/full/4/11/eaau1354/DC1
Supplementary Text
Fig. S1. Concept models of optic-cup formation and epithelial bending.
Fig. S2. Versatile 3D vertex model describing multicellular dynamics in 3D space.
Fig. S3. Quantification of optic-cup morphogenesis.
Fig. S4. Quantitative simulations of optic-cup morphogenesis for all of the unknown parameters.
Fig. S5. Comparison between in silico and ex vivo optic-cup formation under perturbations.
Fig. S6. Actomyosin activities in in vivo and ex vivo optic-cup morphogenesis.
Table S1. Main symbols used in the 3D vertex model of optic-cup formation.
Table S2. Standard physical parameter values of cell states in computational simulations of optic-cup formation.
Table S3. Standard physical parameter values of boundary regions in computational simulations of optic-cup formation.
Table S4. Standard physical parameter values of cell behaviors used in computational simulations of optic-cup formation.
Table S5. Varied physical parameter values obtained from computational simulations of optic-cup formation.
Movie S1. Hinged cell shape at the NR-RPE boundary in the in vitro optic cup.
Movie S2. In silico recapitulation of optic-cup morphogenesis using the versatile 3D vertex model.
Movie S3. Cell proliferation, constriction, and apoptosis in in silico optic-cup formation.
Movie S4. Dependence of in silico optic-cup morphogenesis on cell heightening, proliferation, apoptosis, and differentiation.
Movie S5. Dependence of in silico optic-cup morphogenesis on formation of spontaneous curvature of NR.
Movie S6. Pharmacological assays of actomyosin activities in vitro.
Movie S7. Dependence of in silico optic-cup morphogenesis on apical and lateral cell constrictions.
Movie S8. Lateral cell constrictions in vitro.
Movie S9. Characteristic alignment of intracellular actin fibers along the apicobasal axis in vitro.
Movie S10. Elastic and plastic responses of in vitro neuroepithelium to mechanical stimuli.
Movie S11. Calcium response to shear stress on the basal surface in vitro.
Movie S12. Lateral constrictions triggered by local up-regulation of intracellular calcium concentration in vitro.
Movie S13. In silico recapitulation of optic-cup morphogenesis with strain-triggered lateral constriction.
REFERENCES AND NOTES
- 1.Spemann H., Über Korrelationen in der Entwicklung des Auges. Verh. Anat. Ges. 15, 61–79 (1901). [Google Scholar]
- 2.Heavner W., Pevny L., Eye development and retinogenesis. Cold Spring Harb. Perspect. Biol. 4, a008391 (2012). [DOI] [PMC free article] [PubMed] [Google Scholar]
- 3.Lecuit T., Lenne P.-F., Cell surface mechanics and the control of cell shape, tissue patterns and morphogenesis. Nat. Rev. Mol. Cell Biol. 8, 633–644 (2007). [DOI] [PubMed] [Google Scholar]
- 4.Davidson L. A., Epithelial machines that shape the embryo. Trends Cell Biol. 22, 82–87 (2012). [DOI] [PMC free article] [PubMed] [Google Scholar]
- 5.Heisenberg C.-P., Bellaïche Y., Forces in tissue morphogenesis and patterning. Cell. 153, 948–962 (2013). [DOI] [PubMed] [Google Scholar]
- 6.Discher D. E., Janmey P., Wang Y.-L., Tissue cells feel and respond to the stiffness of their substrate. Science 310, 1139–1143 (2005). [DOI] [PubMed] [Google Scholar]
- 7.Shyy J. Y. J., Chien S., Role of integrins in endothelial mechanosensing of shear stress. Circ. Res. 91, 769–775 (2002). [DOI] [PubMed] [Google Scholar]
- 8.Polacheck W. J., German A. E., Mammoto A., Ingber D. E., Kamm R. D., Mechanotransduction of fluid stresses governs 3D cell migration. Proc. Natl. Acad. Sci. U.S.A. 111, 2447–2452 (2014). [DOI] [PMC free article] [PubMed] [Google Scholar]
- 9.Kretzschmar K., Clevers H., Organoids: Modeling development and the stem cell niche in a dish. Dev. Cell 38, 590–600 (2016). [DOI] [PubMed] [Google Scholar]
- 10.Eiraku M., Watanabe K., Matsuo-Takasaki M., Kawada M., Yonemura S., Matsumura M., Wataya T., Nishiyama A., Muguruma K., Sasai Y., Self-organized formation of polarized cortical tissues from ESCs and its active manipulation by extrinsic signals. Cell Stem Cell 3, 519–532 (2008). [DOI] [PubMed] [Google Scholar]
- 11.Eiraku M., Takata N., Ishibashi H., Kawada M., Sakakura E., Okuda S., Sekiguchi K., Adachi T., Sasai Y., Self-organizing optic-cup morphogenesis in three-dimensional culture. Nature 472, 51–56 (2011). [DOI] [PubMed] [Google Scholar]
- 12.Hasegawa Y., Takata N., Okuda S., Kawada M., Eiraku M., Sasai Y., Emergence of dorsal-ventral polarity in ESC-derived retinal tissue. Development 143, 3895–3906 (2016). [DOI] [PubMed] [Google Scholar]
- 13.Honda H., Tanemura M., Nagai T., A three-dimensional vertex dynamics cell model of space-filling polyhedra simulating cell behavior in a cell aggregate. J. Theor. Biol. 226, 439–453 (2004). [DOI] [PubMed] [Google Scholar]
- 14.Viens D., A three-dimensional finite element model for the mechanics of cell-cell interactions. J. Biomech. Eng. 129, 651–657 (2007). [DOI] [PubMed] [Google Scholar]
- 15.Trichas G., Smith A. M., White N., Wilkins V., Watanabe T., Moore A., Joyce B., Sugnaseelan J., Rodriguez T. A., Kay D., Baker R. E., Maini P. K., Srinivas S., Multi-cellular rosettes in the mouse visceral endoderm facilitate the ordered migration of anterior visceral endoderm cells. PLOS Biol. 10, e1001256 (2012). [DOI] [PMC free article] [PubMed] [Google Scholar]
- 16.Osterfield M., Du X. X., Schüpbach T., Wieschaus E., Shvartsman S. Y., Three-dimensional epithelial morphogenesis in the developing drosophila egg. Dev. Cell 24, 400–410 (2013). [DOI] [PMC free article] [PubMed] [Google Scholar]
- 17.Hannezo E., Prost J., Joanny J.-F., Theory of epithelial sheet morphology in three dimensions. Proc. Natl. Acad. Sci. U.S.A. 111, 27–32 (2014). [DOI] [PMC free article] [PubMed] [Google Scholar]
- 18.Okuda S., Inoue Y., Eiraku M., Sasai Y., Adachi T., Reversible network reconnection model for simulating large deformation in dynamic tissue morphogenesis. Biomech. Model. Mechanobiol. 12, 627–644 (2013). [DOI] [PubMed] [Google Scholar]
- 19.Salbreux G., Alt S., Ganguly P., Salbreux G., Vertex models: From cell mechanics to tissue morphogenesis. Philos. Trans. R Soc. B Biol. Sci. 372, 20150520 (2017). [DOI] [PMC free article] [PubMed] [Google Scholar]
- 20.Boehm B., Westerberg H., Lesnicar-Pucko G., Raja S., Rautschka M., Cotterell J., Swoger J., Sharpe J., The role of spatially controlled cell proliferation in limb bud morphogenesis. PLOS Biol. 8, e1000420 (2010). [DOI] [PMC free article] [PubMed] [Google Scholar]
- 21.Nishimura T., Honda H., Takeichi M., Planar cell polarity links axes of spatial dynamics in neural-tube closure. Cell 149, 1084–1097 (2012). [DOI] [PubMed] [Google Scholar]
- 22.Noh H., Lee H., Park E., Park S., Proper closure of the optic fissure requires ephrin A5-EphB2-JNK signaling. Development 143, 461–472 (2016). [DOI] [PubMed] [Google Scholar]
- 23.Hashimoto A., Nagao A., Okuda S., Topological graph description of multicellular dynamics based on vertex model. J. Theor. Biol. 437, 187–201 (2018). [DOI] [PubMed] [Google Scholar]
- 24.Decembrini S., Koch U., Radtke F., Moulin A., Arsenijevic Y., Derivation of traceable and transplantable photoreceptors from mouse embryonic stem cells. Stem Cell Reports 2, 853–865 (2014). [DOI] [PMC free article] [PubMed] [Google Scholar]
- 25.Eiraku M., Adachi T., Sasai Y., Relaxation-expansion model for self-driven retinal morphogenesis: A hypothesis from the perspective of biosystems dynamics at the multi-cellular level. BioEssays 34, 17–25 (2012). [DOI] [PMC free article] [PubMed] [Google Scholar]
- 26.Nakano T., Ando S., Takata N., Kawada M., Muguruma K., Sekiguchi K., Saito K., Yonemura S., Eiraku M., Sasai Y., Self-formation of optic cups and storable stratified neural retina from human ESCs. Cell Stem Cell 10, 771–785 (2012). [DOI] [PubMed] [Google Scholar]
- 27.Fabian L., Troscianczuk J., Forer A., Calyculin A, an enhancer of myosin, speeds up anaphase chromosome movement. Cell Chromosome 6, 1 (2007). [DOI] [PMC free article] [PubMed] [Google Scholar]
- 28.Martinez-Morales J. R., Rembold M., Greger K., Simpson J. C., Brown K. E., Quiring R., Pepperkok R., Martin-Bermudo M. D., Himmelbauer H., Wittbrodt J., ojoplano-mediated basal constriction is essential for optic cup morphogenesis. Development 136, 2165–2175 (2009). [DOI] [PubMed] [Google Scholar]
- 29.Oltean A., Huang J., Beebe D. C., Taber L. A., Tissue growth constrained by extracellular matrix drives invagination during optic cup morphogenesis. Biomech. Model. Mechanobiol. 15, 1405–1421 (2016). [DOI] [PMC free article] [PubMed] [Google Scholar]
- 30.Martin A. C., Kaschube M., Wieschaus E. F., Pulsed contractions of an actin-myosin network drive apical constriction. Nature 457, 495–499 (2009). [DOI] [PMC free article] [PubMed] [Google Scholar]
- 31.Maître J.-L., Niwayama R., Turlier H., Nédélec F., Hiiragi T., Pulsatile cell-autonomous contractility drives compaction in the mouse embryo. Nat. Cell Biol. 17, 849–855 (2015). [DOI] [PubMed] [Google Scholar]
- 32.Davidson L. A., Koehl M. A. R., Keller R., Oster G. F., How do sea urchins invaginate? Using biomechanics to distinguish between mechanisms of primary invagination. Development 121, 2005. –2018 ( 2005). [DOI] [PubMed] [Google Scholar]
- 33.Monier B., Gettings M., Gay G., Mangeat T., Schott S., Guarner A., Suzanne M., Apico-basal forces exerted by apoptotic cells drive epithelium folding. Nature 518, 245–248 (2015). [DOI] [PubMed] [Google Scholar]
- 34.Sherrard K., Robin F., Lemaire P., Munro E., Sequential activation of apical and basolateral contractility drives ascidian endoderm invagination. Curr. Biol. 20, 1499–1510 (2010). [DOI] [PMC free article] [PubMed] [Google Scholar]
- 35.Markova O., Lenne P. F., Calcium signaling in developing embryos: Focus on the regulation of cell shape changes and collective movements. Semin. Cell Dev. Biol. 23, 298–307 (2012). [DOI] [PubMed] [Google Scholar]
- 36.Holzapfel G., Wehland J., Weber K., Calcium control of actin-myosin based contraction in triton models of mouse 3T3 fibroblasts is mediated by the myosin light chain kinase (MLCK)-calmodulin complex. Exp. Cell Res. 148, 117–126 (1983). [DOI] [PubMed] [Google Scholar]
- 37.Riedl J., Crevenna A. H., Kessenbrock K., Yu J. H., Neukirchen D., Bista M., Bradke F., Jenne D., Holak T. A., Werb Z., Sixt M., Wedlich-Soldner R., Lifeact: A versatile marker to visualize F-actin. Nat. Methods 5, 605–607 (2008). [DOI] [PMC free article] [PubMed] [Google Scholar]
- 38.Schillers H., Wälte M., Urbanova K., Oberleithner H., Real-time monitoring of cell elasticity reveals oscillating myosin activity. Biophys. J. 99, 3639–3646 (2010). [DOI] [PMC free article] [PubMed] [Google Scholar]
- 39.Brady R. C., Hilfer S. R., Optic cup formation: A calcium-regulated process. Proc. Natl. Acad. Sci. U.S.A. 79, 5587–5591 (1982). [DOI] [PMC free article] [PubMed] [Google Scholar]
- 40.Young S. R. L., Gerard-O’Riley R., Kim J.-B., Pavalko F. M., Focal adhesion kinase is important for fluid shear stress-induced mechanotransduction in osteoblasts. J. Bone Miner. Res. 24, 411–424 (2009). [DOI] [PMC free article] [PubMed] [Google Scholar]
- 41.Joshi S. D., von Dassow M., Davidson L. A., Experimental control of excitable embryonic tissues: Three stimuli induce rapid epithelial contraction. Exp. Cell Res. 316, 103–114 (2010). [DOI] [PMC free article] [PubMed] [Google Scholar]
- 42.Odell G. M., Oster G., Alberch P., Burnside B., The mechanical basis of morphogenesis. I. Epithelial folding and invagination. Dev. Biol. 85, 446–462 (1981). [DOI] [PubMed] [Google Scholar]
- 43.Takata N., Abbey D., Fiore L., Acosta S., Feng R., Gil H. J., Lavado A., Geng X., Interiano A., Neale G., Eiraku M., Sasai Y., Oliver G., An eye organoid approach identifies Six3 suppression of R-spondin 2 as a critical step in mouse neuroretina differentiation. Cell Rep. 21, 1534–1549 (2017). [DOI] [PMC free article] [PubMed] [Google Scholar]
- 44.Lomakina E. B., Spillmann C. M., King M. R., Waugh R. E., Rheological analysis and measurement of neutrophil indentation. Biophys. J. 87, 4246–58 (2004). [DOI] [PMC free article] [PubMed] [Google Scholar]
- 45.Wen F. L., Wang Y. C., Shibata T., Epithelial folding driven by apical or basal-lateral modulation: Geometric features, mechanical inference, and boundary effects. Biophys. J. 112, 2683–2695 (2017). [DOI] [PMC free article] [PubMed] [Google Scholar]
- 46.Okuda S., Inoue Y., Eiraku M., Sasai Y., Adachi T., Modeling cell proliferation for simulating three-dimensional tissue morphogenesis based on a reversible network reconnection framework. Biomech. Model. Mechanobiol. 12, 987–996 (2013). [DOI] [PubMed] [Google Scholar]
- 47.Okuda S., Inoue Y., Eiraku M., Adachi T., Sasai Y., Modeling cell apoptosis for simulating three-dimensional multicellular morphogenesis based on a reversible network reconnection framework. Biomech. Model. Mechanobiol. 15, 805–816 (2016). [DOI] [PubMed] [Google Scholar]
- 48.Okuda S., Inoue Y., Eiraku M., Sasai Y., Adachi T., Apical contractility in growing epithelium supports robust maintenance of smooth curvatures against cell-division-induced mechanical disturbance. J. Biomech. 46, 1705–1713 (2013). [DOI] [PubMed] [Google Scholar]
- 49.Okuda S., Unoki K., Eiraku M., Tsubota K. I., Contractile actin belt and mesh structures provide the opposite dependence of epithelial stiffness on the spontaneous curvature of constituent cells. Dev. Growth Differ. 59, 455–464 (2017). [DOI] [PubMed] [Google Scholar]
- 50.Inoue Y., Watanabe T., Okuda S., Adachi T., Mechanical role of the spatial patterns of contractile cells in invagination of growing epithelial tissue. Dev. Growth Differ. 59, 444–454 ( 2017). [DOI] [PMC free article] [PubMed] [Google Scholar]
- 51.Inoue Y., Suzuki M., Watanabe T., Yasue N., Tateo I., Adachi T., Ueno N., Mechanical roles of apical constriction, cell elongation, and cell migration during neural tube formation in Xenopus. Biomech. Model. Mechanobiol. 15, 1733–1746 (2016). [DOI] [PMC free article] [PubMed] [Google Scholar]
- 52.Okuda S., Inoue Y., Eiraku M., Adachi T., Sasai Y., Vertex dynamics simulations of viscosity-dependent deformation during tissue morphogenesis. Biomech. Model. Mechanobiol. 12, 413–425 (2015). [DOI] [PubMed] [Google Scholar]
- 53.Fenwick A., Richardson R. J., Butterworth J., Barron M. J., Dixon M. J., Novel mutations in GJA1 cause oculodentodigital syndrome. J. Dent. Res. 87, 1021–1026 (2008). [DOI] [PMC free article] [PubMed] [Google Scholar]
- 54.J. Ahrens, B. Geveci, C. Law, “ParaView: An end-user tool for large data visualization” (Technical Report LA-UR-03-1560, Los Alamos National Laboratory, 2005); https://datascience.lanl.gov/data/papers/ParaView.pdf.
Associated Data
This section collects any data citations, data availability statements, or supplementary materials included in this article.
Supplementary Materials
Supplementary material for this article is available at http://advances.sciencemag.org/cgi/content/full/4/11/eaau1354/DC1
Supplementary Text
Fig. S1. Concept models of optic-cup formation and epithelial bending.
Fig. S2. Versatile 3D vertex model describing multicellular dynamics in 3D space.
Fig. S3. Quantification of optic-cup morphogenesis.
Fig. S4. Quantitative simulations of optic-cup morphogenesis for all of the unknown parameters.
Fig. S5. Comparison between in silico and ex vivo optic-cup formation under perturbations.
Fig. S6. Actomyosin activities in in vivo and ex vivo optic-cup morphogenesis.
Table S1. Main symbols used in the 3D vertex model of optic-cup formation.
Table S2. Standard physical parameter values of cell states in computational simulations of optic-cup formation.
Table S3. Standard physical parameter values of boundary regions in computational simulations of optic-cup formation.
Table S4. Standard physical parameter values of cell behaviors used in computational simulations of optic-cup formation.
Table S5. Varied physical parameter values obtained from computational simulations of optic-cup formation.
Movie S1. Hinged cell shape at the NR-RPE boundary in the in vitro optic cup.
Movie S2. In silico recapitulation of optic-cup morphogenesis using the versatile 3D vertex model.
Movie S3. Cell proliferation, constriction, and apoptosis in in silico optic-cup formation.
Movie S4. Dependence of in silico optic-cup morphogenesis on cell heightening, proliferation, apoptosis, and differentiation.
Movie S5. Dependence of in silico optic-cup morphogenesis on formation of spontaneous curvature of NR.
Movie S6. Pharmacological assays of actomyosin activities in vitro.
Movie S7. Dependence of in silico optic-cup morphogenesis on apical and lateral cell constrictions.
Movie S8. Lateral cell constrictions in vitro.
Movie S9. Characteristic alignment of intracellular actin fibers along the apicobasal axis in vitro.
Movie S10. Elastic and plastic responses of in vitro neuroepithelium to mechanical stimuli.
Movie S11. Calcium response to shear stress on the basal surface in vitro.
Movie S12. Lateral constrictions triggered by local up-regulation of intracellular calcium concentration in vitro.
Movie S13. In silico recapitulation of optic-cup morphogenesis with strain-triggered lateral constriction.