

Summary
Interleukin-2 (IL-2) and downstream transcription factor STAT5 are important for maintaining regulatory T (Treg) cell homeostasis and function. Treg cells can respond to low IL-2 levels, but the mechanisms of STAT5 activation during partial IL-2 deficiency remain uncertain. We identified the serine-threonine kinase Mst1 as a signal-dependent amplifier of IL-2–STAT5 activity in Treg cells. High Mst1 and Mst2 (Mst1–Mst2) activity in Treg cells was crucial to prevent tumor resistance and autoimmunity. Mechanistically, Mst1–Mst2 sensed IL-2 signals to promote the STAT5 activation necessary for Treg cell homeostasis and lineage stability, and to maintain the highly suppressive phosphorylated-STAT5+ Treg cell subpopulation. Unbiased quantitative proteomics revealed association of Mst1 with the cytoskeletal DOCK8–LRCHs module. Mst1 deficiency limited Treg cell migration and access to IL-2, and activity of the small GTPase Rac1, which mediated downstream STAT5 activation. Collectively, IL-2–STAT5 signaling depends upon Mst1–Mst2 functions to maintain a stable Treg cell pool and immune tolerance.
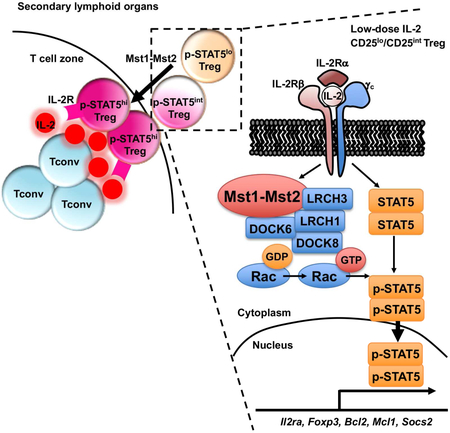
Graphical Abstract
eTOC blurb
Treg cells respond to low IL-2 levels, but how STAT5 is activated under these conditions remains uncertain. Shi et al. demonstrate that the serine/threonine kinases Mst1 and Mst2 sense IL-2 signals to promote STAT5 activation to maintain Treg cell homeostasis, lineage stability, and the highly suppressive phophorylated-STAT5+ Treg cell subpopulation. Therefore, a non-canonical Hippo pathway orchestrates IL-2–STAT5 signaling selectively in Treg cells.
Introduction
Regulatory T (Treg) cells expressing Foxp3 are essential in establishing self-tolerance (Josefowicz et al., 2012). The pool size of Treg cells is a critical component of immune homeostasis and is maintained, in part, by the balance of high rates of proliferation and apoptosis (Liston and Gray, 2014). Lineage stability and phenotypic plasticity of Treg cells also contribute to the maintenance of the peripheral Treg cell pool (Sakaguchi et al., 2013). Interleukin-2 (IL-2) signaling is considered a major regulator for controlling the homeostasis and function of Treg cells (Liao et al., 2013; Malek and Castro, 2010). Mechanistically, IL-2 and transcription factor STAT5 are important for maintaining the expression and stability of Foxp3 (Chinen et al., 2016; Feng et al., 2014; Fontenot et al., 2005). Recent studies have discovered a highly suppressive p-STAT5+ Treg cell subpopulation crucial for the suppression of autoreactive T cells and incipient autoimmunity (Liu et al., 2015). As low-dose IL-2 specifically activates Treg cells to ameliorate autoimmune diseases, there is a growing interest in exploring this new therapeutic strategy (Klatzmann and Abbas, 2015).
IL-2 receptor (IL-2R) complex on both Treg cells and activated conventional T cells consists of three subunits, IL-2Rα (CD25), IL-2Rβ (CD122), and γc (CD132) (Liao et al., 2013; Malek and Castro, 2010). Unlike conventional T cells, Treg cells exhibit a predominant activation of downstream STAT5 over MAPK and PI3K pathways partly due to the high expression of the phosphatase PTEN (Malek and Castro, 2010; Walsh et al., 2006). Treg cells are indexed to a low IL-2 signaling threshold in that they can adapt to low IL-2 for the activation of STAT5 signaling (Yu et al., 2009), although increased CD25 expression only partially accounts for such enhanced sensitivity (Yu et al., 2015a). Moreover, Treg cells are normally kept in a state of partial IL-2 deficiency by the Foxp3-dependent repression of autocrine and paracrine IL-2 production (Liston and Gray, 2014; Malek and Castro, 2010), and can gain access to IL-2 only after its production by autoreactive T cells in close proximity (Liu et al., 2015). How Treg cells effectively utilize the limited local IL-2 under steady state to achieve proper STAT5 activation and the maintenance of p-STAT5+ Treg cell subpopulation remains uncertain.
The serine/threonine kinases Mst1 and Mst2 (Stk4 and Stk3) are two homologous mammalian Ste20-like kinases in the Hippo pathway (Yu et al., 2015b). Loss-of-function mutation for Mst1 causes immunodeficiency and lymphopenia, but also autoimmune manifestations (Abdollahpour et al., 2012; Du et al., 2014; Ueda et al., 2012). The role of Mst1 in mediating immune tolerance is unclear, and could be associated with thymocyte selection (Ueda et al., 2012) or Treg cell development and Foxp3 expression (Du et al., 2014). A profound defect of thymocyte egress due to Mst1 deficiency (Mou et al., 2012) could have confounded interpretation of these observations for peripheral Treg cells. Moreover, downstream effector pathways for Mst1 in Treg cells remain poorly understood. Thus, the roles and signaling mechanisms for Mst1 in peripheral Treg cell function and homeostasis remain elusive.
In this report, we revealed that Mst1–Mst2 amplified IL-2–STAT5 signaling in Treg cells and were crucial to maintain the in vivo highly suppressive p-STAT5+ Treg cell pool. Our study established Mst1–Mst2 as critical regulators of IL-2–STAT5 signaling in Treg cells, through cell-intrinsic and extrinsic mechanisms by potentiating IL-2R–STAT5 signal strength and promoting access to IL-2, respectively, to reinforce Treg cell lineage stability and functional integrity.
Results
Mst1 is activated by IL-2 and contributes to Treg cell function
To identify regulators of IL-2–STAT5 signaling in Treg cells, we performed a small-scale kinase inhibitor screening in Treg cells stimulated with IL-2 in vitro. As expected, inhibition of JAK3 activity impaired STAT5 phosphorylation (Table S1), while inhibition of multiple kinases involved in common signaling pathways (e.g. p38, JNK, AKT, mTORC1, PDK1, PI3K, ERK and IKK (Figure 1A and Table S1)) had minimal effects. In contrast, XMU-MP-1, an inhibitor of Mst1 (Fan et al., 2016), suppressed IL-2-mediated STAT5 phosphorylation (Figure 1A), as well as induction of STAT5 target genes Bcl2, Foxp3, Cish and Socs2 (Lin et al., 2012) (Figure S1A). As a central kinase of Hippo signaling, Mst1 induces autophosphorylation and phosphorylation of the downstream target Mob1 (Yu et al., 2015b), but upstream signals for Mst1 remain largely elusive. IL-2 stimulation of Treg cells resulted in rapid phosphorylation of Mst1 and Mob1 (Figure 1B). Additionally, freshly isolated CD4+CD25+ Treg cells had higher Mst1 phosphorylation relative to Mst1 expression than naïve CD4+ T cells (Figure 1C). Therefore,Mst1 likely plays a role by sensing IL-2 to facilitate STAT5 activation in Treg cells.
Figure 1. Mst1 is activated by IL-2 in Treg cells and contributes to Treg function in vivo.

(A) CD4+CD25+ Treg cells were pretreated with vehicle or indicated kinase inhibitors for 30 min at 37°C, and then stimulated with 5 U/ml IL-2 for 30 min for p-STAT5 phosflow analysis. Numbers in graphs indicate mean fluorescence intensity (MFI). (B) Treg cells were rested for 2 h at 37°C, followed by IL-2 stimulation for immunoblot analysis of p-STAT5, p-Mst1 and p-Mob1. p-Mst1 (n = 5) and p-Mob1 (n = 3) at 5, 15 and 30 min were quantified after normalization to 0 min. (C) Immunoblot analysis of p-Mst1 in freshly isolated Treg cells and CD4+ naïve T cells. p-Mst1 vs. Mst1 was quantified between naïve T cells and Treg cells (n = 5). (D) Tumor growth curve in Foxp3Cre and Foxp3CreStk4f/f mice following inoculation of MC38 cells (n = 5). Data in plots indicate means ± s.e.m. NS, not significant; *P < 0.05, **P < 0.01, ***P < 0.001; two-tailed unpaired Student’s t test (B–D). Data are representative of at least 2 independent experiments (A–D). See also Figure S1 and Table S1.
Due to the potential off-target effects of pharmacological inhibitors, we next crossed mice carrying loxP-flanked Mst1 (Stk4f/f) with those expressing YFP-Cre from the Foxp3 locus (Foxp3Cre) to delete Mst1 in Treg cells (Figure S1B). Treg cells represent a major barrier to effective antitumor immunity due to, in part, their role as an IL-2 ‘sink’ to limit effector T cell responses in tumor (Liu et al., 2016). We therefore inoculated Foxp3CreStk4f/f or Foxp3Cre mice with MC38 colon adenocarcinoma cells. Tumor growth was strongly inhibited in Foxp3CreStk4f/f mice, suggesting that Mst1-deficient Treg cells were unable to inhibit antitumor immunity (Figure 1D).
Ablation of Mst1–Mst2 in Treg cells causes fatal autoimmunity
We next determined the requirement of Hippo signaling in Treg cells in maintaining self-tolerance. Given the possible functional redundancy of Mst1 and Mst2, we generated Foxp3CreStk4f/fStk3f/f mice, in which both Mst1 and Mst2 were deleted in Treg cells. Since haplo-insufficiency of Mst1 or Mst2 in Treg cells had no obvious defects (data not shown), mice with heterozygous loss of Mst1, Mst2 or both were used as controls (referred to as Foxp3Cre). As early as 4-6 weeks after birth, Foxp3CreStk4f/fStk3f/f mice spontaneously developed a Scurfy-like multi-organ autoimmunity characterized by small body size, dermatitis, and ear and eyelid crusting (Figure 2A), and ultimately succumbed to early death (Figure 2B). Foxp3CreStk4f/fStk3f/f mice had increased serum anti-dsDNA autoantibodies (Figure 2C), splenomegaly, lymphadenopathy (Figure 2D), and extensive inflammatory infiltrates in multiple non-lymphoid organs (Figure 2E). Thus, Treg cell-specific deletion of Mst1 and Mst2 leads to a fatal early-onset autoimmune disease.
Figure 2. Loss of Mst1–Mst2 in Treg cells leads to early-onset fatal autoimmunity.

(A) Representative images of 1.5-month-old WT (Foxp3Cre) and Foxp3CreStk4f/fStk3f/f mice. The arrow denotes dermatitis. (B) Survival curves of Foxp3Cre and Foxp3CreStk4f/fStk3f/f mice (n = 23).(C) ELISA quantification of serum dsDNA antibodies in 1.5-month-old Foxp3Cre (n = 9) and Foxp3CreStk4f/fStk3f/f (n = 8) mice. (D) Representative images of spleen and peripheral lymph nodes from 1.5-month-old Foxp3Cre and Foxp3CreStk4f/fStk3f/f mice. (E) H&E staining of liver, skin and lung sections from 1.5-month-old Foxp3Cre and Foxp3CreStk4f/fStk3f/f mice. Scale bars, 200 mm. (F) Frequencies and numbers of splenic CD4+ and CD8+ T cells from 1.5-month-old Foxp3Cre and Foxp3CreStk4f/fStk3f/f mice (n ≥ 4). (G) Flow cytometry analysis of CD62L and CD44 expression on splenic CD4+ and CD8+ T cells from 1.5-month-old Foxp3Cre and Foxp3CreStk4f/fStk3f/f mice (left). Right, frequency of CD44+CD62L− population in CD4+ or CD8+ T cells (n = 4). (H) Flow cytometry analysis of IFN-γ, IL-4 and IL-17 expression in splenic CD4+ T cells (left) and IFN-γ in splenic CD8+ T cells (right) of 1.5-month-old Foxp3Cre and Foxp3CreStk4f/fStk3f/f mice (n = 4). (I) Fold changes of IFN-γ, IL-4, and IL-17 production in splenic CD4+ T cells of Foxp3CreStk4f/fStk3f/f vs. Foxp3Cre mice (n = 5). (J) Flow cytometry analysis of YFP+ Treg cells in the spleen of 1-month-old and 2-month-old Foxp3Cre and Foxp3CreStk4f/fStk3f/f mice. (K) Number of splenic YFP+ cells from 1- and 2-month-old Foxp3Cre and Foxp3CreStk4f/fStk3f/f mice (n = 3). Numbers in quadrants or gates indicate percentage of cells. Data in plots indicate means ± s.e.m. NS, not significant; **P < 0.01, ***P < 0.001, ****P < 0.0001; Log Rank test (B), two-tailed unpaired Student’s t test (C, F, G, K), or one-way ANOVA (I). Data are representative of at least 3 independent experiments (A, D, E, G, H, J) or pooled from 3 experiments (B, C, F, I, K). See also Figures S1 and S2.
We next assessed the development and homeostasis of the immune system. Unlike the severe defects in thymocyte egress upon the loss of Mst1–Mst2 in all T cells (Mou et al., 2012), young Foxp3CreStk4f/fStk3f/f mice showed normal development and maturation of thymocytes (Figure S1C), including YFP-Foxp3+ Treg cells (Figure S1D). Foxp3CreStk4f/fStk3f/f mice had increased cellularity and frequency of CD8+ T cells in the spleen, but comparable number and decreased frequency of CD4+ T cells (Figure 2F). Foxp3CreStk4f/fStk3f/f mice also contained higher proportions (Figure 2G) and numbers (Figure S1E) of effector–memory (CD44+CD62L−) CD4+ and CD8+ cells, with greatly increased IFN-γ and modestly increased IL-4 and IL-17 (Figures 2H and 2I). Also, Mst1–Mst2-deficient Treg cells had much higher IFN-γ expression, relative to the modestly enhanced IL-17 and IL-4 (Figure S1F). Treg cell number was largely comparable between Foxp3Cre and Foxp3CreStk4f/fStk3f/f mice at one month old, but as autoimmunity progressed, the frequency and number of Treg cells were reduced in peripheral lymphoid organs in Foxp3CreStk4f/fStk3f/f mice (Figures 2J and 2K). These results indicate that Mst1 and Mst2 are essential for Treg cell-mediated control of peripheral T cell activation, especially CD8+ and Th1 responses.
Given these observations, we tested the role of IFN-γ in autoimmunity by crossing Foxp3CreStk4f/fStk3f/f mice onto the Ifng−/− background. IFN-γ deletion did not rescue overall autoimmunity in Foxp3CreStk4f/fStk3f/f mice, which still showed early death (data not shown) and T cell hyper-activation (Figures S2A and S2B). Because of the role of Treg cells in the control of follicular helper T (Tfh) cells that can be further linked to Th1 responses (Huynh et al., 2015; Shrestha et al., 2015), we measured Tfh responses. Greater frequency and number of Tfh cells were found in the spleen of Foxp3CreStk4f/fStk3f/f mice, and IFN-γ deletion substantially reduced the excessive development of Tfh cells (Figure S2C). Hence, IFN-γ contributes to elevated Tfh responses, but is largely dispensable for the excessive inflammation in Foxp3CreStk4f/fStk3f/f mice.
To determine the relative importance of Mst1 and Mst2 for Treg cell function, we analyzed mice with Treg cell-specific deletion of either Mst1 (Foxp3CreStk4f/f) or Mst2 (Foxp3CreStk3f/f). Foxp3CreStk3f/f mice did not develop any obvious defects, while Foxp3CreStk4f/f mice developed a mild autoimmune disease that was less severe than Foxp3Cre Stk4f/fStk3f/f mice (data not shown). Accordingly, we observed a modest increase of the proportion of effector–memory CD4+ and CD8+ T cells and Treg cells (Figures S2D and S2E), as well as elevated IFN-γ but not IL-17 or IL-4 production from conventional T cells (Figures S2F and S2G), in 1.5-month-old Foxp3CreStk4f/f mice. In contrast to Foxp3CreStk4f/f mice, Foxp3CreStk3f/f mice showed no signs of T cell hyper-activation, while Foxp3CreStk4f/fStk3f/f mice showed much more profound defects (Figures S2D-S2G). Therefore, loss of Mst1 in Treg cells is sufficient for inducing T cell activation, although to a lesser extent than deletion of both Mst1 and Mst2, and points to the critical effect of the graded activity of Mst-Hippo signaling in Treg cells.
Mst1–Mst2 mediate IL-2-induced STAT5 activation in Treg cells
To gain insight into cell-intrinsic defects in Mst1–Mst2-deficient Treg cells, we generated mixed bone marrow (BM) chimeras to circumvent the potential secondary effects caused by inflammation in Foxp3CreStk4f/fStk3f/f mice, and purified Mst1–Mst2-deficient or control Treg cells for transcriptome analysis (Figure 3A). Functional pathway enrichment analysis showed that IL-2–STAT5 signaling was the most significantly downregulated pathway in Mst1–Mst2-deficient Treg cells (Figure 3B). To verify these results, we overlaid our gene expression profiles with the dataset from peripheral Treg cells from IL-2RβWT/Thymus mice (GSE14350), which had impaired IL-2 signaling but without autoimmunity (Yu et al., 2009). Gene expression changes due to Mst1–Mst2 deficiency were positively correlated (P = 6.2e-10) with those in IL-2Rβ-deficient Treg cells (Figure 3C). Moreover, both Mst1–Mst2 and IL-2Rβ-deficient Treg cells downregulated Treg cell-associated effector molecules Nrp1, Klrg1, Itgae, Il10, and Fgl2, and altered expression of factors involved in immune function, cell adhesion, cytoskeletal reorganization and apoptosis (Figure S3A). Thus, Mst1–Mst2 deficiency impairs IL-2-mediated gene signatures in Treg cells.
Figure 3. IL-2 target gene expression and STAT5 activation are reduced in Mst1–Mst2-deficient Treg cells.

(A) Number of differentially expressed genes (> 0.5 log2 difference) from the transcriptome analysis of WT and Mst1–Mst2-deficient Treg cells isolated from mixed BM chimeras (Foxp3Cre, n = 5; Foxp3CreStk4f/fStk3f/f, n = 4). (B) Functional enrichment of downregulated genes in Mst1–Mst2-deficient Treg cells using the Hallmarks database (MSigDB). BH_FDR, Benjamini-Hochberg false positive rate. (C) Empirical cumulative distribution function for the change in expression (log2 values) of all genes (black line) expressed in WT Treg cells (change relative to that in Mst1–Mst2-deficient Treg cells) and for subsets of genes upregulated (red line) or downregulated (blue line) by IL-2Rβ deficiency in Treg cells (Yu et al., 2009). (D) Flow cytometry analysis and statistics of p-STAT5+ cell frequency in WT and Mst1–Mst2-deficient YFP+ Treg cells from mixed BM chimeras (n = 4). Numbers in gates indicated percentage of cells. (E) Statistics of p-STAT5+ cell frequency in WT or Mst1-deficient Treg cells (n = 3) stimulated with IL-2 for 30 min. (F) Immunoblot analysis of p-STAT5, STAT5, p-S6, p-ERK and p-AKT in WT and Mst1-deficient Treg cells upon 1 U/ml IL-2 stimulation. (G) WT or Mst1–Mst2-deficient naïve CD4+ T cells (from Cd4Cre or Cd4CreStk4f/fStk3f/f mice) were stimulated by plate-bound anti-CD3-CD28 for 3 days and rested for another 3 days in IL-2 to generate T cell blasts. T cell blasts were rested without IL-2 for 8 h at 37°C followed by 1 U/ml IL-2 stimulation, and analyzed by immunoblot. (H) Activated CD4+ T cell blasts were generated as in (G). Mst1 protein and p-Mob1 were examined in activated T cell blasts and freshly isolated Treg cells from WT mice by immunoblot (n = 4). (I) Representative images of p-STAT5 nuclear translocation in WT and Mst1–Mst2-deficient Treg cells from mixed BM chimeras in response to IL-2 stimulation for 0 and 30 min (left). Right, quantification of p-STAT5 nuclear immunofluorescence signal in WT and Mst1–Mst2-deficient Treg cells with IL-2 stimulation for 0 and 30 min (n > 30). (J) Flow cytometry analysis and statistics of CD25 expression on WT and Mst1-deficient Treg cells (n = 4). Numbers in graph indicate MFI. The relative CD25 MFI was calculated by normalizing the value in WT Treg cells to 1. (K) Statistical analysis of p-STAT5 vs. CD25 expression in WT and Mst1-deficient Treg cells upon 1 U/ml IL-2 stimulation for 30 min (n = 3). Data in plots indicate means ± s.e.m. NS, not significant; *P < 0.05, **P < 0.01, ****P < 0.0001; two-tailed unpaired Student’s t test (D, E, H, J, K), one-way ANOVA (I). Data are from one experiment (A–C), representative of at least 2 independent experiments (D, F–J) or pooled from 3 experiments (E, K). See also Figure S3.
To test if IL-2 signaling is defective in Mst1–Mst2-deficient Treg cells in vivo, we analyzed p-STAT5, which is expressed by a subpopulation of Treg cells with highly suppressive activity (Liu et al., 2015). The percentage of Treg cells expressing p-STAT5 was reduced in the absence of Mst1–Mst2 (Figure 3D). We next measured IL-2-induced STAT5 phosphorylation using Treg cells from young Foxp3CreStk4f/f mice, which had no substantial T cell hyper-activation, and found reduced p-STAT5 signal in Mst1-deficient Treg cells in response to a broad range of IL-2 doses, especially in the low concentration ranges (Figure 3E). In immunoblot analysis, Mst1-deficient Treg cells had defective STAT5 phosphorylation but retained normal MAPK and PI3K–AKT activities in response to IL-2 stimulation (Figures 3F and S3B). Furthermore, Treg cells from Foxp3CreStk4f/fStk3f/f mice showed a more pronounced reduction of IL-2-induced STAT5 activation than Mst1-deficient Treg cells (Figure S3C), and this was also observed in Treg cells from mixed BM chimeras (Figure S3D), indicating dose-dependent and cell-intrinsic effects of Mst1–Mst2 signaling on IL-2–STAT5 signaling. We also found that Mst1-deficient Treg cells had defects in IL-15-induced, but not IL-7-induced, STAT5 activation (Figure S3E), in line with the common signaling machinery mediating IL-2 and IL-15 signals, namely IL-2Rβ and IL-2Rγ (Malek and Castro, 2010). As IL-15 is unable to compensate for the loss of IL-2 signaling in Treg cells in the periphery (Chinen et al., 2016), the IL-2 signaling defect in Mst1-deficient Treg cells likely played a more functional role, and this also raised the question concerning the role of Mst1 in conventional T cells. To this end, we activated naïve CD4+ T cells from Cd4CreStk4f/fStk3f/f mice with anti-CD3-CD28 to generate T cell blasts, followed by resting and IL-2 stimulation. Mst1–Mst2-deficient T cell blasts had normal activation of STAT5 and PI3K–mTOR (Figures 3G, S3F and S3G). To uncover the mechanism underlying differential responses to IL-2 in Mst1-deficient Treg cells and T cell blasts, we examined Mst1 expression and activity (Mob1 phosphorylation), which were considerably lower in T cell blasts than freshly isolated Treg cells (Figure 3H). Thus, Mst1–Mst2 signaling selectively mediates IL-2-induced STAT5 activation in Treg cells.
Because p-STAT5 translocates to the nucleus after IL-2 stimulation (Malek and Castro, 2010), we examined p-STAT5 nuclear translocation. Nuclear p-STAT5 levels were increased upon IL-2 stimulation in control Treg cells, but this effect was not observed in Treg cells lacking Mst1–Mst2 (Figure 3I) or Mst1 (Figure S3H). STAT5 binds to the promoter of Il2ra to upregulate CD25 expression and reinforce IL-2–STAT5 signaling by forming a feed-forward signaling loop (Liao et al., 2013; Malek and Castro, 2010). Consistent with the defective IL-2-induced STAT5 activation, Mst1-deficient Treg cells had reduced CD25 expression (Figure 3J), indicating disrupted IL-2–STAT5 signaling loop. In contrast, we found largely normal CD25 expression on Mst1–Mst2-deficient T cell blasts (Figure S3I). To test whether the reduction of p-STAT5 in Mst1-deficient Treg cells was secondary to defective CD25 expression, we compared IL-2-induced p-STAT5 signals in Treg cells expressing different levels of CD25. Except for cells with the highest levels of CD25, p-STAT5 was reduced in Mst1-deficient Treg cells compared with control cells, even at the same CD25 levels (Figure 3K), suggesting that Mst1 can modulate IL-2–STAT5 signaling independent of CD25 expression. Moreover, STAT5 activation was dampened by acute Mst1 inhibition (Figure 1A), despite normal CD25 expression (Figure S3J). CD122 is another IL-2 receptor and its expression is partially dependent upon IL-2 signaling in Treg cells (Chinen et al., 2016; Fontenot et al., 2005). CD122 expression was comparable between Treg cells from Foxp3Cre and Foxp3CreStk4f/f mice (Figure S3K, left) and reduced on Mst1-deficient Treg cells from mixed BM chimeras (Figure S3K, right), while STAT5 activation was defective in Mst1-deficient Treg cells from both systems (Figures S3C and S3D). These results collectively indicate an intrinsic role of Mst1 in mediating and amplifying IL-2–STAT5 signaling in Treg cells.
Mst1–Mst2 are required for Treg cell survival and expansion in response to IL-2
IL-2 signaling is critical for the homeostasis of Treg cells, and loss of IL-2 or IL-2R diminishes the Treg cell pool (Chinen et al., 2016; Fontenot et al., 2005). To determine cell-intrinsic effects of Mst1–Mst2 deletion on Treg cells, we first examined Treg cell population in female Foxp3Cre/+Stk4f/fStk3f/f mice, in which approximately half Treg cells were Mst1–Mst2-sufficient due to random inactivation of the X chromosome that contains the Foxp3Cre allele, thereby preventing autoimmunity. Mst1–Mst2-deficient Treg cells were significantly underrepresented compared to littermate controls (Foxp3Cre/+Stk4f/+Stk3f/+) (Figure 4A). Additionally, in mixed chimeras reconstituted with CD45.1+ and Foxp3CreStk4f/fStk3f/f BM cells, CD45.2+ Mst1–Mst2-deficient Treg cells were decreased in peripheral lymphoid organs (Figure S4A), and a less severe phenotype was observed for Mst1-deficient Treg cells (Figure S4B). Treg cells constitutively express OX40, so we also used a Tnfrsf4Cre (Tnfrs4f encodes OX40) deletion system and found that in mixed BM chimeras, CD45.2+ Mst1–Mst2-deficient Treg cells were severely reduced in peripheral lymphoid organs (Figure S4C). The results from these inflammation-free models indicate a cell-autonomous requirement of Mst1–Mst2 for the maintenance of the peripheral Treg cell pool.
Figure 4. Mst1–Mst2-deficient Treg cells show defective IL-2-induced survival and expansion.

(A) Flow cytometry analysis of YFP+ Treg cells in the spleen of female Foxp3Cre/+ and Foxp3Cre/+Stk4f/fStk3f/f mice (left). Right, frequency and number of YFP+ Treg cells (n = 4). (B) Proliferation (Ki67+) and apoptosis (active caspase 3+) of splenic YFP+ Treg cells of Foxp3Cre/+ and Foxp3Cre/+Stk4f/fStk3f/f mice (n = 4). (C) Flow cytometry analysis of 7-AAD and Annexin V (left) and frequency of live cells (7-AAD−AnnexinV−) (right) in WT and Mst1-deficient Treg cells with or without IL-2 stimulation for 24 h (n ≥ 4). (D) Real-time PCR analysis of Mcl1 and Bcl2 mRNA expression in WT and Mst1-deficient Treg cells stimulated with or without IL-2 for 12 h (n = 3). (E) Female Foxp3Cre/+ and Foxp3Cre/+Stk4f/fStk3f/f mice were administered with IL-2–α-IL-2 (JES6-1) complex (IL-2c) daily for 3 days and YFP+ Treg cells were analyzed at day 5. The fold increase of the frequency (left) and number (right) of splenic Treg cells in response to IL-2c (IL-2c vs. no IL-2c treatment) was calculated and presented for WT and Mst1–Mst2-deficient mice (n = 3). Data in plots indicate means ± s.e.m. NS, not significant; *P < 0.05, **P < 0.01, ***P < 0.001; two-tailed unpaired Student’s t test (A, B, E) or one-way ANOVA (C, D). Data are representative of 3 independent experiments (A, C) or pooled from at least 2 experiments (B, D, E). See also Figure S4.
To determine if loss of Treg cells is linked to defective proliferation or survival, we analyzed the frequency of Ki67+ or active caspase 3+ cells, respectively. We found that cell survival, but not proliferation, was impaired in the absence of Mst1–Mst2 (Figures 4B and S4D). Accordingly, the pro-apoptotic factor Bim was upregulated (Figure S4E). Upon IL-2 stimulation in vitro, Mst1-deficient Treg cells had a decreased percentage of live cells (Figure 4C). Moreover, Mst1-deficient Treg cells showed impaired IL-2-induced upregulation of Mcl1 and Bcl2 (Figure 4D). Thus, IL-2-induced Treg cell survival requires Mst1–Mst2 signaling.
The critical dependence of Treg cells on IL-2 leads to the development of low-dose IL-2 therapy to expand Treg cells in preclinical models and clinical trials (Klatzmann and Abbas, 2015). To test the effect of Mst1–Mst2 deficiency on IL-2-induced Treg cell expansion, we administered IL-2–α-IL-2 complex to female Foxp3Cre/+Stk4f/fStk3f/f mice. The fold changes of Treg cell frequency and number upon IL-2–α-IL-2 treatment were significantly reduced in Mst1–Mst2-deficient Treg cells compared with WT counterparts in the spleen (Figure 4E). Similar defects were found in the blood and lymph nodes (Figure S4F). Altogether, associated with the impaired Treg cell pool, Mst1–Mst2-deficient Treg cells have reduced survival and expansion in response to IL-2 stimulation.
IL-2-induced Foxp3 expression and Treg cell lineage stability depend upon Mst1–Mst2
STAT5, by directly binding the CNS2 region of the Foxp3 gene, regulates the inheritable stability of Foxp3 expression (Feng et al., 2014). Foxp3 mRNA (indicated by the co-expressed YFP) and protein (intracellular Foxp3 staining) were both reduced in Treg cells from female Foxp3Cre/+Stk4f/fStk3f/f mice (Figure 4A) and CD45.2+ Treg cells from mixed BM chimeras (Figure S5A). CD45.2+ Treg cells from Foxp3CreStk4f/fStk3f/f mixed chimeras also produced excessive amount of IFN-γ and IL-17 (Figure S5B), further supporting the cell-autonomous defects in the stability of Treg cells lacking Mst1–Mst2. Treg cells losing Foxp3 expression (ex-Treg cells) accumulate upon Treg cell division in response to TCR stimulation in vitro, which could be prevented by IL-2 (Feng et al., 2014). To directly test the role of Mst1–Mst2 in maintaining Treg cell stability, we used an in vitro Treg cell stability assay (Feng et al., 2014), and found a significantly elevated percentage of YFP-Foxp3− Treg cells in Mst1–Mst2-deficient cells (Figure 4B). Upon Treg cell transfer into Rag1−/− mice, there was a significant reduction of donor-derived Mst1–Mst2-deficient cells (Figure S5C), consistent with the survival defect. More importantly, among the survived donor cells, Mst1–Mst2-deficient Treg cells had profoundly lost Foxp3 expression (Figure S5D), indicative of loss of Treg cell lineage stability in vivo. To further test this notion, we co-transferred WT or Mst1–Mst2-deficient Treg cells into Rag1−/− mice, together with CD4+CD25− congenically marked conventional T cells. In this model, whereas the majority of WT Treg cells maintained lineage integrity, only 20% of Mst1–Mst2-deficient Treg cells remained Foxp3+ (Figure 4C). Mst1–Mst2-deficient Treg cells also showed increased IFN-γ production (Figure 4D). We next determined lineage stability of Treg cells using a fate-mapping genetic model based on Foxp3Cre-mediated heritable expression of GFP from the ROSA26 locus (Zeng et al., 2013). Foxp3CreStk4f/fStk3f/f mice had an increased frequency of GFP+YFP− population (ex-Treg cells) relative to total mature GFP+ Treg cells (Figure S5E), indicating the loss of Foxp3 expression. Collectively, our results indicate that Mst1–Mst2 maintain the Treg cell pool, in part, by regulating Treg cell lineage stability.
To explore the underlying mechanisms, we examined Foxp3 and CD25 regulation. IL-2-induced Foxp3 and Il2ra upregulation was dampened by Mst1 deficiency (Figure 5E). We noticed that the reduction of Foxp3 expression due to Mst1–Mst2 deficiency was more pronounced in the CD25lo subpopulation (Figure 5F), suggesting that Mst1–Mst2 might be particularly important for maintaining Foxp3 expression in response to low IL-2 signal inputs. Consistent with this idea, Mst1-deficient Treg cells had reduced expression of CD25 and Foxp3 after IL-2 stimulation, and the defects were more prominent in response to low-dose IL-2 stimulation (Figure 5G). Upon treatment with IL-2–α-IL-2 complex in vivo, Foxp3 and CD25 induction in Mst1–Mst2-deficient Treg cells was also impaired (Figure S5F). Together, Mst1–Mst2 are crucial sensors of low-dose IL-2-mediated signal to support Foxp3 and CD25 expression in vitro and in vivo.
Figure 5. Mst1–Mst2-deficient Treg cells show impaired IL-2-mediated Foxp3 expression and lineage stability.

(A) Flow cytometry analysis and statistics of YFP-Foxp3 and Foxp3 protein expression in splenic YFP+ Treg cells of Foxp3Cre/+ and Foxp3Cre/+Stk4f/fStk3f/f mice. YFP-Foxp3 and Foxp3 protein expression in Foxp3Cre/+ mice was normalized to 1. (B) YFP+ Treg cells from 1-month-old Foxp3Cre and Foxp3CreStk4f/fStk3f/f mice were stimulated with plate-bound anti-CD3-CD28 and IL-2 for 4 days and analyzed for YFP expression (left). Right, frequency of YFP− cells (n = 3). (C) YFP+ Treg cells from Foxp3Cre and Foxp3CreStk4f/fStk3f/f mice were adoptively transferred into Rag1−/− mice, together with CD4+ T cells from C57BL/6 mice. YFP+ Treg frequency in WT and Mst1–Mst2-deficient Treg cells was analyzed by flow cytometry 2 weeks later (n = 4). PLN, peripheral lymph nodes; MLN, mesenteric lymph nodes. (D) As in (C), IFN-γ production in WT and Mst1–Mst2-deficient Treg cells was analyzed by flow cytometry (n = 4). (E) Real-time PCR analysis of Foxp3 and Il2ra mRNA expression in WT and Mst1-deficient Treg cells stimulated with or without IL-2 for 12 h (n = 3). (F) Flow cytometry analysis and statistics of Foxp3 expression in CD25hi and CD25lo WT and Mst1–Mst2-deficient Treg cells from Foxp3Cre/+ and Foxp3Cre/+Stk4f/fStk3f/f mice (n = 4). (G) Flow cytometry analysis and statistics of CD25− and Foxp3− cell frequencies in WT and Mst1-deficient Treg cells (n ≥ 4) stimulated with IL-2 for 3 days. (H) YFP+ Treg cells from Foxp3Cre and Foxp3CreStk4f/fStk3f/f mice (n ≥ 3) were stimulated with anti-CD3-CD28+IL-2 for 20 h, followed by control or STAT5CA retrovirus transduction. After 60 h, Treg cells were subjected to in vitro stability assay as in (B), and YFP-Foxp3 and IFN-γ expression in transduced Treg cells was examined 4.5 days later. (I) YFP+ Treg cells from Foxp3Cre and Foxp3CreStk4f/f mice were stimulated with anti-CD3-CD28+IL-2 for 20 h, followed by control or STAT5CA retrovirus transduction. After 60 h, Treg cells were adoptively transferred into Rag1−/− mice (Foxp3Cre, n = 3; Foxp3CreStk4f/f, n = 4), and YFP-Foxp3 and IFN-γ expression by YFP+ Treg cells was analyzed in transduced cells by flow cytometry 10 days later. Numbers in graphs indicate MFI. Numbers in gates indicate percentage of cells. Data in plots indicate means ± s.e.m. NS, not significant; *P < 0.05, **P < 0.01, ***P < 0.001, ****P < 0.0001; two-tailed unpaired Student’s t test (A–D, F, G) or one-way ANOVA (E, H, I). Data are representative of 2 independent experiments (A, B, F, G) or pooled from 2 experiments (C–E, H, I). See also Figure S5.
To test whether the impaired lineage stability of Mst-deficient Treg cells results from reduced STAT5 activation, we introduced constitutively active STAT5 (STAT5CA) into Treg cells. STAT5CA suppressed the increased YFP-Foxp3− Treg cells both in vitro (Figure 5H, left) and in vivo (Figure 5I, left) caused by Mst1–Mst2 or Mst1 deletion, as well as enhanced IFN-γ production (Figures 5H and 5I, right panels). STAT5CA also restored the impaired CD25 expression on Mst1-deficient Treg cells (Figure S5G). These results indicate that reduced STAT5 activation is a main contributor to impaired stability of Mst1-deficient Treg cells.
Mst1 acts independently of conventional Hippo targets and promotes Treg cell access to IL-2
In conventional Hippo signaling, the nuclear co-factors Yap (encoded by Yap1) and Taz (Wwtr1) mediate Mst signaling (Yu et al., 2015b). To dissect the roles of the conventional Hippo targets, we analyzed Foxp3CreYap1f/fWwtr1f/f mice. Foxp3CreYap1f/fWwtr1f/f mice did not develop autoimmune-like phenotypes (data not shown). There was no substantial alteration of conventional T cell homeostasis in Foxp3CreYap1f/fWwtr1f/f mice, except for a small increase in lFN-γ (Figure S6A) and the effector–memory population (Figure S6B). Similarly, no major alterations were found in Foxp3CreYap1f/f (Figures S6C and S6D) or Foxp3CreWwtr1f/f mice (Figures S6E and S6F). Moreover, the frequency of Foxp3+ Treg cells was comparable among control and Foxp3CreYap1f/fWwtr1f/f, Foxp3CreYap1f/f or Foxp3CreWwtr1f/f mice (Figures S6G–S6I). Finally, IL-2-induced STAT5 activation was normal in Yap- or Taz-deficient Treg cells (Figures S6J and S6K). Therefore, in contrast to the fatal autoimmunity in Foxp3CreStk4f/fStk3f/f mice, the largely unaltered immune homeostasis in Yap- or Taz-deficient mice suggests that the conventional Hippo pathway is unlikely to mediate Mst signaling in Treg cells.
To investigate the molecular mechanisms of Mst1 signaling in Treg cells, we performed a quantitative interaction proteomics (interactome) analysis using affinity purification coupled with mass spectrometry (AP-MS). To obtain a large number of Treg cells for interaction proteomics, we generated Treg cells in vitro by activating WT naïve CD4+ T cells with anti-CD3-CD28 antibodies in the presence of TGF-β and IL-2, and then immunoprecipitated endogenous Mst1 from whole cell lysates. Similar to thymic-derived Treg cells, in vitro-derived Mst1–Mst2-deficient Treg cells showed reduced IL-2-induced STAT5 phosphorylation (Figure S7A) and Foxp3 expression (Figure S7B). For interaction proteomics (Tan et al., 2017) (Figure S7C), we identified a total of 167 proteins predicted to interact with Mst1 (Figure 6A), including known Hippo pathway proteins, such as RASSF proteins, SAV1, LATS1 and TAOK2 (Yu et al., 2015b). To identify signaling circuits, we used a composite protein-protein interaction (PPI) database and identified a total of 22 modules from the Mst1 interactome (Table S2), with STK4–SAV1 and DOCK8–LRCHs (DOCK6, DOCK8, LRCH1 and LRCH3) complexes as two of the largest functional modules (Figure 6B). We further validated the interaction between Mst1 and DOCK8 using in vitro-derived and freshly isolated Treg cells (Figure 6C).
Figure 6. Mst1 is associated with the DOCK8–LRCHs module in Treg cells and promotes access to IL-2 in vivo.

(A) Volcano plot of log2 (fold change) and log10 (P-value) to compare proteins identified in the immunoprecipitates by Mst1 antibody vs. IgG control, with the selective Mst1-interacting proteins annotated. (B) Protein-protein interaction modules mediated by Mst1. Lower left, five of the largest modules found in the Mst1 interactome; upper right, a closer view of the STK4–SAV1 module; and lower right, a closer view of the DOCK8–LRCHs module. Detailed information of all modules is listed in Table S2. (C) Immunoblot of DOCK8 and Mst1 after immunoprecipitation with IgG or Mst1 antibody or total extracts (input) of in vitro-derived Treg cells and freshly isolated Treg cells (after expansion by IL-2–α-IL-2 complex). (D) WT or Mst1-deficient YFP+ Treg cells (5×10⁵) from Foxp3Cre and Foxp3CreStk4f/f mice were adoptively transferred into WT congenic CD45.1+ mice (n = 6), together with 1×10⁶ CD45.2+CD8+ T cells (for normalization). After 5 h, the ratio of CD45.2+CD4+ Treg cells vs. CD45.2+CD8+ T cells was analyzed in spleen, PLN, MLN and blood and then normalized with the starting ratio before transfer (1:2). (E) Spleens of young (< 6 weeks old) Foxp3Cre and Foxp3CreStk4f/f mice were analyzed by immunofluorescence. Splenic T cell zone was determined by regions inside of T cell zone (CD3+ rich), circumscribed by B220+ cell-rich marginal zone. Quantification of YFP+ Treg number per area of T cell zone (n = 5) is shown. (F) After in vivo T cell labeling with CD4-PE, splenocytes of Foxp3Cre and Foxp3CreStk4f/f mice were analyzed by flow cytometry for YFP-Foxp3 and CD4-PE expression. Frequencies of YFP+ Treg cells (n = 3) labeled in vivo with CD4-PE (in red pulp/marginal zone (RP/MZ)) and not labeled with CD4-PE (in white pulp (WP)) are shown. (G) WT or Mst1-deficient YFP+ Treg cells (1×10⁶) from Foxp3Cre and Foxp3CreStk4f/f mice were adoptively transferred into WT CD45.1+ mice (n ≥ 5). Cell localization in different regions of spleen (determined by in vivo PE labeling, as in (F)) was examined by flow cytometry for transferred Treg cells recovered at 36 h after injection. (H) As in (F), frequency of p-STAT5+ population in YFP+ Treg cells from different regions (labeled with or without CD4-PE) of the spleen in Foxp3Cre and Foxp3CreStk4f/f mice (n = 3) was analyzed. (I) As in (G), frequency of p-STAT5+ population in CD45.2+YFP+ Treg cells from different regions of spleen (labeled with or without CD4-PE) in Foxp3Cre (n = 5) and Foxp3CreStk4f/f mice (n = 6) was analyzed. Data in plots indicate means ± s.e.m. NS, not significant; *P < 0.05, ***P < 0.001; two-tailed unpaired Student’s t test (D–I). Data are from one experiment (A, B), representative of 3 independent experiments (C), or pooled from 2 experiments (D–I). See also Figures S6 and S7 and Table S2.
As DOCK8–LRCHs complex controls T cell migration (Janssen et al., 2016; Xu et al., 2017), we tested the role of Mst1 in the migration of Treg cells by co-transferring CD45.2+ WT or Mst1-deficient Treg cells, together with CD45.2+CD8+ T cells (for normalization) at a 1:2 ratio into CD45.1+ congenic mice. After 5 h, we observed a significant decrease of Mst1-deficient Treg cells in the spleen and peripheral and mesenteric lymph nodes, but an increase in the blood (Figure 6D), suggesting a migration defect of Mst1-deficient Treg cells. These cells also showed a small but significant reduction of migration in response to CCL19 (Figure S7D), a ligand for CCR7 that mediates Treg cell migration (Smigiel et al., 2014). Therefore, Mst1-deficient Treg cells exhibit reduced migratory ability in vitro and in vivo. The majority of splenic Foxp3+ Treg cells are localized within T cell zone of the white pulp (WP) (Smigiel et al., 2014). The number of Treg cells per unit area was reduced in the splenic T cell zone in Foxp3CreStk4f/f mice (Figure 6E), despite the slight increase of total splenic Treg cells in these mice (Figure S2E). To test the capacity of Mst1-deficient Treg cells to enter the splenic T cell zone, we adopted an in vivo T cell labeling method to acutely label Treg cells outside of T cell zone by injecting anti-CD4 PE (RM4–4) i.v. followed by analysis 5 min later (Smigiel et al., 2014) (Figure S7E). The frequency of PE+ Treg cells (outside of T cell zone) was increased in Foxp3CreStk4f/f mice, while the frequency of unlabeled Treg cells (inside T cell zone) was decreased (Figure 6F), suggesting the impaired ability of Mst1-deficient Treg cells to enter the splenic T cell zone. To more directly test this idea, we purified WT and Mst1-deficient Treg cells and adoptively transferred them into WT congenic recipients, and after 36 h, examined the donor Treg cell frequency in T cell zone by in vivo T cell labeling (Smigiel et al., 2014). Mst1-deficient Treg cells showed a significantly increased proportion outside of T cell zone, albeit with a small (insignificant) reduction inside T cell zone (Figure 6G). These results collectively indicate a defect of Mst1-deficient Treg cells to enter the splenic T cell zone.
The impaired entry of Treg cells into the T cell zone could limit the access to IL-2 (Smigiel et al., 2014). To assess the contribution of this defect to the reduced STAT5 phosphorylation in Mst1-deficient Treg cells, we examined the specific p-STAT5+ Treg cell populations in splenic Treg cells inside (PE−) and outside (PE+) T cell zone. As expected (Smigiel et al., 2014), Treg cells in the T cell zone showed higher p-STAT5 compared to those outside T cell zone. Mst1-deficient Treg cells inside the T cell zone still showed a significant reduction in p-STAT5+ population, whereas those outside T cell zone showed a smaller, insignificant defect (Figure 6H). Moreover, in the adoptive transfer model above (Figure 6G), there was a significant reduction of p-STAT5 in Mst1-deficient Treg cells both inside and outside T cell zone (Figure 6I), consistent with the intrinsic effect of Mst1 on IL-2–STAT5 signaling in Treg cells. Nonetheless, the defect of Mst1-deficient Treg cells to enter the T cell zone limits their access to the source of IL-2 and also likely contributes to the overall reduction of the p-STAT5+ population in vivo.
Rac mediates Mst-dependent IL-2–STAT5 signaling and Treg cell functional fitness
DOCK6 and DOCK8 are atypical guanine exchange factors for the cytoskeleton-associated GTPase Rac (Watabe-Uchida et al., 2006). We hypothesized that through the DOCK8−LRCHs module, Mst signaling orchestrates Rac activity or cytoskeletal rearrangement to interplay with IL-2−STAT5 signaling. Rac1 activity was reduced in freshly isolated Treg cells treated with the Mst1 inhibitor (Figure 7A) and in vitro-derived Treg cells lacking Mst1–Mst2 (Figure S7F). IL-2-induced actin polymerization was also reduced in Mst1-deficient cells (Figure S7G). Therefore, Mst1 signaling supports Rac activation and actin cytoskeleton reorganization in Treg cells. Pharmacological inhibition of Rac activation via EHT-1864 (Figure 7B) or EHop-016 (data not shown) dampened IL-2-induced STAT5 activation in Treg cells. Also, Treg cells expressing the dominant negative form of Rac1 (Rac1N17) had impaired IL-2-induced STAT5 phosphorylation (Figure 7C), suggesting a role of Rac activity for IL-2–STAT5 signaling. In contrast, Treg cells treated with cytochalasin D (CytD) or colchicine (Col), inhibitors that block actin and microtubule reorganization, respectively, showed no significant reduction of p-STAT5 in response to IL-2 stimulation (Figure S7H). Collectively, Rac signaling, but not cytoskeleton rearrangement, contributes to STAT5 activation in Treg cells.
Figure 7. Rac activation mediates Mst1–Mst2 function in the interplay with IL-2–STAT5 signaling and the maintenance of Foxp3 expression and p-STAT5+ subpopulation.

(A) Treg cells were expanded with IL-2–α-IL-2 (JES6–1) complex in vivo, starved in serum-free medium for 4 h with or without Mst1 inhibitor (n = 4), and then stimulated with IL-2 (100 U/ml) for 5 min. Rac1-GTP was immunoprecipitated by PAK-PBD beads, followed by immunoblot with Rac1 antibody. Total Rac1 expression was also analyzed in the lysate (input). Rac1 activity was calculated by the ratio between Rac1-GTP vs. Rac1 intensity in the immunoblot, with 0 min vehicle group normalized to 1 in statistics. (B) Immunoblot analysis of p-STAT5 in WT Treg cells pretreated with vehicle or Rac inhibitor EHT-1864 (n = 3) for 1 h, followed by IL-2 stimulation. p-STAT5 was quantified between EHT-1864 and vehicle treated groups (n = 3). (C) WT Treg cells were transduced with dominant-negative Thy1.1-Rac1N17 or control Thy1.1 retroviral vector (n = 3), rested for 4 h at 37°C, and re-stimulated with 1 U/ml IL-2 for 0 or 30 min. Analysis of p-STAT5 is performed by flow cytometry and the frequency of p-STAT5+ Treg cells was quantified. (D) Flow cytometry analysis of Foxp3+ Treg frequency in CD4+ T cells from CD45.2+GFP+ (GFP or GFP-Rac1G12V) and CD45.1+ (spike) populations in retrogenic mice (generated by reconstituting Rag1−/− mice with Tnfrsf4CreStk4f/fStk3f/f BM cells transduced with GFP or GFP-Rac1G12V retrovirus, together with CD45.1+ BM cells to prevent autoimmunity). Right, fold change of Foxp3+ Treg frequency of CD45.2+GFP+ (GFP or GFP-Rac1G12V) vs. CD45.1+ population in retrogenic mice (n = 4). (E) Flow cytometry and statistics of Foxp3 expression in CD4+Foxp3+ Treg cells of CD45.2+GFP+ (GFP or GFP-Rac1G12V) and CD45.1+ spike populations in the same retrogenic mice as in D. Numbers in graphs indicate MFI. Foxp3 MFI in CD45.1+ Treg cells of control retrovirus transduced mice was normalized to 1. (F) Flow cytometry and statistics of p-STAT5+ frequency in CD4+Foxp3+ Treg cells of CD45.2+GFP+ (GFP or GFP-Rac1G12V)+ populations in lymph nodes of retrogenic mice (n = 3) (generated as in (D)). Numbers in gates indicate percentage of cells. Data in plots indicate means ± s.e.m. NS, not significant; *P < 0.05, **P < 0.01, ***P < 0.001; two-tailed unpaired Student’s t test (B–D) or one-way ANOVA (A, E, F). Data are representative of at least 2 independent experiments (A, B, D– F), or pooled from 3 experiments (C). See also Figure S7.
We further tested the functional effects of Mst-mediated Rac activation on IL-2–STAT5 signaling in vivo. Specifically, we generated “retrogenic” mice by transducing retroviruses of GFP-tagged constitutively active Rac1 (GFP-Rac1G12V) or GFP alone into lineage negative (Lin−) BM cells from Tnfrsf4CreStk4f/fStk3f/f mice (these mice were used instead of Foxp3Cre mice to avoid interference with YFP-Foxp3 signal), and then co-transferred these cells together with Lin− CD45.1+ BM cells into sub-lethally irradiated Rag1−/− recipients. After reconstitution, Mst1–Mst2-deficient Foxp3+ Treg cells transduced with GFP retrovirus were severely underrepresented (Figure 7D). However, the frequency of Mst1–Mst2-deficient Foxp3+ Treg cells after Rac1G12V transduction was substantially restored (Figure 7D). Similarly, retrogenic expression of STAT5CA considerably rescued the frequency of Mst1–Mst2-deficient Foxp3+ Treg cells (Figure S7I), highlighting the functional importance of Rac and STAT5 in mediating Mst1–Mst2 function in Treg cells. Further, Rac1G12V but not GFP rectified defective expression levels of Foxp3 (on a per cell basis) caused by Mst1–Mst2 deficiency when compared with the co-transferred CD45.1+ cells (Figure 7E), or WT control Treg cells (data not shown). Moreover, Rac1G12V largely rescued the diminished p-STAT5+ Treg cell subpopulation in Mst1–Mst2-deficient Foxp3+ Treg cells (Figure 7F). These findings indicate that Rac is a crucial target of Mst1–Mst2 for potentiating IL-2−STAT5 signaling, and together with the role of Mst signaling in facilitating Treg cell access to IL-2, contributes to the maintenance of the Treg cell pool especially the highly suppressive p-STAT5+ subpopulation (Figure S7J).
Discussion
Despite the recent emphasis on Foxp3 control and therapeutic importance of IL-2 signaling in Treg cells, how STAT5 is activated remains poorly understood. In this study, we demonstrated a crucial role for Hippo kinases Mst1–Mst2 as a driving force for IL-2–STAT5-mediated Treg cell identity and fitness. Loss of Mst1–Mst2 impaired IL-2R–STAT5 signal strength, and also the ability of Treg cells to access IL-2 in secondary lymphoid organs, and both the direct and indirect effects likely contribute to the compromised STAT5 activation and p-STAT5+ subpopulation in Mst1–Mst2-deficient Treg cells. Our data also highlight the crucial role for the Mst1–Mst2-Rac axis and the interplay with IL-2–STAT5 signaling in the control of Treg cell homeostasis and function.
Under steady state, Treg cells are exposed to a partial IL-2-deficient condition by Foxp3-mediated repression of autocrine and paracrine IL-2 production (Liston and Gray, 2014; Malek and Castro, 2010), and Treg cells are indexed to a low IL-2 signaling threshold (Yu et al., 2009). This raises an important question whether there is a unique regulator of IL-2 signaling in Treg cells to amplify the response to the limited input of IL-2 signals. Mst1 signaling was more active in Treg cells than conventional naïve and activated T cells. Our subsequent studies identified a specific role of Mst1–Mst2 in regulating IL-2 responsiveness in Treg cells, but not in conventional T cells, to amplify IL-2–STAT5 signaling under low signal inputs from IL-2–IL-2R. Thus, Mst1–Mst2 serve as a signal-dependent amplifier of IL-2 signaling. This specificity highlights the critical importance of Mst1–Mst2 in controlling Treg cell turnover in vivo, including IL-2-induced Treg cell expansion, survival, lineage stability, and expression of target genes in these processes. A cell-intrinsic role of Mst1–Mst2 in IL-2–STAT5 signaling is supported by genetic and pharmacological perturbation, but given the inherent limitation of drug inhibitors, additional studies are required to dissect mechanisms and dynamics of Mst1 signaling.
T cell migration and homeostasis are tightly linked, as T cells need to gain access to proper microenvironmental cues important for their survival and proliferation (Campbell, 2015). However, the relationship between Treg cell migration, homeostasis and function, and the underlying mechanisms, remain unclear. Our results reveal an important role of Mst1 in this process, possibly through the DOCK8–LRCHs module, in promoting Treg cells to enter the T cell zone of secondary lymphoid organs and gain access to IL-2 for survival, lineage stability and function. Therefore, under homeostatic conditions, Treg cells sense a state of partial IL-2 deficiency (e.g. outside of T cell zone) and activate Mst1, and the activated Mst1 in turn boosts STAT5 activation under the low IL-2 input and also promotes T cell motility towards the IL-2-rich compartment. These results suggest that Mst1 serves as a central player to tightly couple Treg cell migration with homeostasis.
Treg cells exhibit unique IL-2-induced signaling properties by activating STAT5 rather than PI3K–mTOR or MAPK signaling due to the high expression of PTEN (Malek and Castro, 2010; Walsh et al., 2006). However, PTEN itself does not regulate IL-2–STAT5 activation in Treg cells (Huynh et al., 2015). Our unbiased transcriptome and protein interactome analyses allowed us to uncover Mst1–Mst2 as crucial regulators of Rac activation and cytoskeletal rearrangement, likely through interaction with the DOCK8–LRCHs module in Treg cells. Furthermore, we found that Rac activity was essential for inducing full strength of STAT5 activation in Treg cells. One possible signaling mechanism could involve clathrin-independent endocytosis of IL-2R, which depends upon Rac GTPase and downstream PAK1/PAK2 activity (Boucrot et al., 2015; Grassart et al., 2008), although the effects on downstream STAT5 signal strength remain unclear. Further investigation is needed to dissect the details of the biochemical mechanisms how the Mst1, DOCK8–LRCHs, and Rac signaling pathway links IL-2R and STAT5 activation.
In summary, our study reveals a role of Mst1–Mst2 in maintaining the Treg cell pool and functional fitness in vivo, by amplifying IL-2R–STAT5 signal strength and promoting Treg cell migratory ability and access to IL-2. The identification of Mst1–Mst2 as crucial regulators of IL-2–STAT5 activity in Treg cells, especially in response to low IL-2–IL-2R signal inputs, provides opportunities for therapeutic intervention of autoimmunity and other immune-mediated diseases. From this perspective, low-dose IL-2 therapies are promising treatments for autoimmune and inflammatory diseases (Klatzmann and Abbas, 2015), and our results suggest that Mst1–Mst2 and the downstream Rac signaling could be targeted to modulate Treg cell responses alone or in combination with these existing IL-2-targeting strategies.
STAR Methods
CONTACT FOR REAGENT AND RESOURCE SHARING
Further information and requests for resources and reagents should be directed to and will be fulfilled by the Lead Contact, Hongbo Chi (hongbo.chi@stjude.org).
EXPERIMENTAL MODEL AND SUBJECT DETAILS
Mice
C57BL/6 (RRID:IMSR_JAX:000664), CD45.1+ (RRID:IMSR_JAX:002014), ROSA26GFP (RRID:IMSR_JAX:004077), Stk4f/fStk3f/f (RRID:IMSR_JAX:017635), Cd4Cre (RRID:IMSR_JAX:017336), Tnfrsf4Cre (RRID:IMSR_JAX:012839), Ifng−/− (RRID:IMSR_JAX:002287), and Rag1−/− (RRID:IMSR_JAX:002216) mice were purchased from The Jackson Laboratory. Foxp3YFP-Cre mice were a gift from A. Rudensky. Yap1f/f and Wwtr1f/f mice were a gift from E. Olson. Age- and gender-matched littermate controls were analyzed at the indicated ages, and both genders were used. All mice were kept in a specific pathogen-free facility in the Animal Resource Center at St. Jude Children's Research Hospital. Animal protocols were approved by the Institutional Animal Care and Use Committee of St. Jude Children's Research Hospital.
METHOD DETAILS
Chimera generation and adoptive transfer
Mixed bone marrow chimeras were generated by transferring 3×10⁶ T cell-depleted CD45.2+ and CD45.1+ bone marrow cells (1:1) into sub-lethally irradiated (5 Gy) Rag1−/− mice. For adoptive transfers of Treg cells, 3×10⁵ CD4+YFP+ Treg cells from Foxp3Cre and Foxp3CreStk4f/fStk3f/f mice were transferred with or without 1.2×10⁶ WT CD4+CD25− T cells into Rag1−/− recipients, as described (Feng et al., 2014; Wei et al., 2016). Ten days or two weeks (as indicated) after transfer, mice were euthanized for the analysis of YFP and CD25 expression.
Retrogenic mouse generation
To generate retrogenic mice, bone marrow cells were isolated from the femur and tibia of Tnfrsf4Cre or Tnfrsf4CreStk4f/fStk3f/f (CD45.2+) mice and Lin− cells were enriched using the lineage cell depletion kit (Miltenyi Biotec). Lin− cells were cultured in DMEM medium containing 20% FBS (v/v), rhIL-6 (50 ng/ml), mIL-3 (20 ng/ml), and mSCF (50 ng/ml) for 2 days and then transduced with GFP control, GFP-Rac1G12V (Addgene), mCherry control, or mCherry-STAT5CA retrovirus by spin infection at 2,500 rpm for 3 h. After another 24 h, transduced cells were co-transferred with Lin−CD45.1+ cells into sub-lethally irradiated (5 Gy) Rag1−/− mice. Analysis was performed two months later.
Flow cytometry
For analysis of surface markers, cells were stained in PBS containing 2% (w/v) BSA, with anti-CD4 (RM4-5), anti-CD8α (53-6.7), anti-TCRβ (H57-597), anti-CD44 (1M7), anti-CD62L (MEL-14), anti-PD-1 (J43), anti-CD45.1 (A20), anti-CD69 (H1.2F3), anti-CD45.2 (104), anti-CD122 (TM-β1), anti-CD25 (PC61.5). CXCR5 was stained with biotinylated anti-CXCR5 (clone 2G8) and streptavidin-conjugated PE. Intracellular Foxp3 (FJK-16s), Ki67 (SolA15) and Bim (C34C5) were analyzed in cells fixed and permeabilized with Foxp3 staining buffers per the manufacturer’s instructions (Thermo Fisher Scientific). For Foxp3 staining of retrogenic mice, GFP signal was retained by staining with Alexa Fluor 488 anti-GFP (FM264G) antibody. To retain mCherry signal during Foxp3 staining in retrogenic mice, cells were fixed with BD Cytofix buffer for 20 min at room temperature, permeabilized by ice-cold 90% methanol for 30 min on ice and stained with anti-Foxp3 (FJK-16s) antibody at room temperature for 45 min. Flow cytometry detection of p-STAT5 (Y694) was analyzed in cells fixed with BD Cytofix buffer, permeabilized by ice-cold 90% methanol for 30 min and stained with anti-p-STAT5 (Y694) antibody at room temperature for 45 min. For intracellular cytokine staining, T cells were stimulated for 4 h with PMA and ionomycin in the presence of Golgi-STOP before intracellular staining for IFN-γ (XMG1.2), IL-4 (11B11) and IL-17 (17B7) according to the manufacturer's instructions. Caspase 3 activity was measured using the active caspase 3 apoptosis kit (BD Biosciences). In vitro apoptosis in Treg cells after 24 h culture was determined by Annexin V apoptosis detection kit (BD Biosciences). Antibody validation profiles are available via 1DegreeBio (http://1degreebio.org/) or CiteAb (http://www.citeab.com). Flow cytometry data were acquired on a LSRII or LSR Fortessa (BD Biosciences) and analyzed using FlowJo software (Tree Star).
Cell culture and differentiation
Lymphocytes were isolated from spleen and peripheral lymph nodes (including inguinal, auxiliary and cervical lymph nodes) or thymus. Naïve CD4+ T cells (CD4+CD25−CD44−CD62L+), Treg cells (CD4+YFP+ or CD4+CD25+ as indicated in the figures and text) and thymic mature CD4+ T cells (CD4+CD8−CD69loCD62Lhi) were sorted on a MoFlow (Beckman-Coulter) or Reflection (i-Cyt). Sorted cells were cultured in plates coated with anti-CD3 (2C11, 10 μg/ml) and anti-CD28 (37.51, 10 μg/ml) for 4.5 days in Click's medium (Irvine Scientific) supplemented with β-mercaptoethanol, 10% (v/v) FBS, 1% (v/v) penicillin-streptomycin and IL-2 (200 U/ml). In certain experiments, Treg cells were stimulated with IL-2 (0-500 U/ml) as indicated in the figures and legends. CD62LhiCD69lo mature thymocytes from WT and Cd4CreStk4f/fStk3f/f mice were differentiated under induced Treg skewing condition (2 μg/ml CD3, 2 μg/ml CD28, 1 ng/ml TGF-β, and 100 U/ml IL-2) with irradiated antigen-presenting cells for 5 days, and Foxp3 expression was examined by flow cytometry. For activated CD4+ T cell blast generation, peripheral CD4+CD25−CD44−CD62L+ naïve T cells were sorted and stimulated with plate-bound 10 μg/ml CD3+CD28 for 3 days and rested in 100 U/ml IL-2 for another 3 days. Live T cells were purified using Ficoll, and rested without IL-2 for 8 h and then stimulated with IL-2 for the indicated time points.
RNA and immunoblot analysis
Real-time PCR analysis was performed with primers and probe sets from Applied Biosystems, as described (Wei et al., 2016). Immunoblots were performed as described, using the following antibodies: p-S6 (Ser235/Ser236) (2F9), p-AKT (Ser473) (D9E), p-Foxo1 (Thr24)/p-Foxo3a (Thr32), Foxo1 (C29H4), STAT5, p-STAT5 (Tyr694), p-Mst1 (Thr183)/Mst2 (Thr180), p-Mob1 (Thr35) (D2F10), p-p44/42 MAPK (Thr202/Thr204) (D13.14.4E), Lamin B1 (D9V6H), Mst1, and β-actin (AC-15). To analyze Rac1 activity, freshly isolated Treg cells and in vitro generated Treg cells were used. Specifically, Treg cells were expanded with IL-2–α-IL-2 (JES6-1) complex in C57BL/6 mice for 3 days and rested for another 2 days, and CD4+CD25+ Treg cells were sorted and serum starved in 0.1% BSA containing Click’s medium at 37°C for 4 h with or without 5 μM Mst1 inhibitor XMU-MP-1, before stimulation with 100 U/ml IL-2 for 0 or 5 min. For in vitro-derived Treg cells, CD62LhiCD69lo mature thymocytes were isolated from WT or Cd4CreStk4f/fStk3f/f mice and cultured with plate-bound anti-CD3 (10 μg/ml) and anti-CD28 (10 μg/ml) antibodies in the presence of TGF-β (5 ng/ml) and IL-2 (200 U/ml) for 2.5 days followed by incubation with TGF-β and IL-2 for 3 days. Sorted CD4+CD25hi Treg cells were then serum starved in 0.1% BSA containing Click’s medium at 37°C for 4 h before stimulated with 100 U/ml IL-2 for 0 or 5 min. Protein concentration in samples were quantified by BCA assay (ThermoFisher Scientific) before performing Rac1 pull-down Activation Assay (Cytoskeleton). Rac1-GTP was immunoprecipitated by PAK-PBD beads, followed by immunoblot with Rac1 antibody in the assay kit. Total Rac1 expression was also analyzed in the lysate (input). Rac1 activity was calculated by the ratio between Rac1-GTP vs. Rac1 intensity in the immunoblot. The band density in all the immunoblot was quantified by ImageJ.
Inhibitor treatment
Treg cells were pretreated with pharmacological inhibitors, including kinase inhibitors (Table S1), actin inhibitor (cytochalasin D (CytD), 10 μM), tubulin inhibitor (colchicine (Col), 50 μM) and Rac inhibitors (EHT-1864, 20 μM; EHop-016, 5 μM), for 30 min to 1 h as indicated at 37°C in Click’s medium, followed by IL-2 stimulation for the indicated time points.
IL-2–α-IL-2 complex (IL-2c) injection
Foxp3Cre/+ and Foxp3Cre/+Stk4f/fStk3f/f mice were bled to examine Treg cell frequency and then given i.p. injections of IL-2c at days 0, 1, and 2. The mice were analyzed at day 5. IL-2c were prepared by mixing 4 μg mouse IL-2 (Peprotech) with 20 μg mouse α-IL-2 mAb (clone JES6-1A12, Bio X Cell), followed by 30 min of incubation at 37°C.
Tumor model
MC38 colon adenocarcinoma cells were maintained in our laboratory and cultured in DMEM medium supplemented with 10% (v/v) FBS and 1% (v/v) penicillin-streptomycin. Gender-matched Foxp3Cre and Foxp3CreStk4f/f mice were injected subcutaneously with 2×10⁵ MC38 colon adenocarcinoma cells in the right flank as described (Wei et al., 2016). Tumors were measured regularly with digital calipers and tumor volumes were calculated by the formula: Length × Width × Width × π/6.
Retroviral transduction of Treg cells
Retroviruses were produced from Plat-E cells transfected with GFP control, GFP-Rac1G12V, mCherry control, mCherry-STAT5CA, Thy1.1 control, or Thy1.1-Rac1N17 retroviral plasmids. For retroviral transduction, CD4+YFP+ Treg cells were purified and activated with plate-coated anti-CD3-CD28 supplemented with IL-2 (200 U/ml). Transduction was performed 20 h later by centrifugation (900 g for 3 h at room temperature) of CD4+ Treg cells in the presence of retroviral supernatants, 10 μg/ml polybrene and 200 U/ml IL-2, followed by medium replacement (Click’s medium with 10% FCS supplemented with 200 U/ml IL-2) for 60 h incubation, as described (Yang et al., 2017). For Rac1N17-mediated IL-2 response, Thy1.1+ cells were sorted and rested without IL-2 in a 96-well round-bottom plate with complete Click’s medium for 4 h at 37°C, before stimulation with 1 U/ml IL-2 for 0 or 30 min. The frequency of p-STAT5+ Treg cells was analyzed by flow cytometry. For in vitro STAT5CA rescue, transduced Treg cells were plated onto anti-CD3-CD28-coated 96-well plates in the presence of IL-2 (50 U/ml) for 4 days and expression of YFP-Foxp3 and IFN-γ by mCherry+ Treg cells was measured by flow cytometry. For in vivo STAT5CA rescue, 3×10⁵ transduced Treg cells were transferred into Rag1−/− mice, and expression of YFP-Foxp3, CD25 and IFN-γ by mCherry+ Treg cells was measured by flow cytometry 10 days later (Wei et al., 2016).
In vivo T cell labeling
Anti-CD4 PE (RM4-4; 2 μg) was injected i.v., and mice were sacrificed 5 min after injection, as described (Smigiel et al., 2014). Splenocytes were prepared for flow cytometry analysis, with CD4 surface staining using RM4-5 antibodies. Anti-CD4 PE (RM4-4) labels cells in the red pulp (RP)/marginal zone (MZ) but is excluded from the T cell zones in the white pulp (WP) due to the relatively impermeant marginal sinus. After tissue harvest, STAT5 phosphorylation among WP (PE−) and RP/MZ (PE+) Treg cells was analyzed by flow cytometry.
In vitro chemotaxis assay
RPMI 1640 medium (0.5 ml) containing 200 ng/ml CCL19 (R&D Systems) was added to the lower chamber, and 1×10⁶ splenocytes in 100 μl of medium were then added to the upper chamber of 5-μm pore, polycarbonate 24-well tissue culture inserts (Costar), followed by 3 h incubation at 37°C in 5% CO2. The splenocytes from the input and lower chambers were counted and stained for flow cytometry analysis. Percentage of migration was calculated for CD4+YFP+ Treg cells by dividing the number of Treg cells in the input into the number of cells migrated. All chemotaxis data represent the mean of triplicate wells performed in two experiments.
In vivo migration assay
Freshly isolated YFP-Foxp3+ Treg cells (5×10⁵) from Foxp3Cre and Foxp3CreStk4f/f mice were adoptively transferred into WT congenic CD45.1+ mice, together with CD45.2+CD8+ T cells (1×10⁶) for normalization purposes. After 5 h, the ratio of CD45.2+CD4+ Treg cells vs. CD45.2+CD8+ T cells was analyzed in the spleen, PLN, MLN and blood, and normalized based on the starting ratio (1:2), as described (Chi and Flavell, 2005).
Immunoprecipitation and interactome analysis
Naïve CD4+ T cells from C57BL/6 mice were differentiated into Treg cells as above. Treg cells were expanded with daily injection of IL-2–α-IL-2 (JES6-1) complex in C57BL/6 mice for 3 days and rested for another 2 days. For immunoprecipitation, the Mst1 antibody (EP1465Y, Abcam) or IgG was incubated with Protein A/G (Santa Cruz) for at least 2 h at 4°C before adding lysates. Treg cells were lysed in IP lysis buffer (20 mM Tris-HCl pH 8, 137 mM NaCl, 1% Triton X-100, 2 mM EDTA) and applied to beads, incubated at 4°C under rotation for another 3 h and washed at least 3 times. Lammaeli buffer (2×) were added to each tube containing the beads and boiled for 5 min to release the bound proteins. The lysates were then analyzed by immunoblot using anti-Mst1 (Cell Signaling Technology) and anti-DOCK8 (H-159, Santa Cruz) antibodies. Alternatively, immunoprecipitated proteins were digested and the peptides were labeled with individual TMT reagents and pooled, followed by basic pH reversed phase LC fractionation. Each fraction was then analyzed using acidic pH reverse phase nanoscale LC-High Resolution MS/MS. Protein detection and quantification and computational analysis were performed as we described previously (Tan et al., 2017). To identify the Mst1 interactome, MS-identified proteins commonly found in the CRAPome (Mellacheruvu et al., 2013) were removed and an empirical threshold (log2 (Mst1 / IgG) > 1) was set. By combining the BioPlex (bioplex.hms.harvard.edu) and STRING PPI (string-db.org) datasets (with a comprehensive interactome of 14,698 proteins and 108,858 high-quality PPI connections), functional modules were identified, and further assayed for functional enrichment analysis using KEGG, Hallmark, GO and CORUM databases.
Imaging and histology
For detecting STAT5 activation in Treg cells in response to IL-2, purified WT, Mst1-deficient or Mst1–Mst2-deficient YFP+ Treg cells were rested in complete medium for 1 h at 37°C and stimulated with 1 U/ml IL-2. Cells were harvested, fixed with 4% (v/v) neutral buffered paraformaldehyde (PFA) solution and stained with p-STAT5 (Y694) antibody (D47E7, Cell Signaling Technology). Images were acquired using a Zeiss Axio ObserverZ.1 microscope equipped with a CSU-22 spinning disk (Yokagawa), Delta Evole EMCCD camera (Photometrics), 100×/1.45 NA oil objective and Slidebook imaging software (3i Intelligent Imaging Innovations). For detecting Treg cells in the T cell zone, spleens were fixed in PBS containing 2% PFA (v/v), 0.3% Triton-100 (v/v) and 1% DMSO (v/v) for 18 h at 4°C. Samples were cryoprotected for 24 h with 20% sucrose in PBS prior to embedding in tissue freezing medium. 10 μm cryosections were blocked in TBS containing 2% BSA and 0.05% Tween-20 (v/v) prior to incubation for 18 h at 4°C with the following antibodies: YFP-Foxp3 was detected with atto-488 conjugated anti-GFP antibodies, AF594-conjugated B220 (RA3-6B2) and AF647 conjugated CD3 (17A2). Sections were washed with TBS prior to mounting with Prolong diamond hard set mounting medium (ThermoFisher Scientific). Images were acquired using a Nikon TiE microscope equipped with a 40X 1.3NA oil objective, DU-897 EMCCD camera (Andor), and analyzed using NIS Elements AR software (Nikon). T cell zone was determined as CD3-rich area circumscribed by B220+ cells (B cell-rich marginal zone). Treg cell number per area was determined by calculating GFP+CD3+ cell number divided by area of the corresponding T cell zone. For histological analysis, tissues were fixed with 10% (v/v) neutral buffered formalin solution, embedded in paraffin, sectioned and stained with hematoxylin and eosin. The clinical signs of autoimmune disease were analyzed by an experienced pathologist (P.V.).
Serum autoantibodies analysis
Autoantibodies to dsDNA were measured with kits from Alpha Diagnostic International (#5110) (Shrestha et al., 2015).
actin content measurement
Treg cells were sorted and rested at 37°C for 1 h, stimulated by 200 U/ml recombinant human IL-2 for 0, 5, 10, 20 and 30 min, and then immediately fixed with 6% paraformaldehyde at room temperature for 20 min. Fixed cells were washed once with 1× PBS buffer, followed by permeabilizing and staining with phalloidin in 0.1% Triton X-100 containing PBS solution (0.5% Bovine Serum Albumin) and analyzed by flow cytometry for the mean fluorescence intensity of phalloidin.
QUANTIFICATION AND STATISTICAL ANALYSIS
Gene expression profiling
RNA was purified from CD45.2+ WT and Mst1–Mst2-deficient Treg cells isolated from mixed bone marrow chimeras and gene expression profiles were analyzed with the Affymetrix Mouse Gene 2.0 ST array. The gene expression signals were summarized with the robust multi-array average algorithm (Affymetrix Expression Console v1.1). Lists of genes differentially expressed by 1.5-fold or more were analyzed for functional enrichment using the hallmark gene sets (Broad Institute).
Statistical analysis
P values were calculated with Student's t test, Log Rank test or one-way ANOVA (GraphPad Prism). P < 0.05 was considered significant. All error bars represent s.e.m.
DATA AND SOFTWARE AVAILABILITY
The microarray data of CD4+YFP+ WT and Mst1–Mst2-deficient Treg cells from mixed bone marrow chimeras have been deposited in the Gene Expression Omnibus (GEO, NCBI) under accession code GEO: GSE120711.
Supplementary Material
Table S2, related to Figure 5. Protein-protein interaction (PPI) network analysis of Stk4 interaction candidates based on PPI database. A composite PPI database is constructed by combining BioPlex and STRING PPI databases. This composite database represents a comprehensive human interactome of 14,698 proteins and 108,858 high quality PPI connections. Listed are PPI topology-based modules of Stk4 interactome in Treg cells, the mapped proteins and numbers, as well as functional pathways that are defined by searching the module proteins against the pathway databases (KEGG, Hallmark, GO and CORUM, with P value cutoff of 0.01). The list is sorted by the modules.
KEY RESOURCES TABLE
| REAGENT or RESOURCE | SOURCE | IDENTIFIER |
|---|---|---|
| Antibodies | ||
| Anti-CD4 (RM4-5) | Thermo Fisher Scientific | Cat# 48-0042-80; RRID:AB_1272231 |
| Anti-CD4 (RM4-4, in vivo labeling) | BioLegend | Cat# 116006; RRID:AB_313691 |
| Anti-CD8α (53-6.7) | BioLegend | Cat# 100742; RRID:AB_2563056 |
| Anti-TCRβ (H57-597) | Thermo Fisher Scientific | Cat# 47–5961-82; RRID:AB_1272173 |
| Anti-CD44 (1M7) | BioLegend | Cat# 103047; RRID:AB_2562451 |
| Anti-CD62L (MEL-14) | Thermo Fisher Scientific | Cat# 25-0621-81; RRID:AB_469632 |
| Anti-CD69 (H1.2F3) | Thermo Fisher Scientific | Cat# 48-0691-82; RRID:AB_10719430 |
| Anti-PD-1 (J43) | Thermo Fisher Scientific | Cat# 17-9985-80; RRID:AB_11149860 |
| Anti-CD45.1 (A20) | BioLegend | Cat# 110736; RRID:AB_2562564 |
| Anti-CD45.2 (104) | Thermo Fisher Scientific | Cat# 48-0454-80; RRID:AB_11039533 |
| Anti-CD122 (TM-β1) | Thermo Fisher Scientific | Cat# 12-1222-81; RRID:AB_465835 |
| Anti-CD25 (PC61.5) | Thermo Fisher Scientific | Cat# 17-0251-82; RRID:AB_469366 |
| Anti-CXCR5 (2G8) | BD Bioscience | Cat# 551960; RRID:AB_394301 |
| Anti-Streptavidin-PE | BioLegend | Cat# 410504; RRID:AB_2571915 |
| Anti-Foxp3 (FJK-16s) | Thermo Fisher Scientific | Cat# 12-5773-80; RRID:AB_465935 |
| Anti-Ki67 (SolA15) | Thermo Fisher Scientific | Cat# 25-5698-80; RRID:AB_11217689 |
| Anti-Bim (C34C5) | Cell Signaling Technology | Cat# 2933; RRID:AB_1030947 |
| Anti-GFP-Alexa Fluor 488 (FM264G) | BioLegend | Cat# 338008; RRID:AB_2563288 |
| Anti-pY694-STAT5 (Flow cytometry) | BD Bioscience | Cat# 612567; RRID:AB_399858 |
| Anti-IFN-γ (XMG1.2) | Thermo Fisher Scientific | Cat# 17-7311-81; RRID:AB_469503 |
| Anti-IL-4 (11B11) | Thermo Fisher Scientific | Cat# 12-7041-71; RRID:AB_466154 |
| Anti-IL-17 (eBio17B7) | Thermo Fisher Scientific | Cat# 45-7177-80; RRID:AB_925754 |
| Anti-Caspase 3-PE | BD Bioscience | Cat# 557091; RRID:AB_396582 |
| Anti-CD3 (145-2C11) | Bio-X-Cell | Cat# BE0001; RRID:AB_2714218 |
| Anti-CD28 (37.51) | Bio-X-Cell | Cat# BE0015-1; RRID:AB_1107624 |
| Anti-IL-2 (JES6-1) | Bio-X-Cell | Cat# BE0043; RRID:AB_1107702 |
| Anti-pY694-STAT5 (Immunoblot) | Cell Signaling Technology | Cat# 9351; RRID:AB_2315225 |
| Anti-pY694-STAT5 (D47E7) (Immunofluorescence) | Cell Signaling Technology | Cat# 4322P; RRID:AB_10548756 |
| Anti-Lamin B1 (D9V6H) | Cell Signaling Technology | Cat# 13435; RRID:AB_2737428 |
| Anti-β-actin (AC-74) | Sigma-Aldrich | Cat# A2228; RRID:AB_476697 |
| Anti-STAT5 | Cell Signaling Technology | Cat# 9363; RRID:AB_2196923 |
| Anti-phospho-S6 (S235/236) (D57.2.2E) | Cell Signaling Technology | Cat# 4858; RRID:AB_916156 |
| Anti-phospho-ERK1/2 (T202/204) (D13.14.4E) | Cell Signaling Technology | Cat# 4370; RRID:AB_2315112 |
| Anti-phospho-Akt (S473) | Cell Signaling Technology | Cat# 4060 |
| Anti-phospho-Mob1 (T35) (D2F10) | Cell Signaling Technology | Cat# 8699S; RRID:AB_11139998 |
| Anti-phospho-Mst1/2 (T183/180) | Cell Signaling Technology | Cat# 3681S; RRID:AB_330269 |
| Anti-Mst1 (immunoblot) | Cell Signaling Technology | Cat# 3682; RRID:AB_2144632 |
| Anti-Mst1 (EP1465Y, Immunoprecipitation) | Abcam | Cat# ab51134; RRID:AB_881247 |
| Anti-DOCK8 (H-159) | Santa Cruz | Cat# sc-292124; RRID:AB_10845110 |
| Anti-GFP-Booster_ATTO488 | ChromoTek | Cat# gba488-100; RRID:AB_2631386 |
| Anti-B220-Alexa Fluor 594 (RA3-6B2) | BioLegend | Cat# 103254; RRID:AB_2563229 |
| Anti-CD3-Alexa Fluor 647 (17A2) | BioLegend | Cat# 100209; RRID:AB_389323 |
| Chemicals, Peptides, and Recombinant Proteins | ||
| 7-AAD | Sigma-Aldrich | Cat# A9400 |
| EHT-1864 (Rac inhibitor) | Cayman Chemical | Cat# 17258; CAS: 754240-09-0 |
| EHop-016 (Rac inhibitor) | Tocris | Cat# 6248; CAS: 1380432-32-5 |
| Cytochalasin D (actin inhibitor) | Tocris | Cat# 1233; CAS: 22144-77-0 |
| Colchicine (microtubule inhibitor) | Tocris | Cat# 1364; CAS: 64-86-8 |
| Tofacitinib (JAK3 inhibitor) | Tocris | Cat# 4556; CAS: 540737-29-9 |
| PS-1145 (IKKβ inhibitor) | Cayman Chemical | Cat# 14862; CAS: 431898-65-6 |
| XMU-MP-1 (Mst1 inhibitor) | Selleck Chemicals | Cat# S8334; Lot# 01; CAS: 2061980-01-4 |
| U-0126 (ERK inhibitor) | Cayman Chemical | Cat# 70970; CAS: 109511-58-2 |
| SB203580 (p38 MAPK inhibitor) | EMD Millipore | Cat# 559389; CAS: 152121-47-6 |
| GSK2334470 (PDK1 inhibitor) | Sigma-Aldrich | Cat# SML0217; CAS: 1227911-45-6 |
| Akt inhibitor VIII (Akt inhibitor) | EMD Millipore | Cat# 124018; CAS: 612847-09-3 |
| Rapamycin (mTORc1 inhibitor) | EMD Millipore | Cat# 553210; CAS: 53123-88-9 |
| SP600125 (JNK inhibitor) | Sigma-Aldrich | Cat# S5567; CAS: 129-56-6 |
| LY294002 (PI3K inhibitor) | Sigma-Aldrich | Cat# 440202; CAS: 154447-36-6 |
| SB216763 (GSK3 inhibitor) | Tocris | Cat# 1616; CAS: 280744-09-4 |
| PF 3644022 (MK2 inhibitor) | Tocris | Cat# 4279; CAS: 1276121-88-0 |
| MNK1 inhibitor | EMD Millipore | Cat# 454861; CAS: 522629-08-9 |
| SB 747651A (MSK1 inhibitor) | Tocris | Cat# 4630; CAS: 1781882-72-1 |
| Phalloidin-Alexa Fluor 647 | Thermo Fisher Scientific | Cat# A2287 |
| Recombinant murine IL-2 (complex with anti-IL-2) | Peprotech | Cat# 212-12 |
| Recombinant human IL-2 (in vitro stimulation) | R&D Systems | Cat# 202-IL |
| Phorbol 12-myristate 13-acetate (PMA) | Sigma-Aldrich | Cat# P8139 |
| Ionomycin | Sigma-Aldrich | Cat# I0634 |
| Golgi-STOP | BD Bioscience | Cat# 554724 |
| Recombinant human IL-6 | National Cancer Institute | Cat# NSC720836 |
| Recombinant murine IL-3 | Thermo Fisher Scientific | Cat# PMC0034 |
| Recombinant murine SCF | Thermo Fisher Scientific | Cat# PMC2115 |
| Critical Commercial Assays | ||
| Rac1 Pull-down Activation Assay Biochem Kit | Cytoskeleton | Cat# BK035 |
| Mouse Anti-dsDNA Ig's (Total A+G+M) ELISA Kit, 96 tests, Quantitative | Alpha Diagnostic International | Cat# 5110 |
| Foxp3 transcription Factor Staining buffer set | Thermo Fisher Scientific | Cat# 00-5523-00 |
| Cytofix/Cytoperm Fixation/Permeabilization Solution Kit | BD Bioscience | Cat# 554714 |
| Annexin V Apoptosis Detection Kit | BD Bioscience | Cat# 559763 |
| Pierce BCA Protein Assay Kit | Thermo Fisher Scientific | Cat# 23225 |
| Lineage cell depletion kit | Miltenyi Biotec | Cat# 130-090-858 |
| Deposited Data | ||
| Treg Microarray data | This paper | GEO: GSE120711 |
| Experimental Models: Organisms/Strains | ||
| Mouse: C57BL/6J | The Jackson Laboratory | Cat# 000664; RRID:IMSR_JAX:000664 |
| Mouse: Stk4f/fStk3f/f: Stk4tm1.1Rjo Stk3tm1.1Rjo/J | The Jackson Laboratory | Cat# 017635; RRID:IMSR_JAX:017635 |
| Mouse: Yap1f/f | E. Olson (Xin et al., 2013) | N/A |
| Mouse: Wwtr1f/f | E. Olson(Xin et al., 2013) | N/A |
| Mouse: CD45.1+: B6.SJL-Ptprca Pep3b/BoyJ | The Jackson Laboratory | Cat# 002014; RRID:IMSR_JAX:002014 |
| Mouse: ROSA26GFP: Gt(ROSA)26Sortm2Sho/J | The Jackson Laboratory | Cat# 004077; RRID:IMSR_JAX:004077 |
| Mouse: Cd4Cre: Tg(Cd4-cre)1Cwi/BfluJ | The Jackson Laboratory | Cat# 017336; RRID:IMSR_JAX:017336 |
| Mouse: Tnfrsf4Cre: Tnfrsf4tm2(cre)Nik/J | The Jackson Laboratory | Cat# 012839; RRID:IMSR_JAX:012839 |
| Mouse: Ifng−/−: Ifngtm1Ts/J | The Jackson Laboratory | Cat# 002287; RRID:IMSR_JAX:002287 |
| Mouse: Rag1−/−: Rag1tm1Mom/J | The Jackson Laboratory | Cat# 002216; RRID:IMSR_JAX:002216 |
| Mouse: Foxp3YFP-Cre | A. Rudensky (Chinen et al., 2016) | N/A |
| Recombinant DNA | ||
| Mouse STAT5bCA | Y. Feng (Feng et al., 2014) | N/A |
| pmCherry-STAT5CA | This paper | N/A |
| pMX-GFP-Rac-G12V | (Hall et al., 2006) | Addgene Cat# 14567 |
| pMSCV-IRES-Thy1.1-Rac1N17 | This paper | N/A |
| Software and Algorithms | ||
| FlowJo V9.3 | FlowJo | https://www.flowjo.com/ |
| Prism6 | GraphPad | https://www.graphpad.com/scientific-software/prism/ |
| Image J | NIH | https://imagej.nih.gov/ij/ |
| Other | ||
| LSR II flow cytometer | BD Bioscience | N/A |
| LSR Fortessa flow cytometer | BD Bioscience | N/A |
| MoFlow | Beckman-Coulter | N/A |
| Reflection | i-Cyt | N/A |
Highlights.
Mst1 is a signal-dependent amplifier of IL-2–STAT5 signaling in Treg cells
Loss of Mst1–Mst2 in Treg cells leads to CD8+ and Th1-dominant autoimmunity
Mst1–Mst2 promote Treg cell access to IL-2 and IL-2-induced survival and stability
Mst1 signals through Rac to maintain a stable Treg cell pool and STAT5 activation
Acknowledgements
The authors acknowledge A. Rudensky for Foxp3YFP-Cre mice (Chinen et al., 2016); E. Olson for Yap1f/f and Wwtr1f/f mice (Xin et al., 2013); Y. Wang for help with immunological assays and editing the manuscript; J. Wei for initial analysis of Foxp3CreYap1f/fWwtr1f/f mice; H. Zeng and N. Chapman for helpful discussions and editing the manuscript; M. Hendren and A. KC for animal colony management; and St. Jude Immunology FACS core facility for cell sorting. This work was supported by NIH AI105887, AI101407, AI140761, CA176624 and CA221290 (H.C.), and National Key Research and Development Program of China (2016YFC1000504) (W.T.)
Footnotes
Declaration of Interests
The authors declare no competing financial interests.
Publisher's Disclaimer: This is a PDF file of an unedited manuscript that has been accepted for publication. As a service to our customers we are providing this early version of the manuscript. The manuscript will undergo copyediting, typesetting, and review of the resulting proof before it is published in its final citable form. Please note that during the production process errors may be discovered which could affect the content, and all legal disclaimers that apply to the journal pertain.
References
- Abdollahpour H, Appaswamy G, Kotlarz D, Diestelhorst J, Beier R, Schaffer AA, Gertz EM, Schambach A, Kreipe HH, Pfeifer D, et al. (2012). The phenotype of human STK4 deficiency. Blood 119, 3450–3457. [DOI] [PMC free article] [PubMed] [Google Scholar]
- Boucrot E, Ferreira AP, Almeida-Souza L, Debard S, Vallis Y, Howard G, Bertot L, Sauvonnet N, and McMahon HT (2015). Endophilin marks and controls a clathrin-independent endocytic pathway. Nature 517, 460–465. [DOI] [PubMed] [Google Scholar]
- Campbell DJ (2015). Control of Regulatory T Cell Migration, Function, and Homeostasis. Journal of immunology 195, 2507–2513. [DOI] [PMC free article] [PubMed] [Google Scholar]
- Chi H, and Flavell RA (2005). Cutting edge: regulation of T cell trafficking and primary immune responses by sphingosine 1-phosphate receptor 1. Journal of immunology 174, 2485–2488. [DOI] [PubMed] [Google Scholar]
- Chinen T, Kannan AK, Levine AG, Fan X, Klein U, Zheng Y, Gasteiger G, Feng Y, Fontenot JD, and Rudensky AY (2016). An essential role for the IL-2 receptor in Treg cell function. Nature immunology 17, 1322–1333. [DOI] [PMC free article] [PubMed] [Google Scholar]
- Du X, Shi H, Li J, Dong Y, Liang J, Ye J, Kong S, Zhang S, Zhong T, Yuan Z, et al. (2014). Mst1/Mst2 regulate development and function of regulatory T cells through modulation of Foxo1/Foxo3 stability in autoimmune disease. Journal of immunology 192, 1525–1535. [DOI] [PubMed] [Google Scholar]
- Fan F, He Z, Kong LL, Chen Q, Yuan Q, Zhang S, Ye J, Liu H, Sun X, Geng J, et al. (2016). Pharmacological targeting of kinases MST1 and MST2 augments tissue repair and regeneration. Science translational medicine 8, 352ra108. [DOI] [PubMed] [Google Scholar]
- Feng Y, Arvey A, Chinen T, van der Veeken J, Gasteiger G, and Rudensky AY (2014). Control of the inheritance of regulatory T cell identity by a cis element in the Foxp3 locus. Cell 158, 749–763. [DOI] [PMC free article] [PubMed] [Google Scholar]
- Fontenot JD, Rasmussen JP, Gavin MA, and Rudensky AY (2005). A function for interleukin 2 in Foxp3-expressing regulatory T cells. Nature immunology 6, 1142–1151. [DOI] [PubMed] [Google Scholar]
- Grassart A, Dujeancourt A, Lazarow PB, Dautry-Varsat A, and Sauvonnet N (2008). Clathrin-independent endocytosis used by the IL-2 receptor is regulated by Rac1, Pak1 and Pak2. EMBO reports 9, 356–362. [DOI] [PMC free article] [PubMed] [Google Scholar]
- Hall AB, Gakidis MA, Glogauer M, Wilsbacher JL, Gao S, Swat W, and Brugge JS (2006). Requirements for Vav guanine nucleotide exchange factors and Rho GTPases in FcgammaR- and complement-mediated phagocytosis. Immunity 24, 305–316. [DOI] [PubMed] [Google Scholar]
- Huynh A, DuPage M, Priyadharshini B, Sage PT, Quiros J, Borges CM, Townamchai N, Gerriets VA, Rathmell JC, Sharpe AH, et al. (2015). Control of PI(3) kinase in Treg cells maintains homeostasis and lineage stability. Nature immunology 16, 188–196. [DOI] [PMC free article] [PubMed] [Google Scholar]
- Janssen E, Tohme M, Hedayat M, Leick M, Kumari S, Ramesh N, Massaad MJ, Ullas S, Azcutia V, Goodnow CC, et al. (2016). A DOCK8-WIP-WASp complex links T cell receptors to the actin cytoskeleton. The Journal of clinical investigation 126, 3837–3851. [DOI] [PMC free article] [PubMed] [Google Scholar]
- Josefowicz SZ, Lu LF, and Rudensky AY (2012). Regulatory T cells: mechanisms of differentiation and function. Annual review of immunology 30, 531–564. [DOI] [PMC free article] [PubMed] [Google Scholar]
- Klatzmann D, and Abbas AK (2015). The promise of low-dose interleukin-2 therapy for autoimmune and inflammatory diseases. Nature reviews. Immunology 15, 283–294. [DOI] [PubMed] [Google Scholar]
- Liao W, Lin JX, and Leonard WJ (2013). Interleukin-2 at the crossroads of effector responses, tolerance, and immunotherapy. Immunity 38, 13–25. [DOI] [PMC free article] [PubMed] [Google Scholar]
- Lin JX, Li P, Liu D, Jin HT, He J, Ata Ur Rasheed M, Rochman Y, Wang L, Cui K, Liu C, et al. (2012). Critical Role of STAT5 transcription factor tetramerization for cytokine responses and normal immune function. Immunity 36, 586–599. [DOI] [PMC free article] [PubMed] [Google Scholar]
- Liston A, and Gray DH (2014). Homeostatic control of regulatory T cell diversity. Nature reviews. Immunology 14, 154–165. [DOI] [PubMed] [Google Scholar]
- Liu C, Workman CJ, and Vignali DA (2016). Targeting regulatory T cells in tumors. The FEBS journal 283, 2731–2748. [DOI] [PubMed] [Google Scholar]
- Liu Z, Gerner MY, Van Panhuys N, Levine AG, Rudensky AY, and Germain RN (2015). Immune homeostasis enforced by co-localized effector and regulatory T cells. Nature 528, 225–230. [DOI] [PMC free article] [PubMed] [Google Scholar]
- Malek TR, and Castro I (2010). Interleukin-2 receptor signaling: at the interface between tolerance and immunity. Immunity 33, 153–165. [DOI] [PMC free article] [PubMed] [Google Scholar]
- Mellacheruvu D, Wright Z, Couzens AL, Lambert JP, St-Denis NA, Li T, Miteva YV, Hauri S, Sardiu ME, Low TY, et al. (2013). The CRAPome: a contaminant repository for affinity purification-mass spectrometry data. Nature methods 10, 730–736. [DOI] [PMC free article] [PubMed] [Google Scholar]
- Mou F, Praskova M, Xia F, Van Buren D, Hock H, Avruch J, and Zhou D (2012). The Mst1 and Mst2 kinases control activation of rho family GTPases and thymic egress of mature thymocytes. The Journal of experimental medicine 209, 741–759. [DOI] [PMC free article] [PubMed] [Google Scholar]
- Sakaguchi S, Vignali DA, Rudensky AY, Niec RE, and Waldmann H (2013). The plasticity and stability of regulatory T cells. Nature reviews. Immunology 13, 461–467. [DOI] [PubMed] [Google Scholar]
- Shrestha S, Yang K, Guy C, Vogel P, Neale G, and Chi H (2015). Treg cells require the phosphatase PTEN to restrain TH1 and TFH cell responses. Nature immunology 16, 178–187. [DOI] [PMC free article] [PubMed] [Google Scholar]
- Smigiel KS, Richards E, Srivastava S, Thomas KR, Dudda JC, Klonowski KD, and Campbell DJ (2014). CCR7 provides localized access to IL-2 and defines homeostatically distinct regulatory T cell subsets. The Journal of experimental medicine 211, 121–136. [DOI] [PMC free article] [PubMed] [Google Scholar]
- Tan H, Yang K, Li Y, Shaw TI, Wang Y, Blanco DB, Wang X, Cho JH, Wang H, Rankin S, et al. (2017). Integrative Proteomics and Phosphoproteomics Profiling Reveals Dynamic Signaling Networks and Bioenergetics Pathways Underlying T Cell Activation. Immunity 46, 488–503. [DOI] [PMC free article] [PubMed] [Google Scholar]
- Ueda Y, Katagiri K, Tomiyama T, Yasuda K, Habiro K, Katakai T, Ikehara S, Matsumoto M, and Kinashi T (2012). Mst1 regulates integrin-dependent thymocyte trafficking and antigen recognition in the thymus. Nature communications 3, 1098. [DOI] [PubMed] [Google Scholar]
- Walsh PT, Buckler JL, Zhang J, Gelman AE, Dalton NM, Taylor DK, Bensinger SJ, Hancock WW, and Turka LA (2006). PTEN inhibits IL-2 receptor-mediated expansion of CD4+ CD25+ Tregs. The Journal of clinical investigation 116, 2521–2531. [DOI] [PMC free article] [PubMed] [Google Scholar]
- Wei J, Long L, Yang K, Guy C, Shrestha S, Chen Z, Wu C, Vogel P, Neale G, Green DR, and Chi H (2016). Autophagy enforces functional integrity of regulatory T cells by coupling environmental cues and metabolic homeostasis. Nature immunology 17, 277–285. [DOI] [PMC free article] [PubMed] [Google Scholar]
- Xin M, Kim Y, Sutherland LB, Murakami M, Qi X, McAnally J, Porrello ER, Mahmoud AI, Tan W, Shelton JM, et al. (2013). Hippo pathway effector Yap promotes cardiac regeneration. Proceedings of the National Academy of Sciences of the United States of America 110, 13839–13844. [DOI] [PMC free article] [PubMed] [Google Scholar]
- Xu X, Han L, Zhao G, Xue S, Gao Y, Xiao J, Zhang S, Chen P, Wu ZY, Ding J, et al. (2017). LRCH1 interferes with DOCK8-Cdc42-induced T cell migration and ameliorates experimental autoimmune encephalomyelitis. The Journal of experimental medicine 214, 209–226. [DOI] [PMC free article] [PubMed] [Google Scholar]
- Yang K, Blanco DB, Neale G, Vogel P, Avila J, Clish CB, Wu C, Shrestha S, Rankin S, Long L, et al. (2017). Homeostatic control of metabolic and functional fitness of Treg cells by LKB1 signalling. Nature 548, 602–606. [DOI] [PMC free article] [PubMed] [Google Scholar]
- Yu A, Snowhite I, Vendrame F, Rosenzwajg M, Klatzmann D, Pugliese A, and Malek TR (2015a). Selective IL-2 responsiveness of regulatory T cells through multiple intrinsic mechanisms supports the use of low-dose IL-2 therapy in type 1 diabetes. Diabetes 64, 2172–2183. [DOI] [PubMed] [Google Scholar]
- Yu A, Zhu L, Altman NH, and Malek TR (2009). A low interleukin-2 receptor signaling threshold supports the development and homeostasis of T regulatory cells. Immunity 30, 204–217. [DOI] [PMC free article] [PubMed] [Google Scholar]
- Yu FX, Zhao B, and Guan KL (2015b). Hippo Pathway in Organ Size Control, Tissue Homeostasis, and Cancer. Cell 163, 811–828. [DOI] [PMC free article] [PubMed] [Google Scholar]
- Zeng H, Yang K, Cloer C, Neale G, Vogel P, and Chi H (2013). mTORC1 couples immune signals and metabolic programming to establish T(reg)-cell function. Nature 499, 485–490. [DOI] [PMC free article] [PubMed] [Google Scholar]
Associated Data
This section collects any data citations, data availability statements, or supplementary materials included in this article.
Supplementary Materials
Table S2, related to Figure 5. Protein-protein interaction (PPI) network analysis of Stk4 interaction candidates based on PPI database. A composite PPI database is constructed by combining BioPlex and STRING PPI databases. This composite database represents a comprehensive human interactome of 14,698 proteins and 108,858 high quality PPI connections. Listed are PPI topology-based modules of Stk4 interactome in Treg cells, the mapped proteins and numbers, as well as functional pathways that are defined by searching the module proteins against the pathway databases (KEGG, Hallmark, GO and CORUM, with P value cutoff of 0.01). The list is sorted by the modules.