Abstract
The auditory brainstem response (ABR) is relatively non-invasive, and in many species, the only practical way to assess auditory sensitivity. The two main methods for measuring ABR are using either transients or tone bursts as a stimulus. The transient stimulus produces strong neural responses that contain no frequency information. In contrast, tone bursts stimulate only a small part of the auditory system, eliciting weaker neural responses but supplying frequency information. Furthermore, short tone bursts become less and less frequency specific with increasing stimulus wavelength, making them unsuitable for testing low-frequency hearing. Here, we develop a method that can measure sensitivity to both low and high-frequency stimuli. The method is based on masking of a transient response by long-duration sinusoids. The measurement system is developed as a highly portable system that runs on battery power. It has been used in a variety of animals in our lab and in the field, including squid (Mooney et al. in J Exp Biol 213: 3748–3759, 2010), lungfish (Christensen-Dalsgaard et al. in J Neurophys 105: 1992–2004, 2011b), alligators (Bierman et al. in J Exp Biol 217: 1094–1107, 2014), and mink (Brandt et al. in J Exp Biol 216: 3542–3550, 2013). Here, we present data recorded from Tokay geckos and compare the results with tone burst ABR measurements. This method produces results comparable to tone burst stimulations at higher frequencies (above 1 kHz) but has several advantages: it is relatively insensitive to fluctuations in neural signal level, it allows measurements at very low frequencies, it allows constant monitoring of the state of the animal, and can be used to measure directional hearing.
Keywords: ABR, masking, low frequency, gecko
Introduction
Auditory evoked potentials are a frequently used method for assessing hearing of many animals including humans, since this recording method is non-invasive and simple, compared to other neurophysiological measurements. The measurements of short latency evoked potentials, usually called the “auditory brainstem response” (ABR) are widely used as a diagnostic tool in human audiology (reviewed by Burkard and Don 1997), and an extensive body of data has been collected in various animal groups using this method (Corwin et al. 1982, Walsh et al. 1992, Brittan-Powell et al. 2002, 2010).
Because of the non-invasive recording method, the evoked potentials are usually very small (below 1 μV) and strongly limited by noise, either extraneous (e.g., from power lines) or internal (from neuromuscular activity in the test subject). The signal-to-noise ratio is usually improved by averaging, and the response amplitude can also be improved by choosing an auditory stimulus, such as transients or brief chirps, that produces a synchronized response in many neurons. Since such stimuli cover a large frequency band, other stimulus types, usually tone bursts, are used to investigate frequency sensitivity. If tone bursts are brief (duration < 10 ms), the responses can be very similar to transient responses and therefore give very little information about frequency sensitivity. At lower nominal frequencies (below 500 Hz), these brief tone bursts are essentially broad-band stimuli (“frequency splatter”) and cannot be used to generate audiograms. Attempting to counter this problem by using longer duration tone bursts generally affects the shape of the ABR response and leads to decreased responses (Kodera et al. 1977). One way to avoid frequency splatter is to mask the tone bursts with notched noise (Stapells and Oates 1997), but the drawback of this method is that the effective stimulus is decreased, and the response level is therefore smaller, making it unusable at very low frequencies.
A major difference between human and animal ABR measurements is that in animals ABRs usually are recorded from sedated individuals using subdermal electrodes. Therefore, and because of the proximity of the neural structures in smaller animals, the signal-to-noise level is much more favorable in some of the animal studies compared to human recordings. In recent experiments on geckos (Brittan-Powell et al. 2010), for example, the peak amplitude of the transient-evoked ABR approached 10 μV p-p, compared to 500 nV in humans (Don et al., 1993). In this paper, we describe a method, named mABR (masked ABR), that evaluates the auditory thresholds based on the difference between a masked and unmasked transient response. mABR here refers to the output from this measurement and not to masked ABR measurements in general. A similar method was described by Berlin et al. (1991), who showed in a series of ABR experiments in guinea pigs that the thresholds based on masked response was comparable to those based on tone burst responses. Berlin et al. only used the method for high-frequency stimuli (2–15 kHz), which was most relevant for their experimental animals. However, one of the real advantages of the mABR method is that it allows more reliable measurement of low-frequency thresholds (i.e., below 1 kHz). As an added benefit, the constant measurement of the click response is useful for monitoring the animal’s state. Finally, by emitting masker and transient from different directions, it is also possible to evaluate directional hearing in the animal and compare it to eardrum directionality (Christensen-Dalsgaard et al. 2011b). We are presenting data from Tokay geckos, since they are a typical example of a species that is almost impossible to test with behavioral methods. Audiograms of anoles and geckos using ABR have been measured previously, showing a sensitive hearing with peak sensitivities around 30 dB SPL in a frequency range of 600 to 4000 Hz in geckos and 1000 to 7000 Hz in anoles (Brittan-Powell et al. 2010). Thus, we were able to compare our audiograms to these data.
Methods
Eight adult Tokay geckos (Gekko gecko) were acquired from a commercial supplier of unknown age and gender. The animals were kept in terrariums with a 12/12-day night cycle. For the experiments, the geckos were anesthetized by intramuscular injection of ketamine (10 mg/kg, Ketalar 50 mg/ml, Warner Lambert/Parke Davis, Denmark). During the experiments, the animals breathed unassisted. The level of anesthesia was maintained by supplementary injections (half the initial dose) every hour. The experiments were approved by the Danish National Animal Experimentation Board (Dyreforsøgstilsynet).
An anesthetized animal was placed in a holder in the center of an anechoic chamber, surrounded by 12 loudspeakers (JBL 1G, Northridge, CA, USA) placed in a circle around the animal at 1-m distance and separated by 30°. The sound levels at the animal’s ear were measured with a B&K 4144 1/2″ microphone (Brüel & Kjær, Nærum, Denmark), connected to a B&K 5935 Microphone power supply. The microphone was calibrated using a B&K 4231 acoustical calibrator. The pure tones were measured and calibrated as RMS values, and the clicks were measured and calibrated as peak-peak equivalent sound pressure level.
The neural potentials were recorded using three subdermal needle electrodes (Rochester Electro-Medical, FL, USA). One electrode (ground) was placed under the loose skin posterior to the left shoulder blade, another (vertex) was placed medially, dorsal to the brainstem, and the third (mastoid) was placed just above the measurement ear. The impedance between all electrodes was 3 kΩ or less. Signals from the needle electrodes were amplified by an RA4LI headstage, and an RA4PA battery-powered preamplifier and recorded on a RM2 digital signal processor (Tucker Davis Technologies, Alachua, FL, USA) using an optical cable link. Each recording consisted of 2000 samples sampled at a 25 kHz sample rate. The RM2 was controlled by a PC and customized software (QuickABR, SDU, Odense, Denmark) developed by the first author. The software is available on request from the first author. The system developed is highly portable and usable under field conditions (weighing less than 750 g, excluding loudspeaker, but including batteries).
Each measurement in these experiments consisted of an average of 400 recordings with click stimuli (unmasked ABR, see Fig. 2) alternating with 400 recordings, where the click was masked by a tone (masked ABR, see Fig. 2). The click was a ¼ of a 1000 Hz sine with a duration of 0.25 ms. The recordings were done in 320 ms blocks with eight stimulations in each block (see Fig. 2 insert). The masker was switched on and off and the masker phase randomized between blocks, i.e., the masker duration was 320 ms. The system did not record when the masker was switched on or off. The clicks were alternating rarefaction and condensation. The click level was chosen as the lowest level where the click-evoked response has reached its maximum (see Fig. 1). In six animals, this level corresponded to 94 dB SPL peak-peak, but for two animals, the level was 100 dB SPL. The magnitude of the ABR was measured by cross-correlating the masked ABR with the unmasked ABR and dividing this by the autocorrelation of the unmasked ABR. This results in values between 1 (masked and unmasked ABR are identical) and 0 (masked ABR is uncorrelated with unmasked ABR). These values were then fitted by a logistic sigmoid function (see Fig. 3 insert), and the threshold was calculated as the point where the fitted function crossed the 0.05 level. In many cases, this worked well, but in some rare cases (less than 1 %), the objective measurement yielded very inaccurate results (results 50–100 dB from the expected, and a very poor fit), so the results were usually checked by visual inspection. This was done by subtracting the unmasked ABR from the masked ABR, resulting in the change in ABR caused by the masking (mABR, see Fig. 2). The threshold was then set to the masker level where the largest peak in the mABR was more than or equal to twice the amplitude of the background noise. The latency of mABR responses were compared with responses to brief tone bursts, as used in conventional ABR measurements. These tone bursts had a duration of 10 ms with 1 ms rise-fall times and were emitted using the same setup as the mABR stimulation.
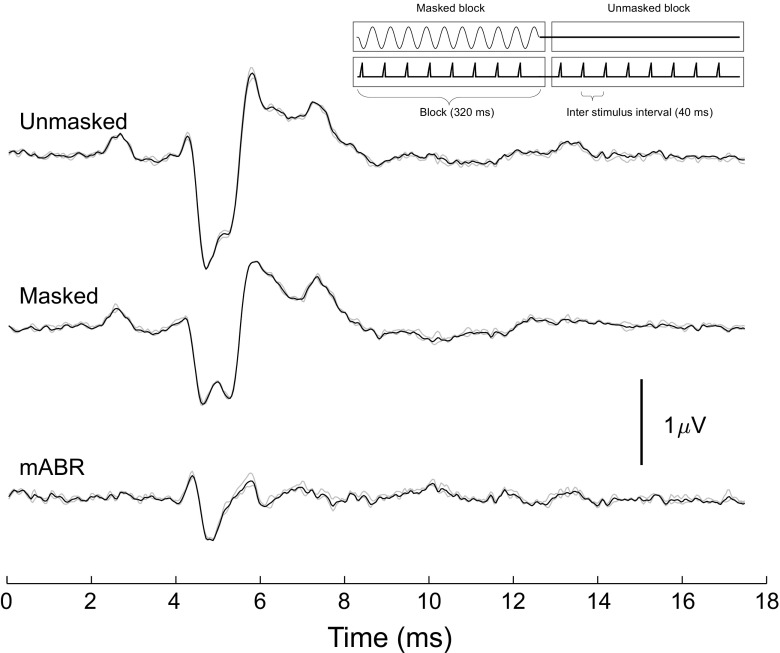
Fig. 2.
The masked ABR in a gecko. The three traces show the response to a 94 dB SPL click (upper), the same click combined with a 70 dB, 300 Hz tone as a masker (middle trace), and the mABR trace (lower) resulting from the subtraction of ABR recorded in the presence of a tone from the ABR from the click alone. The insert shows the pattern of stimulation with a block of eight-masked stimulations being followed by eight-unmasked stimulations. The difference in the shape of the unmasked ABR in this figure compared to Fig. 1 is most likely caused by a difference in the placement of the electrodes
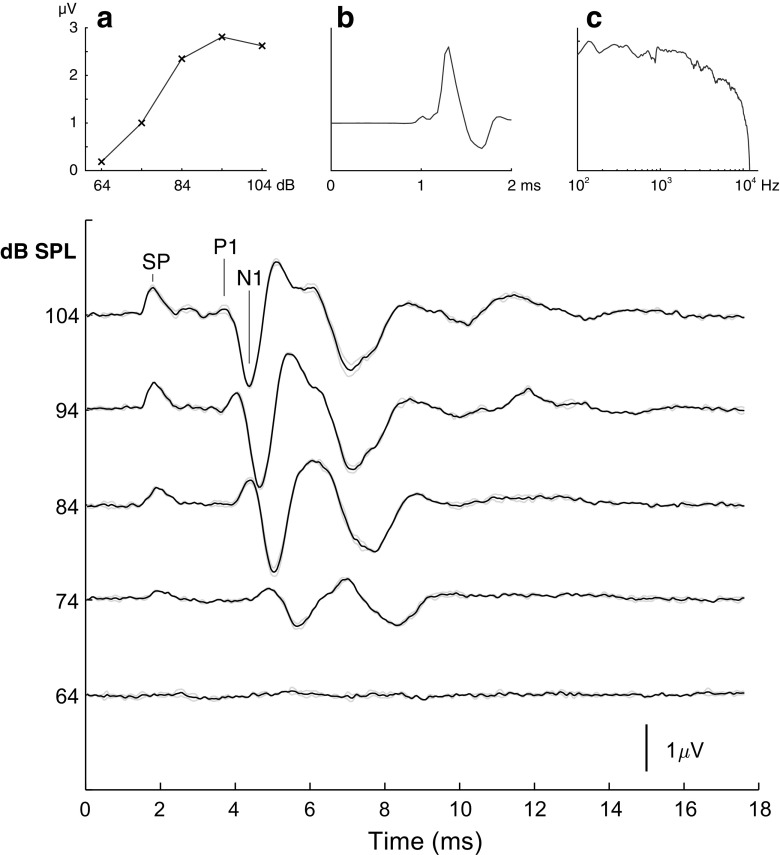
Fig. 1.
A gecko click-evoked ABR. Example of click-evoked ABR traces at five stimulus levels. Each curve is the average of 400 recordings. The two gray lines show averages of even and odd measurements as an indicator of variability. The first peak is assumed to be the summation potential (marked SP). The peaks used for measuring latency is marked P1 and N1. An increase in latency of the peaks is seen with decreasing stimulus intensity. Insert a shows the peak-peak amplitude of the ABR as a function of the click stimulus level for the current example; notice that there is no clear increase in amplitude at the higher click levels. Insert b shows the acoustic click stimulus as recorded at the ear of the animal. Insert c shows the frequency content of the acoustic click stimulus
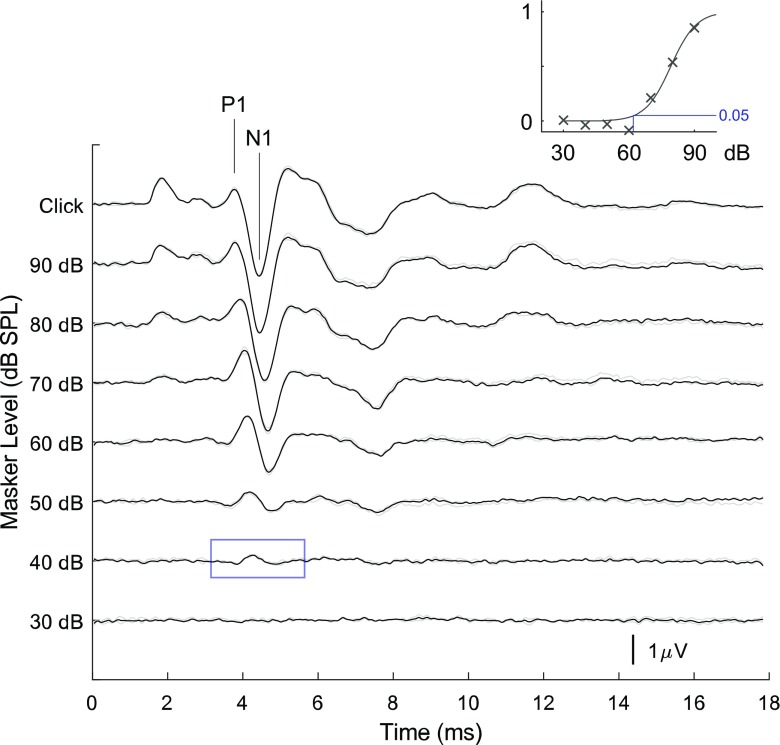
Fig. 3.
mABR as a function of masker level. Series of mABR’s recorded with a masker frequency of 700 Hz and masker sound level from 30 to 90 dB SPL and a click amplitude of 94 dB SPL. The signal marked click is the response to the click alone for comparison. Insert shows the maximum of the cross-correlation between the masked and unmasked ABR divided with the maximum autocorrelation of the unmasked ABR for each masker intensity. The logistic sigmoid function (1/(1 + e^((A−x)B)) is fitted to the data. On visual inspection, the threshold in this figure would be 40 dB SPL (marked with a blue square). The fitting method finds a threshold of 62 dB SPL using a level of 0.05 (marked with a blue line). Notice that the latency of the peaks seems to change less with the change in stimulus amplitude than for the click ABR seen in Fig. 1
To investigate the directional release from masking, mABR’s was recorded where the click was emitted from a loudspeaker in front of the measurement ear, and the masker tone from a different direction. For each direction, a threshold was found. The click was always emitted from the ipsilateral loudspeaker, i.e., at 90° sound incidence (see Fig. 6, insert), and the rest of the setup was identical to the previous experiments.
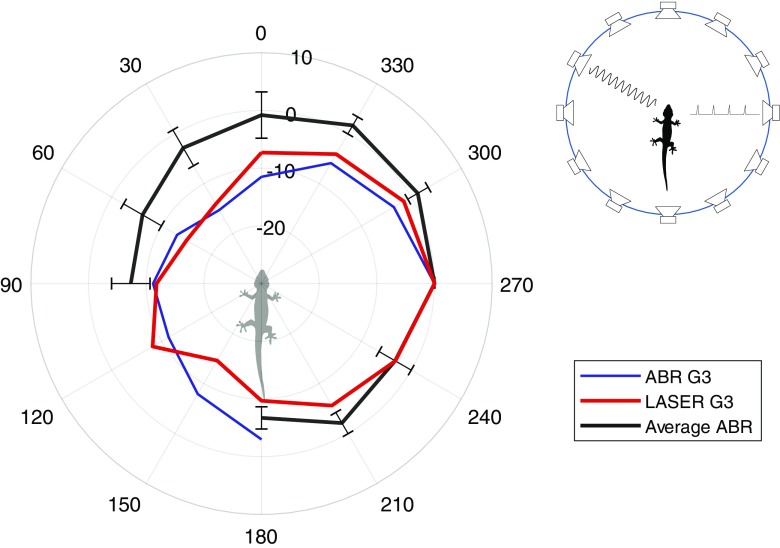
Fig. 6.
Directional mABR. Directionality as measured with ABR (blue line) and with laser vibrometer (red line) from one animal (G3). The black line is the average mABR (± SD) for three other animals. The setup had to be changed to make room for the laser, so the placement of the loudspeakers was different for G3 compared to the other animals. Notice that the ABR and laser measurements for G3 are much closer to each other than to the average ABR for the other animals. Insert (right) shows a diagram of the setup with one loudspeaker (in front of the ear with the ABR electrode) emitting the click and another emitting the masker (from variable directions)
Results
All figures of ABR measurements have been filtered with a 4-kHz low-pass filter, and the ABR responses have been corrected for the travel time between the loudspeaker and the animal. The free-field auditory brainstem response of geckos to a broad-band click (Fig. 1b, c) presented directly ipsilateral to the eardrum with the measuring electrode (Fig. 1) is multipeaked. The first, small positive peak is probably the summating potential (SP). The SP is followed by a positive peak (P1) and a very prominent negative peak (N1), which may be the compound action potential from the auditory nerve. Later peaks may reflect later stages in brainstem processing. The click-evoked responses showed a sigmoidal increase in amplitude with click level (Fig. 1a). This response was evaluated before the masking experiments and used to select an appropriate level of click amplitude. We chose the value where the sigmoidal function is just maximal, which in these experiments corresponds to a stimulus level of 94 dB SPL or in 2 cases 100 dB SPL. The amplitude of the response varied between animals and depended on the exact placement of electrodes but was on average 6.32 ± 3.50 μV for the initial recordings. During the recording session, the response to the click stimulus in all geckos slowly changed, either increasing or decreasing. The median change over a full recording session was by a factor 1.94. That is, the strongest response to the click stimuli is 1.94 times the weakest (the factor is around 1.5 in half of the animals, 2 to 20 times in the other half). The changes in amplitude occur on a timescale of 30–40 min.
To measure the mABR, a tonal masker was added to the same loudspeaker, causing the responses to the click to decrease, and thereby creating a mABR as shown in the example in Fig. 2. At low masker levels, the unmasked and masked responses were largely similar, but at a certain threshold value, a notable difference could be detected. This caused the difference signal (mABR) to increase in amplitude as shown in Fig. 3. The mABR showed a peak response within the time interval of the click response but not coincident with the peak of the unmasked response (see below). The mABR amplitude increased with masker level. The insert in the figure shows the increase in the mABR using masked-unmasked cross-correlation as described in METHODS.
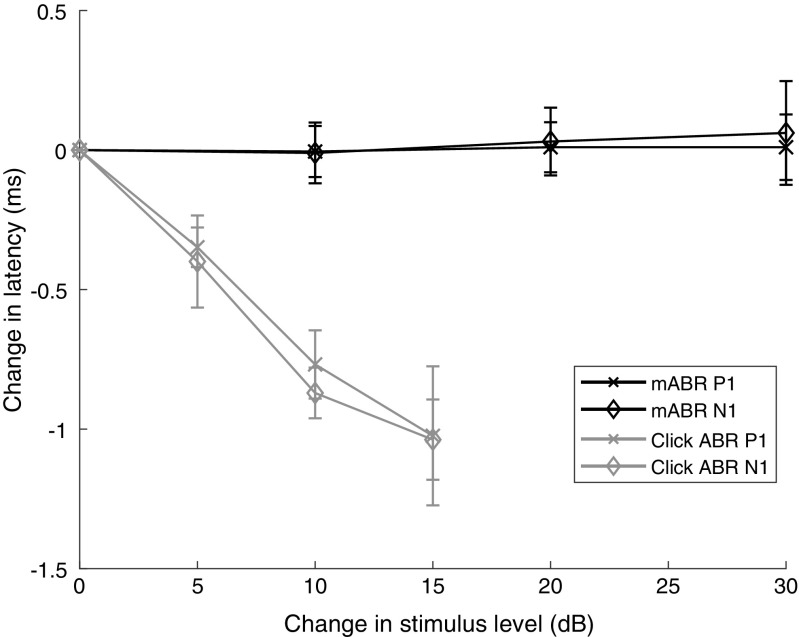
Latency was measured as the time from the arrival of the click at the ear to the first positive peak in the ABR (P1) or to the first negative peak in the ABR (N1). The summation potential was not included, since it was only visible at high intensities (see Fig. 1). The mABR compared with the click ABR responses had the same peak latency for high click levels. However, the latency of the mABR changed only very slightly with masker level, whereas the latency of a click ABR changed consistently with stimulus level. The latency response is shown in Fig. 4. Here, the average mABR latency remained almost constant during a 30 dB change in masker level compared to the click ABR response, where the latency average is reduced with more than 1 ms with an increase of 15 dB in stimulus level. Thus, latencies from traditional ABR and mABR cannot be compared directly. Figure 4 also shows that the change in latency is the same whether one is looking at the first positive peak (P1) or the first negative peak (N1). The average mABR latency of P1 was 6.4 ± 1.3 ms, and for N1, it was 7.1 ± 1.4 ms.
Fig. 4.
Latency function for mABR. The change in latency of the first positive peak in the mABR (mABR P1) and the first negative peak (mABR N1) as a function of change in masker level. The figure shows the average latency (± SD) for eight geckos (all with a masker frequency of 1000 Hz). For comparison, the change in latency for a traditional click ABR as a function of change in click level is shown for the first positive peak (click ABR P1) and the first negative peak (click ABR N1). Notice that the latency of the click ABR clearly drops with increasing stimulus level, while the latency of the masked ABR stays constant or even slightly increases with increasing stimulus level
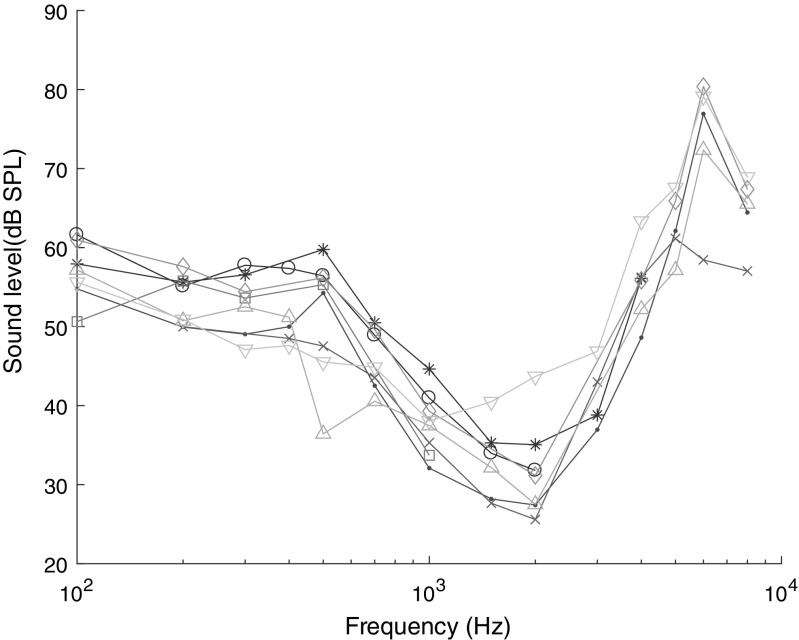
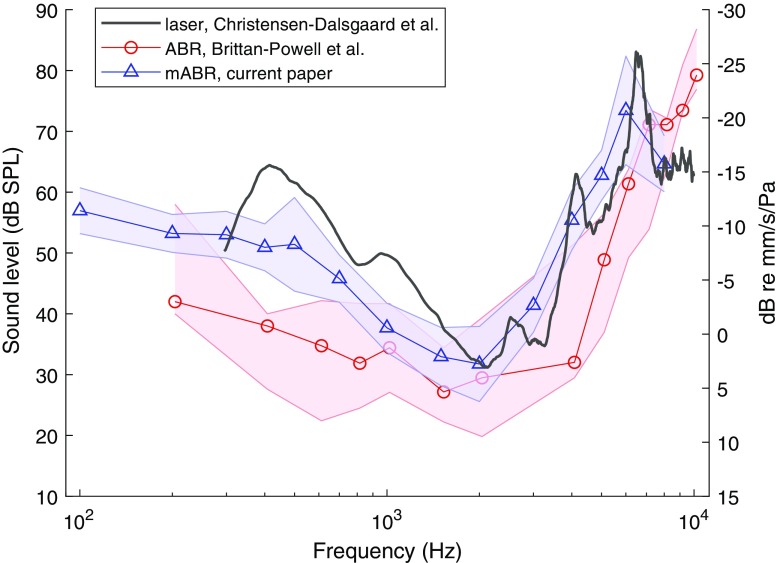
Auditory thresholds were calculated from the mABR as described in the METHODS. The resulting audiograms for eight geckos are shown in Fig. 5. The audiograms show a peak at 1–2 kHz with the lowest thresholds around 25 dB SPL, a fairly steep increase at higher frequencies, and a shallow increase towards lower frequencies. The average audiogram from these data is shown in Fig. 7, where it is compared with the results from free-field eardrum vibration transfer function from one gecko measured by laser vibrometry (from Christensen-Dalsgaard et al. 2011b) and a traditional ABR-based audiogram from Brittan-Powell et al. (2010). That comparison shows that the mABR in general is less sensitive than the traditional ABR, but this difference is 10–20 dB at frequencies below 1 kHz and 0–5 dB up to 3 kHz, where the difference becomes larger again. Compared to the laser vibrometry measurements, the mABR audiogram is quite similar but with the whole curve shifted slightly towards higher frequencies.
Fig. 5.
Individual ABR audiograms for eight geckos. Lowest thresholds (around 30 dB SPL) are found at 2 kHz. Thresholds were almost uniform from 100 to 500 Hz. Above 2 kHz, the sensitivity for all animals dropped steeply
Fig. 7.
Comparison with other measurements. Blue triangles are the average audiogram (± SD) from the current paper. Red circles are median audiograms and ranges from Brittan-Powell et al. (2010). Note that the present data are generated using free-field stimulation, whereas the data from Brittan-Powell et al. were generated using closed-field stimulation. Black line is the free-field eardrum vibration transfer function from one gecko measured by laser vibrometry (from Christensen-Dalsgaard et al. 2011a, b). The data from the laser is shown in dB re mm/s/Pa, while the other measurements are in dB SPL
The full directional ABR was only recorded on four animals, with the summary data from three animals shown in Fig. 6 as an average. The effect of masking was largest when the masker originated from the loudspeaker directly in front of the measurement ear (ipsilateral) and decreased with on average 7 dB on the opposite side of the head (contralateral).
The recording of the last animal (G3) is shown as a separate example in Fig. 6. It was necessary to change the recording setup to make room for the laser, so this animal had a different loudspeaker placement; it was therefore not included in the average. For this example, the release from masking was again strongest when the masker is presented from contralateral directions. We also measured eardrum vibration transfer functions in the same animal (data from Christensen-Dalsgaard et al. 2011b) stimulated by free-field sound at 1 kHz. The two plots were normalized to the same level at 90 ° sound incidence. For both measurements, there was a 10–15 dB difference in sensitivity between ipsi- and contralateral angles. Note that the laser measurement and the ABR for G3 were far closer to each other than to the average ABR for the other animals.
Discussion
One of the main reasons for developing this method was that brief tone bursts are inadequate stimuli at low frequencies, because of the generation of frequency splatter. On the other hand, since the ABR is an onset response, increasing the length of the tone burst means that the signal no longer effective as a stimulus. Our measure, derived from ABRs by masking the click-evoked response, can be used to generate audiograms (Fig. 5) as well as directional response curves (Fig. 6).
The gecko free-field audiogram has a similar shape as a recently published gecko audiogram based on tone burst closed-field stimulation (Brittan-Powell et al. 2010, Fig. 7) showing a peak around 1.6 kHz. However, the thresholds in the present experiment are higher, and the audiograms deviate especially at low and high frequencies. Part of this deviation may be due to the different stimulation. Closed-field stimulation is more effective at low frequencies than free-field stimulation, as has been shown for geckos and other animals (see Christensen-Dalsgaard and Manley 2013). However, part of the deviation, especially at the lowest frequencies (below 300 Hz), could be due to an overestimation of sensitivity from brief low-frequency tone bursts. With 10 ms tone bursts, signals nominally at 300 Hz and below contain less than 3 cycles and are in reality broad-band signals that might stimulate high-frequency receptors (Brittan-Powell et al. 2010). Also, the shape of the audiogram agrees well with the free-field eardrum vibration transfer function (Fig. 7). This supports the idea that the mABR is a more accurate estimate of the threshold at low frequencies.
In this paper, we used an automated method for determining the thresholds from the mABR recordings. This method gave in most cases a consistent result and when it failed it was obvious enough that the results would not accidentally be included in results. However, as it can be seen in Fig. 3, the thresholds from this method were usually higher that the ones found using visual inspection. This is an effect of what point on the fitted function is chosen as the threshold. It is also possible to use a correction factor when comparing results from different ABR types as is already done with clinical ABR recordings. An advantage of this method is that it can accurately determine the threshold without having to measure all the in-between values. When trying to determine thresholds, researchers often record the ABR with a 10 dB step size and then when an approximate threshold is known, the researcher start measuring around that threshold with a higher resolution. This requires more recordings and the researcher must evaluate and decide what to record during a recording session. The method presented here can instead be used on a few recordings and from that calculate the threshold even if there is no recording done at the exact threshold.
As shown in Fig. 4, the intensity-latency curves for tone burst ABR and mABR are different. A likely explanation for the different latency relationship for tone burst ABR and mABR is that the masker only affects a narrow frequency range of the click response, and therefore does not affect the latencies of most auditory fibers. Our measurements of latencies in tone burst ABR agrees well with the latency relationship described by Brittan-Powell et al. (2010). It is important to be aware of this difference in the latency function between mABR and click ABR, since it means that a comparison of latencies between the two usually will be meaningless. One could expect the latency of the mABR to change at high masker intensities, since there should be a spread of masking over a significant frequency range. But, this is not observed in the current experiments. There might also be an effect of suppression from the masker tone at higher levels and that might be interesting to investigate further, but it is unlikely to occur around the auditory threshold.
An advantage of the mABR is the continuous monitoring of response level. We have seen in the course of our experiments, especially in ectothermic animals (geckos, anoles, turtles, and different frog species), that fluctuations in response level of the unmasked click are not uncommon during the 1–2 h session needed to measure a complete audiogram (also when the animal recovers fully after the experiment). This is a serious problem for any method depending on absolute response level and may justify the longer time used for measuring relative response levels in the mABR measurements. Also, the continuous measurement of the unmasked response is a measure of the state of the animal—constantly declining click responses can be used as an indication of poor physiological state. In half of our animals, the change in response level was around a factor 1.5, which should not change the results of a traditional ABR measurement too much, but in the rest the change was larger, in one case, it increased with a factor 20, and we expect that would seriously change any result of a traditional ABR recording. The mABR recording on the other hand looks at the relative change in ABR, so it should be less affected by this change. In the future, it would be interesting to investigate if there is a correlation between anesthesia level or body temperature and this change in the ABR amplitude.
Finally, the use of masking enables measurements of directionality by playing the masker from different direction. This is simple to do compared to other methods, either behavioral, biophysical, or neurophysiological. As shown in Fig. 6, the results obtained from directional mABR are similar to the results obtained using laser vibrometry, showing ovoid directional characteristics with 7–15 dB difference between ipsi- and contralateral sound directions. This has been used in recent measurements of alligator directional hearing (Bierman et al. 2014). It is interesting to notice that the ABR and the laser measurement recorded from the same animal are very similar compared to the ABR recordings from other animals. This is similar to others as yet unpublished experiments from our lab that shows a large intersubject variability for gecko directional hearing.
The disadvantage of the mABR compared to tone burst ABR is that it depends on a high signal-to-noise ratio of the response, since a subtraction of two signals will lead to a significant increase in the noise level of the difference signal, and ultimately to a need for a higher number of averages. Since the measurement time is already twice as long as needed for a tone burst measurement (as both masked and unmasked response is measured), low signal amplitudes as found in human ABR will probably make such a method impractical, as stated by Berlin et al. (1991). A further disadvantage is that it is not clear where exactly the tonal response, as reflected in the mABR, is generated. Since two signals are presented at the same time, the response could potentially reflect non-linearities and suppression in addition to energy masking. Further studies are needed to clarify exactly where the response is generated. Here, the mABR audiogram is similar to the conventional behavioral audiogram that is really a “black box” response of the entire auditory system. The results measured here in the gecko are qualitatively similar to the data reported from the guinea pig by Berlin et al. (1991), i.e., growth of the derived response and the decrease of latency of the derived signal with masker level. Additionally, we have shown that the method can be used not only to characterize audiograms, but also to measure directionality. As such, it could be a faster method to study directional hearing in animals that are difficult to train, and where more invasive neural recordings are difficult. Also, it should be noted that as in other ABR studies the level of anesthesia for these experiments is very mild (only sedation is needed), and together with the non-invasive recording the animals almost always recover fully from the experiments, an important factor in studying rare or hard to obtain species.
The mABR has already shown its usefulness in a number of animal studies in our laboratory, such as squid (Mooney et al. 2010), lungfish (Christensen-Dalsgaard et al. 2011a), geckos (present study), turtles (Christensen-Dalsgaard et al. 2012) frogs (Hoke et al., in prep), and alligators (Bierman et al. 2014). This is also due to the very portable setup (Brandt et al. 2008), which can run off a battery-powered PC, and therefore is very convenient for field applications. Further studies will explore the possibilities of comparing hearing (also directional hearing) in a variety of different species, especially those where behavioral methods are unusable.
Funding Information
This study was supported by the Danish National Science Foundation [grant DFF1323-00132] and the Carlsberg Foundation grants to J.C.D.
Compliance with Ethical Standards
Conflict of Interest
The authors declare that they have no conflict of interest.
References
- Berlin CI, Hood LJ, Barlow EK, Morehouse CR, Smith EG. Derived guinea pig compound VIIIth nerve action potentials to continuous pure tones. Hear Res. 1991;52:271–280. doi: 10.1016/0378-5955(91)90017-4. [DOI] [PubMed] [Google Scholar]
- Bierman HS, Thornton JL, Jones HG, Koka K, Young BA, Brandt C, Christensen-Dalsgaard J, Carr CE, Tollin DJ. Biophysics of directional hearing in the American alligator (Alligator mississippiensis) J Exp Biol. 2014;217:1094–1107. doi: 10.1242/jeb.092866. [DOI] [PMC free article] [PubMed] [Google Scholar]
- Brandt C, Andersen T, Christensen-Dalsgaard J. Demonstration of a portable system for auditory brain stem recordings based on pure tone masking difference. In: Dau T, Buchholz JM, Harte JM, Christiansen TU, editors. Auditory signal processing in hearing-impaired listeners. 1st International symposium on auditory and audiological research. Copenhagen: Centertryk; 2008. pp. 241–247. [Google Scholar]
- Brandt C, Malmkvist J, Nielsen RL, Brande-Lavridsen N, Surlykke A. Development of vocalization and hearing in American mink (Neovison vison) J Exp Biol. 2013;216:3542–3550. doi: 10.1242/jeb.080226. [DOI] [PubMed] [Google Scholar]
- Brittan-Powell EF, Dooling RJ, Gleich O. Auditory brainstem responses in adult budgerigars (Melopsittacus undulatus) J Acoust Soc Am. 2002;112:999–1008. doi: 10.1121/1.1494807. [DOI] [PubMed] [Google Scholar]
- Brittan-Powell E, Christensen-Dalsgaard J, Tang Y, Carr CE, Dooling R. The auditory brainstem response in lizards. J Acoust Soc Am. 2010;128:787–794. doi: 10.1121/1.3458813. [DOI] [PMC free article] [PubMed] [Google Scholar]
- Burkard RF, Don M. The auditory brainstem response. In: Burkard RF, Don M, Eggermont JJ, editors. Auditory evoked potentials. Basic principles and clinical applications. Philadelphia: Lippincott Williams &Wilkins; 1997. pp. 229–253. [Google Scholar]
- Christensen-Dalsgaard J, Manley GA. The malleable middle ear: an underappreciated player in the evolution of hearing in vertebrates. In: Köppl C, Manley GA, Fay RR, Popper A, editors. Insights from comparative hearing research. Springer Handbook of Auditory Research. New York: Springer; 2013. pp. 157–191. [Google Scholar]
- Christensen-Dalsgaard J, Brandt C, Wilson M, Wahlberg M, Madsen PT. Hearing in the African lungfish, Protopterus annectens. Preadaptations for pressure hearing in tetrapods? Biol Lett. 2011;7:139–141. doi: 10.1098/rsbl.2010.0636. [DOI] [PMC free article] [PubMed] [Google Scholar]
- Christensen-Dalsgaard J, Tang YZ, Carr CE. Binaural processing by the gecko auditory periphery. J Neurophys. 2011;105:1992–2004. doi: 10.1152/jn.00004.2011. [DOI] [PMC free article] [PubMed] [Google Scholar]
- Christensen-Dalsgaard J, Brandt C, Willis KL, Christensen CB, Ketten D, Edds-Walton P, Fay RR, Madsen PT & Carr CE (2012) specialization for underwater hearing by the tympanic middle ear of the turtle, Trachemys scripta elegans. Proc Roy Soc B 279: 2816–2824 [DOI] [PMC free article] [PubMed]
- Corwin JT, Bullock TH, Schweitzer J. The auditory brain stem response in five vertebrate classes. Electroencephalogr Clin Neurophysiol. 1982;54:629–641. doi: 10.1016/0013-4694(82)90117-1. [DOI] [PubMed] [Google Scholar]
- Don M, Ponton CW, Eggermont JJ, Masuda A. Gender differences in cochlear response time: an explanation for gender amplitude differences in the unmasked auditory brainstem response. J Acoust Soc Am. 1993;94(4):2135–2148. doi: 10.1121/1.407485. [DOI] [PubMed] [Google Scholar]
- Kodera K, Yamane H, Yamada O, Suzuki JI. The effects of onset, offset, and rise-decay times of tone bursts on brain stem responses. Scand Audiol. 1977;6:205–210. doi: 10.3109/01050397709043122. [DOI] [PubMed] [Google Scholar]
- Mooney TA, Hanlon RT, Christensen-Dalsgaard J, Madsen PT, Ketten DR, Nachtigall P. Sound detection by the longfin squid (Loligo pealeii) studied with auditory evoked potentials: sensitivity to low-frequency particle motion and not pressure. J Exp Biol. 2010;213:3748–3759. doi: 10.1242/jeb.048348. [DOI] [PubMed] [Google Scholar]
- Stapells DR, Oates P. Estimation of pure-tone audiogram by the auditory brainstem response: a review. Audiol Neuro-Otol. 1997;2:257–280. doi: 10.1159/000259252. [DOI] [PubMed] [Google Scholar]
- Walsh EJ, Gorga M, McGee J. Comparisons of the development of auditory brainstem response latencies between cats and humans. Hear Res. 1992;60:53–63. doi: 10.1016/0378-5955(92)90058-U. [DOI] [PubMed] [Google Scholar]


