Abstract
The domestic ferret is a uniformly lethal model of infection for 3 species of Ebolavirus known to be pathogenic in humans. Reagents to systematically analyze the ferret host response to infection are lacking; however, the recent publication of a draft ferret genome has opened the potential for transcriptional analysis of ferret models of disease. In this work, we present comparative analysis of longitudinally sampled blood taken from ferrets and nonhuman primates infected with lethal doses of the Makona variant of Zaire ebolavirus. Strong induction of proinflammatory and prothrombotic signaling programs were present in both ferrets and nonhuman primates, and both transcriptomes were similar to previously published datasets of fatal cases of human Ebola virus infection.
Keywords: animal model, Ebola virus, ferret, transcriptomics, vaccines
Ebolaviruses, along with closely related Marburgviruses, are negative sense, single-stranded, filamentous ribonucleic acid (RNA) viruses from the Filoviridae virus family [1]. Since 1976, ebolaviruses have caused sporadic outbreaks of Ebola hemorrhagic fever (EHF) throughout Central Africa [1, 2]. Because of the sporadic nature of human outbreaks, little was known about the host-virus interaction during the acute human disease and associated sequelae after recovery. A significant amount of understanding of viral pathogenesis has been gained through the study of animal models of Zaire ebolavirus (EBOV) infection.
Historically, nonhuman primates (NHPs) have been used for modeling filovirus pathogenesis for countermeasure development because they most accurately recapitulate features of human disease including uncontrolled viral replication, unchecked immune response, vascular leakage, and a consumptive coagulopathy, all of which results from infection with virus isolates derived directly from human patients [1, 3]. The NHP model has also been used to analyze the host response to EBOV infection using transcriptomics [4–8]. Results of these studies indicate that the host mounts a multiphasic response to infection that includes an early innate immune activation occurring at or before the appearance of clinical symptoms. This response is followed by the appearance of a significant cytokine response that is quickly followed by an acute phase response. These studies emphasize the importance of the immune response as part of the pathogenesis in EHF.
Many immunocompetent rodent models have been developed for different isolates of ebolaviruses including mice, hamsters, and guinea pigs; however, most of them require viral adaptation or the use of immunodeficient rodents to achieve lethality or reproduce hallmark features of filovirus disease [9, 10]. This considerably limits usefulness of these models in countermeasure development and in defining basic aspects of pathogenesis where reliance on an intact immune response is essential for a more authentic reproduction of human disease [10].
The domestic ferret has recently been described as an attractive model of ebolavirus pathogenesis. Uniformly lethal infection has been demonstrated for 3 species of ebolavirus that are pathogenic in humans and NHPs; EBOV, Sudan ebolavirus, and Bundibugyo ebolavirus [11–13]. The ferret not only recapitulates hallmark features of filovirus disease, but it does so without the need for host adaptation needed in rodent models of filovirus disease. It is interesting to note that infection of Marburg virus and Ravn virus in ferrets does not cause disease despite clear evidence of infection [14].
Despite decades of use as a model for many important human pathogens including influenza and rabies, the ferret still lacks in reagents to dissect many aspects of host response to infection [15]. Transcriptomics has often been used to study filovirus infection dynamics in NHPs and, more recently, human infections [4–8, 16, 17]. The recent publication of an annotated draft genome for the ferret in the context of viral infection offers a new opportunity to examine the circulating responses of ferrets after ebolavirus infection [18]. These recent advances present the opportunity to more precisely define the similarities and differences in the host response to ebolavirus infection in different organisms. In this work, we analyzed longitudinal samples from natural history studies of EBOV infection in both ferrets and NHPs to compare the systemic responses to infection with EBOV. These data were also set in comparison with human transcriptomic data derived from the recent West African outbreak in an effort to compare host responses across all 3 species (ie, ferrets, rhesus macaques, and humans) infected with the same variant of EBOV [16].
MATERIALS AND METHODS
Ethics Statement
This research was performed in accordance with animal study protocols approved by the Institutional Animal Care and Use Committee of both the University of Texas Medical Branch and the National Institute of Allergy and Infectious Diseases (NIAID) Division of Clinical Research, which is part of the National Institutes of Health (NIH). Protocols adhere to the recommendations stated in The Guide for the Care and Use of Laboratory Animals and were developed in compliance with the US Department of Agriculture Animal Welfare Act regulations, US Public Health Service Policy on Humane Care and Use of Laboratory Animals, NIH policies and guidelines, and other federal statutes and regulations relating to animals and experiments involving animals. The University of Texas Medical Branch (UTMB), Galveston National Laboratory (GNL), and the NIAID Integrated Research Facility (IRF)-Frederick, where the research was conducted, are both fully accredited by the Association for Assessment and Accreditation of Laboratory Animal Care, International. All work with infectious EBOV and potentially infectious materials derived from animals was conducted in a biosafety level 4 laboratory at either the GNL-UTMB (Galveston, TX) or NIAID IRF-Frederick.
Animal Challenge, Disease Monitoring, and Biological Sampling
Detailed information on in vivo procedures can be found in the Supplemental Data. In brief, 3 healthy female ferrets and 12 rhesus macaques (Macaca mulatta) were challenged with 1000 plaque-forming units (PFUs) of EBOV (Makona C07 variant) intranasally or intramuscularly, respectively. Of the 12 NHPs used for analysis, a subset of samples was not included in this work because they were part of a postexposure treatment study, beginning on day 5; thus, only sampling time points before treatment (days 0, 3, 5) and samples from untreated control animals were used in this analysis [19].
Hematology and Clinical Chemistry
Detailed procedures for analysis of hematology and clinical chemistry parameters can be found in the Supplemental Methods.
Virus Isolation
Determination of infectious virus in plasma was made using conventional plaque assay. In brief, plasma was assayed in increasing 10-fold dilutions through adsorption to Vero E6 cell monolayers in duplicate wells and stained with 5% neutral red containing phosphate-buffered saline before counting. The limit of detection was 25 PFU/mL plasma.
Transcriptomic Library Preparations, Sequencing, and Bioinformatics Analysis
Ferret and primate RNA was isolated from whole blood using TRIzol per manufacturer’s instructions. Details for RNA library preparation and sequencing can be found in the Supplemental Methods.
Statistics Statement
Data are presented as the mean calculated from replicate samples taken from each experimental subject at each time point, not replicate assays, and error bars represent the standard deviation (SD) across replicates. Statistical inferences made from bioinformatics analysis were made with standard software packages for alignments and identification of differentially expressed genes.
RESULTS
Disease Progression in Ferrets and Nonhuman Primates
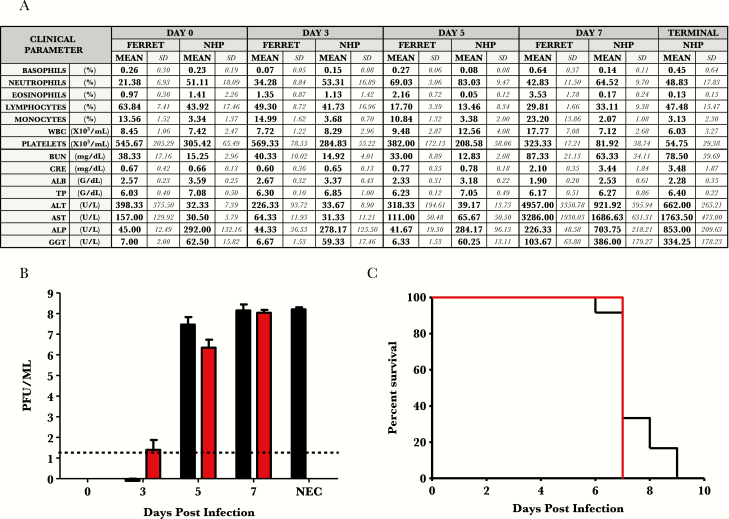
The clinical disease course of all ferrets was closely monitored after challenge and followed previously observed findings. All 3 ferrets succumbed on day 7 postinfection (PI) (Figure 1C). Gross inspection at necropsy revealed hallmark features of EHF in ferrets as previously reported [11–13] (histopathology data not shown). All NHPs analyzed developed progressive disease consistent with a lethal dose of EBOV as previously described with a time to euthanasia ranging from day 6 to 9 PI (Figure 1C) (histopathology data not shown) [19–21].
Figure 1.
Natural history data of Ebola-Makona infection in ferrets and rhesus macaques: hematology, clinical chemistry, and viremia after exposure to Ebola virus-Makona isolate in ferrets and rhesus macaques. (A) Hematology and clinical chemistry data. (B) Viremia through course of infection (log10 PFU/mL). Red bars = ferret samples. Black bars = macaque samples. (C) Kaplan-Meier survival curve. Red lines = ferret samples. Black lines = macaque samples. Abbreviations: ALB, albumin; ALP, alkaline phosphatase; ALT, alanine aminotransferase; AST, aspartate aminotransferase; BUN, blood urea nitrogen; CRE, creatine; GGT, gamma-glutamyl transferase; NEC, necropsy; NHP, nonhuman primate; PFU, plaque-forming units; SD, standard deviation; TP, total protein; WBC, white blood cells.
Hematology and Serum Biochemistry
All ferrets had progressive granulocytosis, lymphocytopenia, and thrombocytopenia beginning on day 3 PI, whereas macaques began on day 3 for each of these parameters. Progressive monocytosis, eosinophilia, neutrophilia, and basophilia were noted mainly in late stages of disease of ferrets. Evidence of multiorgan failure in both ferrets and NHPs was noted in terminal serum samples as indicated by striking increases in concentrations of enzymes associated with liver function (aspartate aminotransferase, alanine aminotransferase, alkaline phosphatase, and gamma-glutamyl transferase) and markers of kidney dysfunction (blood urea nitrogen and creatine). Evidence of vascular leakage was also noted with hypoalbuminemia and yet no overt hypoproteinemia in both species (Figure 1).
Circulating Infectious Virus
Plasma viremia was detected on day 3 PI in 1 ferret (2 log10 PFU/mL) and 1 NHP (1 log10 PFU/mL). By day 5, all animals of both species were comparably viremic (ferrets = 6.2 [±0.32 SD] log10 and NHP = 7.3 [±0.4 SD] log10 PFU/mL). Terminal viremia in ferrets and NHPs were similar in titer at approximately 6–7 log10 PFU/mL (Figure 1).
Ribonucleic Acid-Sequencing Library Analysis
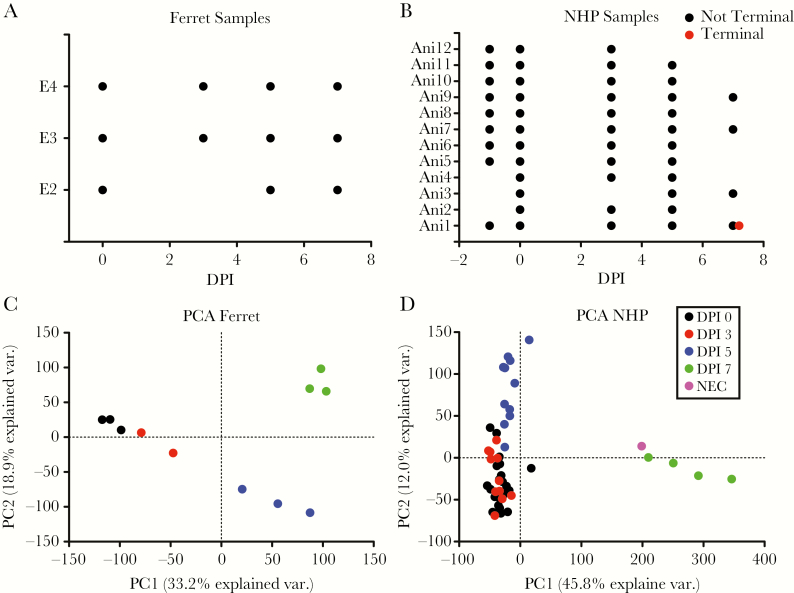
Ribonucleic acid sequencing was performed on whole blood samples from the 3 ferrets (Figure 2A). One sample at day 3 PI was of low sequence quality and was removed. All samples from the 12 NHPs (Figure 2B) were sequenced, and 6 samples were removed for sequence quality issues. We used principal component analysis to determine how the different samples in each model clustered at different days PI. For the ferret samples, intraday samples clustered together, with samples from each day clearly separating from one another. In NHPs, similar intraday clustering was also apparent, with the exception that only a minor difference was observed between day 0 and day 3 PI. Minimal variance was observed from day 7 to samples taken at necropsy because these samples were collected within similar timeframes. The ability to separate the day 3 PI from day 0 suggests that the ferret may have a stronger differential expression signature at day 3 than the NHP.
Figure 2.
General overview of ribonucleic acid sequencing in ferrets and nonhuman primates (NHPs): (A) general overview of the ferret samples used in the transcriptomic analysis. The x-axis is the days postinfection (DPI), and the y-axis is the different ferret identifiers. Each point is an individual sample used in the analysis. (B) A similar graph for the NHP samples shows the time of sample collection. Here, the terminal sample is shown in red, and the samples from an alive animal are in black. (C) Principal component analysis (PCA) of the general transcriptional changes observed in the ferret. The x-axis is the variance on the first PC, and the y-axis is the second PC. Each point is an individual sample for an individual animal. The colors are different days post exposure (PE) with black denoting day 0, red is day 3 PI, blue is day 5 PI, green is day 7 PI, and purple is necropsy. (D) A similar plot as in C but for the NHP samples. Abbreviation: NEC, necropsy.
Global Analysis of Gene Responses Across Species
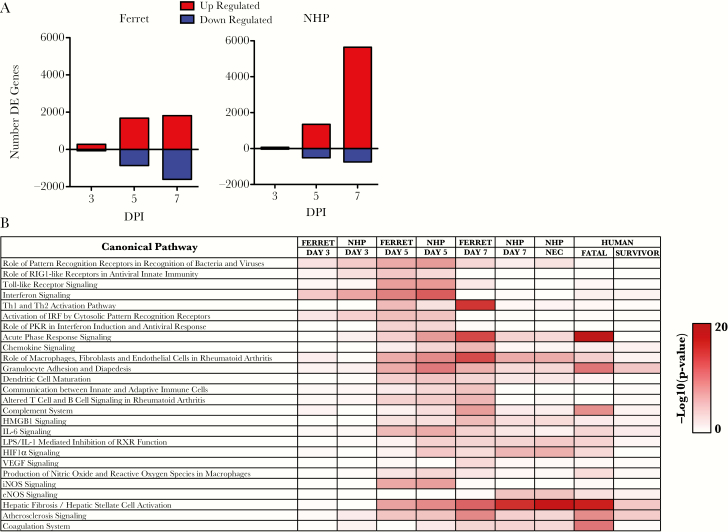
We next assessed the patterns of messenger RNA (mRNA) expression over time in ferrets and NHPs exposed to EBOV. In both species, a small set of genes was differentially expressed by day 3 PI (346 for ferrets and 110 for NHPs) (Figure 3A). The number of differentially expressed genes increased by day 5 PI with similar number of genes identified as upregulated (~1800 vs 1700) and ~800 genes being identified as downregulated in the ferret compared with ~500 in the NHP. At the near terminal stages, the number of upregulated genes in the ferret was similar to that seen at day 5 PI, whereas the number of downregulated genes doubled in NHPs. The NHPs showed a large increase in upregulated genes and a modest increase in the number of downregulated genes. These findings suggest that there are differences in the transcriptional response in these animals especially near the terminal time points.
Figure 3.
Overview of the differentially expressed genes identified: (A) number of differentially expressed genes identified in the ferret (left) or the nonhuman primate (NHP) (right). The x-axis is the days postinfection (DPI), and the y-axis is the number of differentially expressed genes. Red bars represent genes upregulated, and blue bars represent genes that are downregulated. (B) Results from Ingenuity Pathways Analysis. The pathways are shown in rows, and samples at different times are shown in columns. The color value (white to red) in the boxes are representations of Fisher’s exact test, indicating significance (P > 0 −log10) of each canonical pathway, represented by sequences in each sample. Human data derived from Liu et al [16]. Abbreviations: DE, differentially expressed; HMGB1, high mobility group box-1; IL, interleukin; iNOS, inducible nitric oxide synthase; RIG, retinoic acid-inducible gene; VEGF, vascular endothelial growth factor.
To further characterize gene expression patterns seen in ferrets and NHPs over time, Ingenuity Pathways Analysis (IPA) was used to identify what pathways were differentially regulated as determined from conserved gene orthologs between species. At day 3 PI, IPA identified upregulation of 2 pathway types, those involved in pattern receptor recognition and interferon signaling for both NHP and ferret samples (Figure 3B). At day 5 PI, NHPs and ferrets had very similar pathways upregulated that were mostly associated with acute phase responses to infection including the following: cytokine/chemokine signaling, interferon signaling, Toll-like receptor signaling, and granulocyte adhesion and diapedesis. At day 7 PI, the pathways showed continued activation of these pathways in both ferrets and NHPs.
To compare these responses to the human transcriptional response to EBOV infection, we also analyzed pathways from humans suffering from EHF by utilizing conserved orthologs of genes present in all 3 species (Figure 3B). Data for this analysis were derived from previously published datasets obtained from a cohort of patients from the recent 2013–2016 EBOV epidemic [16]. Through this comparison, it appears that ferrets and NHPs contain many important similarities to fatal human infection at a transcriptomic level with respect to acute phase signaling, granulocyte activity, and coagulation system activation.
Focused Analysis Gene Pathways Across Species
To more closely analyze the similarities and differences of gene expression between the ferret and NHP over time, we used an ortholog matching method on different groups of genes previously identified to play significant roles in EBOV pathogenesis. This matching allowed determination of when a gene group was most similar for either uniquely expressed genes at a given time point or generally had a high overlap. The gene groups analyzed were interferon-stimulated genes (ISG), cytokine genes, and coagulation markers because these gene groups have been shown to have the strongest expression in human EHF.
Interferon-Stimulated Gene Expression
The first set of genes analyzed were ISGs. For this gene set, we narrowed down the search to only include ISGs that had a direct 1:1 match between the ferret and NHP transcriptome as determined by the Ensembl database. A total of 11687 genes were analyzed, 185 of which were identified as ISGs. We used this matched set of ISGs and characterized their expression patterns over the course of EBOV infection in ferrets and NHPs. We first identified upregulated genes based on their temporal expression pattern. Genes that were upregulated at day 3 PI and maintained increased expression thereafter were included in the set of genes upregulated at day 3 PI only. Those that first showed upregulation at day 5 PI and beyond were counted as day 5 PI only.
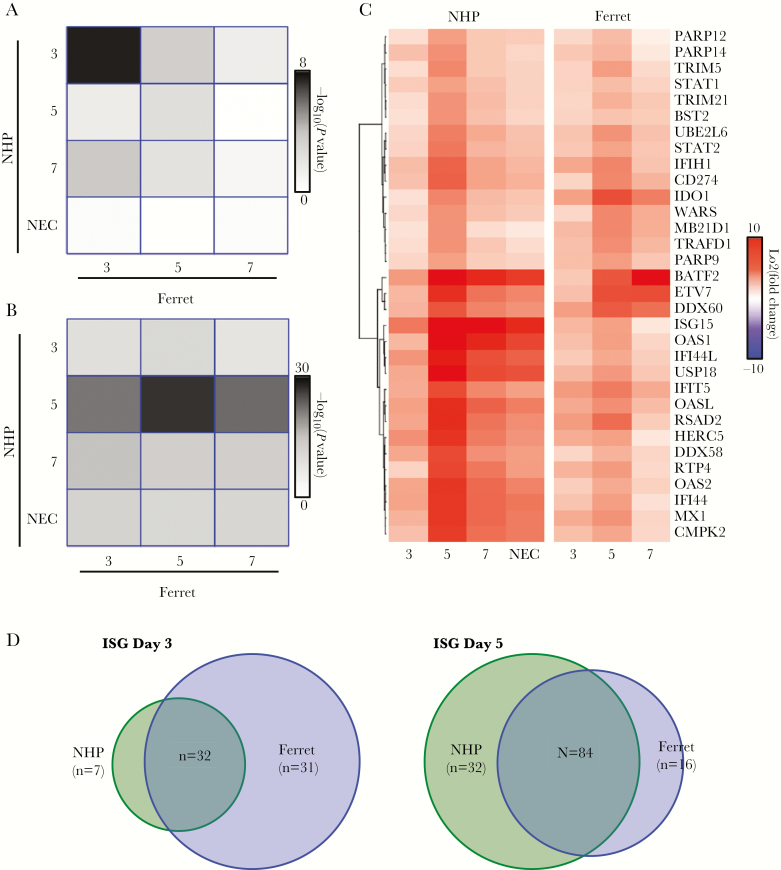
When we compared upregulated ISGs on each day in ferret to each day in NHPs (Figure 4A), we found that the strongest match occurred at day 3 PI (P value of overlap 4 × 10⁻⁸). A significant overlap in gene expression was also observed at day 5 PI (P value of overlap 1 × 10⁻²) with less observed at day 7. The lack of significant overlap at day 7 was due to only 2 newly upregulated ISGs at day 7 PI in the NHP and 10 ISGs in the ferret. This confirmed that ISGs are an early response to EBOV infection in ferrets and NHPs and that this response is continued over the course of infection.
Figure 4.
Comparison of interferon-stimulated gene (ISG) expression in ferret and nonhuman primate (NHP): (A) conservation of uniquely upregulated ISG between ferret (columns) and NHP (rows) over the various days. The colors represent the –log10 (P value) from a Fisher’s exact test to determine whether the overlap at a given day is significant. (B) Similar plot as in A but for generally upregulated genes. (C) Heatmap of the conserved ISGs identified from overlap analysis. Red represents stronger upregulation, and blue is downregulation. Fold changes compared with day 0 are shown.
The overall expression pattern of the ISGs found to be upregulated early, by day 3 PI, in both ferrets and NHPs is illustrated as a heatmap (Figure 4B) in which each column represents data from a single day, and each row represents an individual ISG. This representation highlights the similarity of ISG expression changes in the different models, showing that ISG expression appears to peak at day 5 PI in both NHPs and ferrets. This heatmap also highlights that the responses have unique aspects, with NHPs showing much more pronounced accumulation of several ISGs at day 7 and at necropsy. In particular, ISG 15 expression, shown to contribute to regulation of ISG protein expression levels [22], is markedly increased in NHPs when compared with ferrets. Conversely, a few genes showed greater upregulation in ferrets including indolamine 2,3-dioxygenase (ID01), responsible for regulatory T-cell development and maturation [23], DExD/H-Box helicase 60 (DDX60), which plays a role in retinoic acid-inducible gene I (RIG-I), and melanoma differentiation-associated protein 5 (MDA5) signaling [24, 25], suggesting that there are minor species-specific differences in expression.
We also identified the ISGs that were upregulated at any time point without filtering genes with regard to temporal expression. This allowed determination of response conservation over time and not just from the time of activation. From this analysis, the strongest overlap of upregulated genes between the ferret and NHP occurred at day 5 PI, further suggesting a similar time course for ISG expression (Figure 4). Taken together, this suggests that the ISG response is an early response that shows very similar patterns of expression between the NHPs and ferrets (Figure 4).
Cytokine Gene Expression
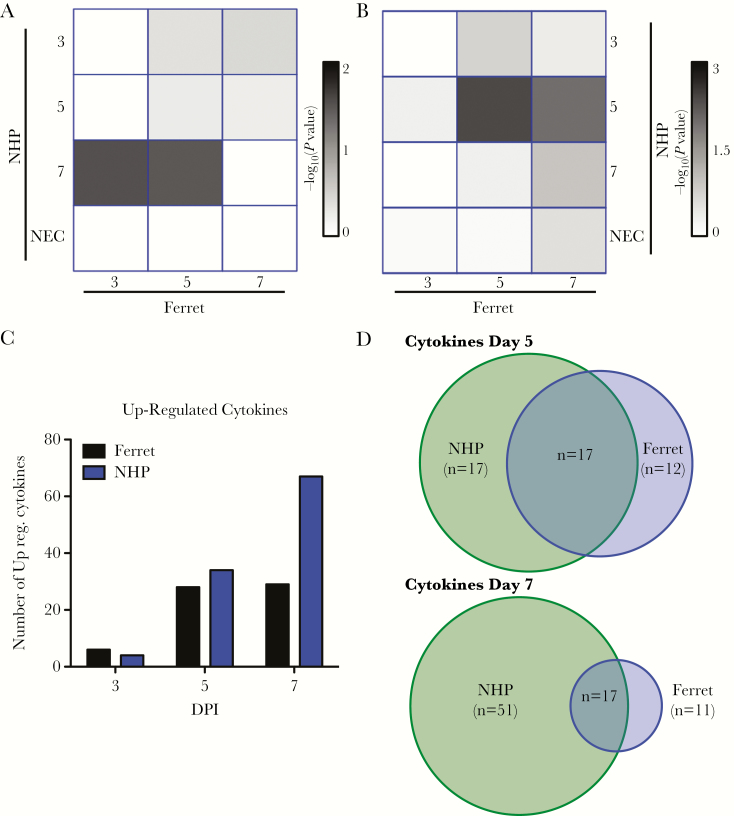
A similar analysis was performed to analyze changes in cytokine expression over the course of EBOV infection. When identifying genes uniquely upregulated at different times PI, the only significant overlap identified (P = 3 × 10⁻², Fisher’s exact test) was between day 3 ferret samples and day 7 NHP samples, suggesting that cytokine mRNA accumulation has a more varied onset in the different animals compared with ISG induction (Figure 5A and B, Supplemental Data File 2). Independent of time of induction, a similar pattern of upregulation of cytokine mRNAs at day 5 PI is present for both ferrets and NHPs with a similar pattern of gene expression (Figure 5C, Supplementary Table). A subset of similarly regulated mRNAs is displayed as a heatmap in Supplemental Figure 2. At day 7 and terminal disease stages for the NHP, twice as many cytokines were found to be upregulated compared with the ferret (Figure 5C). This cytokine increase is consistent with increases previously observed in filovirus-infected NHPs [4, 5]. Despite some common cytokines being expressed, the late cytokine expression in ferrets does not appear to be as pronounced, further suggesting that the NHPs have a closer expression to humans than the ferrets at the late stages of disease (Figure 5C and D, Supplementary Figure 2).
Figure 5.
Comparison of cytokine expression in ferrets and nonhuman primate (NHPs): (A) conservation of uniquely upregulated interferon-stimulated genes (ISGs) between ferret (columns) and NHP (rows) over time. The colors (white to black) represent the significance of the ISGs expressed in both types of animals (P > 0 –log10 value) from a Fisher’s exact test. (B) Similar plot as in A shows generally upregulated genes common to both types of animals. (C) Heatmap of the conserved ISGs identified from overlap analysis. Red represents stronger upregulation, and blue is downregulation of ISG. Log2 fold changes compared with day 0 are shown. (D) Enumeration of number of cytokine genes expressed by NHPs, ferrets, or both at days 5 and 7. Abbreviations: DPI, days postinfection; NEC, necropsy.
Coagulation Marker Gene Expression
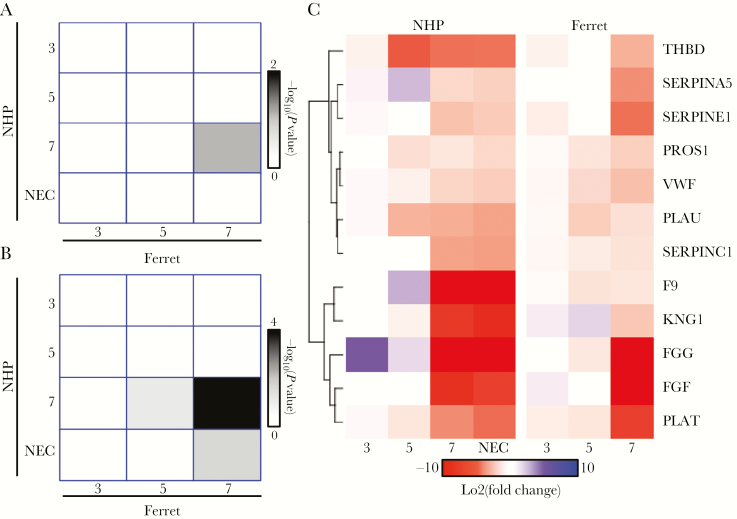
We also analyzed changes in mRNAs associated with coagulation. This set of genes has been shown to be strongly upregulated in fatal cases of human EHF, and their increased expression is consistent with the pathogenesis associated with EHF [16]. For uniquely expressed coagulation markers, at no time was there a significant overlap between the ferret and NHP. However, when we analyzed the generally upregulated genes without filtering as time progressed, we see that the end stages of disease (day 7 and necropsy) have the strongest overlap between the ferret and NHP (P < 10–4). Furthermore, many of the coagulation genes that overlapped with the ferret and NHP were similar to ones identified in human infections, including fibrinogen-associated transcripts (FGB, FGG) [16] (Figure 6). This suggests that all 3 species (humans, NHPs, and ferrets) experience a large increase in coagulation marker genes at the terminal stages (NHP and ferret) or in fatal cases of human infection (Figure 6 and Supplemental Material) [16]. This is consistent with clinical pathology observed in the ferret and NHP and with symptoms associated with human EHF.
Figure 6.
Comparison of coagulation expression in ferret and and nonhuman primate (NHP): (A) conservation of uniquely upregulated coagulation markers between ferrets (columns) and NHPs (rows) over the various days. The colors represent the –log10 (P value) from a Fisher’s exact test to determine whether the overlap at a given day is significant. (B) Similar plot as in A but for generally upregulated genes. (C) Heatmap of the conserved coagulation markers identified from overlap analysis. Red represents stronger upregulation, and blue is downregulation. Fold changes compared with day 0 are shown. Abbreviation: NEC, necropsy.
Digital Comparison of Immune Cell Types
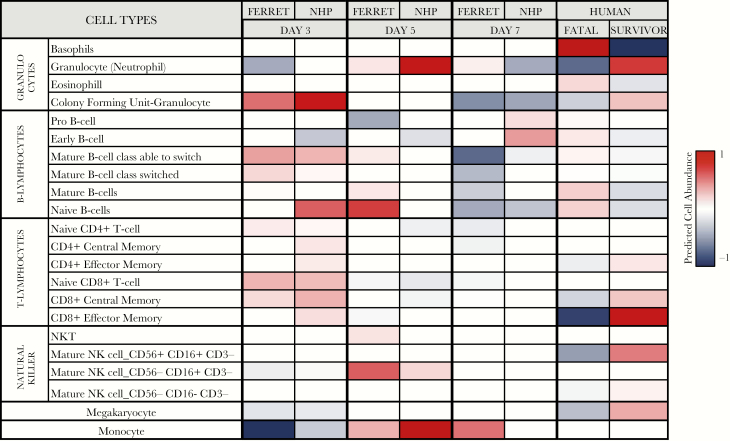
Changes observed in mRNA abundance may have been due to shifting gene regulation in the affected cells’ populations, to changing proportions of specific immune cell types, or to both. We used digital cell quantification to identify which cell types may have been differentially abundant across species and time [26, 27]. (Figure 7) Both ferrets and NHPs had a marked increase in transcript signatures indicative of neutrophilia on day 5 PI, which corresponded well with hematology values. These signatures diminished significantly at day 7 and may be a result of wide variation in neutrophil maturity because the actual cell counts remained high at terminal collection. It is interesting to note that human fatal cases also had comparatively lower transcript levels for neutrophils but significantly higher levels of basophil and eosinophil transcripts, whereas both ferret and NHP transcript signatures for these cell types were diminished.
Figure 7.
Digital cell quantitation using immquant: predicted cell quantities based on transcriptome signatures are represented by increased (red) or decreased (blue) color values. Abbreviations: NHP, nonhuman primate; NK, natural killer.
Cell type signatures for both B and T lymphocytes slightly increased at day 3 in ferrets and NHPs but then declined on subsequent sampling days in parallel with total lymphocyte cell numbers. A marked increase in natural killer cell (NK) signatures was observed by day 5 but subsided at terminal time points. Fatal human samples also had a depressed NK-specific cell type signature, whereas survivors had marked increases in NK-specific transcripts. Megakaryocyte cell signatures were only slightly depressed at day 3 and then remained largely unchanged through the remainder of the disease course, suggesting that one potential reason for observed thrombocytopenia may have been tied to the lack of megakaryocyte activation, function, or proliferation. Lower megakaryocyte transcripts were also observed in fatal human cases, whereas the inverse was true for survivors. Increases in both ferret and NHP cell-specific transcripts for monocytes were observed at day 5, which were followed by an approximate doubling in percentage of circulating monocytes in ferrets at day 7; however, no increases in absolute cell counts for NHPs were observed at day 7 at necropsy samples, suggesting that the increases may be attributed to activation rather than proliferation.
DISCUSSION
The recent introduction of the lethal domestic ferret model of ebolavirus infection offers a new opportunity to understand their pathogenesis and develop medical countermeasures while easing the strain on precious NHP resources; however, the severe lack of reagents to understand host responses in the ferret presents a challenge in fully characterizing the response to ebolavirus infection, and thus the utility of this model is questioned.
Transcriptomic sequencing of longitudinal blood samples taken from ferrets and NHPs infected with EBOV have many similarities. The most striking are the marked activation of several important proinflammatory signaling pathways at day 5 through terminal time points. Many proinflammatory responses have already been demonstrated to be important in humans, including the following: interferon activation, Toll-like receptor signaling, interleukin (IL)-6 and IL-1 responses, and coagulation cascades [7] (Figures 3–5). When compared with transcriptomic datasets taken from human acute-fatal or acute-survivor samples, a similar global signature is observed on at days 5 and 7 in ferrets and NHPs, suggesting that the ferret model accurately reflects the host response at the acute phase of EHF.
Although the global transcriptomic signatures are largely similar, there are some differences in gene expression of some cytokines known to be important in acute viral infections and sepsis; however, the cause for these differences remains unclear. Shifts in states of activation or prevalence of select cell populations, such as monocytes, may account for these differences because there are marked increases in these cell types in ferret whole blood samples, whereas only modest changes are observed in NHPs. In recent studies, in NHPs infected with EBOV, monocytes have been implicated in contributing to disease progression in significant ways by not only changing the genetic program leading to inflammation, coagulation, and vascular failure in NHPs infected with EBOV, but also by downregulating genes important for antigen presentation and regulation of immunity, which may contribute to subversion of adaptive immunity development [6]. Accordingly, a reduction in the number of CD16+ monocytes has been associated with fatal human cases, supporting differing roles of subpopulations of monocytes in the context of infection across host species [28]. Future work dissecting the role of monocytes and their cellular derivatives during EBOV infection of the ferret may help to shed some light on the role of these important cell populations.
CONCLUSIONS
Although this work has led to many intriguing insights, it is not without potential confounders. Although the number of experimental subjects is disproportionate between ferrets and NHPs, we have made every attempt to account for reliability of data by inclusion of quality control analysis to assure variability was within acceptable criteria. The route of challenge was also different in ferrets and in rhesus macaques; however, recent evidence in cynomolgous macaques suggest that route of challenge has little impact on the resulting transcriptomic signatures in NHPs that succumb to infection by either mucosal or intramuscular routes [8]. We also note that 2 different isolates were used for challenges of ferrets (Makona-C07) and NHPs (Makona-C05); nonetheless, infection with either isolate resulted in fatal disease in either model, thus the impacts on our findings are likely negligible. Taken together, these data imply that the ferret models have the potential utility for dissecting key events in the pathogenesis of several ebolaviruses and may be useful for evaluating candidate medical interventions before assessment in NHPs [3].
Supplementary Data
Supplementary materials are available at The Journal of Infectious Diseases online. Consisting of data provided by the authors to benefit the reader, the posted materials are not copyedited and are the sole responsibility of the authors, so questions or comments should be addressed to the corresponding author.
Notes
Presented in part: 9th International Filovirus Symposium, September 13–16, 2017, Marburg, Germany.
Acknowledgments. We thank Krystle Agans, Daniel Deer, Karla Fenton, Joan Geisbert, and Chad Mire for expert assistance with the biosafety level 4 animal studies; Dr. Kimberly Schuenke for administrative assistance; and Jessica Graber and the University of Texas Medical Branch Animal Resource Center for veterinary technical and husbandry support. We also thank Laura Bollinger (Integrated Research Facility) for critically editing the manuscript.
Financial support. This work was supported by the Department of Microbiology and Immunology, University of Texas Medical Branch at Galveston, Galveston, TX (to T. W. G.). E. S. is supported by a National Science Foundation Graduate Research Fellowship under grant no. DGE-1247312. This work was also funded by National Institute of Allergy and Infectious Disease grant RO1AI1096159 (to J. H. C.). This work was partially funded by the Division of Intramural Research of the National Institute of Allergy and Infectious Diseases (NIAID), Division of Clinical Research, Integrated Research Facility and Battelle Memorial Institute’s prime contract with NIAID (contract no. HHSN272200700016I). The nonhuman primates were provided by the Division of Microbiology and Infectious Diseases at NIAID.
Potential conflicts of interest. All authors: No reported conflicts of interest. All authors have submitted the ICMJE Form for Disclosure of Potential Conflicts of Interest.
References
- 1.Feldmann F, Sanchez A, Geisbert JB. Filoviridae: Marburg and Ebola viruses. In: Knipe DM, Howley PM, eds. Fields virology. 6th ed. Vol 2. Philadelphia, PA: Wolters Kluwer, Lippincott Williams & Wilkins, 2013:923–56. [Google Scholar]
- 2. Feldmann H, Geisbert TW. Ebola haemorrhagic fever. Lancet 2011; 377:849–62. [DOI] [PMC free article] [PubMed] [Google Scholar]
- 3. Geisbert TW, Strong JE, Feldmann H. Considerations in the use of nonhuman primate models of Ebola virus and Marburg virus infection. J Infect Dis 2015; 212(Suppl 2):S91–7. [DOI] [PMC free article] [PubMed] [Google Scholar]
- 4. Rubins KH, Hensley LE, Wahl-Jensen V, et al. The temporal program of peripheral blood gene expression in the response of nonhuman primates to Ebola hemorrhagic fever. Genome Biol 2007; 8:R174. [DOI] [PMC free article] [PubMed] [Google Scholar]
- 5. Versteeg K, Menicucci AR, Woolsey C, et al. Infection with the Makona variant results in a delayed and distinct host immune response compared to previous Ebola virus variants. Sci Rep 2017; 7:9730. [DOI] [PMC free article] [PubMed] [Google Scholar]
- 6. Menicucci AR, Versteeg K, Woolsey C, et al. Transcriptome analysis of circulating immune cell subsets highlight the role of monocytes in Zaire Ebola virus Makona pathogenesis. Front Immunol 2017; 8:1372. [DOI] [PMC free article] [PubMed] [Google Scholar]
- 7. Speranza E, Connor JH. Host transcriptional response to Ebola virus infection. Vaccines 2017; 5: doi: 10.3390/vaccines5030030. [DOI] [PMC free article] [PubMed] [Google Scholar]
- 8. Speranza E, Altamura LA, Kulcsar K, et al. Comparison of transcriptomic platforms for analysis of whole blood from Ebola-infected cynomolgus macaques. Sci Rep 2017; 7:14756. [DOI] [PMC free article] [PubMed] [Google Scholar]
- 9. Banadyga L, Dolan MA, Ebihara H. Rodent-adapted filoviruses and the molecular basis of pathogenesis. J Mol Biol 2016; 428:3449–66. [DOI] [PMC free article] [PubMed] [Google Scholar]
- 10. Nakayama E, Saijo M. Animal models for Ebola and Marburg virus infections. Front Microbiol 2013; 4:267. [DOI] [PMC free article] [PubMed] [Google Scholar]
- 11. Cross RW, Mire CE, Borisevich V, Geisbert JB, Fenton KA, Geisbert TW. The domestic ferret (Mustela putorius furo) as a lethal infection model for 3 species of ebolavirus. J Infect Dis 2016; 214:565–9. [DOI] [PMC free article] [PubMed] [Google Scholar]
- 12. Kroeker A, He S, de La Vega MA, Wong G, Embury-Hyatt C, Qiu X. Characterization of Sudan ebolavirus infection in ferrets. Oncotarget 2017; 8:46262–72. [DOI] [PMC free article] [PubMed] [Google Scholar]
- 13. Kozak R, He S, Kroeker A, et al. Ferrets infected with Bundibugyo virus or Ebola virus recapitulate important aspects of human filovirus disease. J Virol 2016; 90:9209–23. [DOI] [PMC free article] [PubMed] [Google Scholar]
- 14. Cross RW, Mire CE, Agans KN, Borisevich V, Fenton KA, Geisbert TW. Marburg and Ravn viruses fail to cause disease in the domestic ferret (Mustela putorius furo) J Infect Dis 2018; doi: 10.1093/infdis/jiy268. [DOI] [PMC free article] [PubMed] [Google Scholar]
- 15. Enkirch T, von Messling V. Ferret models of viral pathogenesis. Virology 2015; 479–480:259–70. [DOI] [PMC free article] [PubMed] [Google Scholar]
- 16. Liu X, Speranza E, Muñoz-Fontela C, et al. Transcriptomic signatures differentiate survival from fatal outcomes in humans infected with Ebola virus. Genome Biol 2017; 18:4. [DOI] [PMC free article] [PubMed] [Google Scholar]
- 17. Connor JH, Yen J, Caballero IS, et al. Transcriptional profiling of the immune response to Marburg virus infection. J Virol 2015; 89:9865–74. [DOI] [PMC free article] [PubMed] [Google Scholar]
- 18. Peng X, Alföldi J, Gori K, et al. The draft genome sequence of the ferret (Mustela putorius furo) facilitates study of human respiratory disease. Nat Biotechnol 2014; 32:1250–5. [DOI] [PMC free article] [PubMed] [Google Scholar]
- 19. Luke T, Bennett RS, Gerhardt DM, et al. Fully human immunoglobulin G from transchromosomic bovines treats primates infected with Ebola virus Makona isolate. J Infect Dis 2018; doi: 10.1093/infdis/jiy377. [DOI] [PMC free article] [PubMed] [Google Scholar]
- 20. Fisher-Hoch SP, Platt GS, Neild GH, et al. Pathophysiology of shock and hemorrhage in a fulminating viral infection (Ebola). J Infect Dis 1985; 152:887–94. [DOI] [PubMed] [Google Scholar]
- 21. Wong G, Qiu X, de La Vega MA, et al. Pathogenicity comparison between the Kikwit and Makona Ebola virus variants in rhesus macaques. J Infect Dis 2016; 214:281–9. [DOI] [PMC free article] [PubMed] [Google Scholar]
- 22. Villarroya-Beltri C, Guerra S, Sánchez-Madrid F. ISGylation—a key to lock the cell gates for preventing the spread of threats. J Cell Sci 2017; 130:2961–9. [DOI] [PubMed] [Google Scholar]
- 23. Wang J, Yu L, Jiang C, et al. Cerebral ischemia increases bone marrow CD4+CD25+FoxP3+ regulatory T cells in mice via signals from sympathetic nervous system. Brain Behav Immun 2015; 43:172–83. [DOI] [PMC free article] [PubMed] [Google Scholar]
- 24. Miyashita M, Oshiumi H, Matsumoto M, Seya T. DDX60, a DEXD/H box helicase, is a novel antiviral factor promoting RIG-I-like receptor-mediated signaling. Mol Cell Biol 2011; 31:3802–19. [DOI] [PMC free article] [PubMed] [Google Scholar]
- 25. Oshiumi H, Miyashita M, Okamoto M, et al. DDX60 Is involved in RIG-I-dependent and independent antiviral responses, and its function is attenuated by virus-induced EGFR activation. Cell Rep 2015; 11:1193–207. [DOI] [PubMed] [Google Scholar]
- 26. Altboum Z, Steuerman Y, David E, et al. Digital cell quantification identifies global immune cell dynamics during influenza infection. Mol Syst Biol 2014; 10:720. [DOI] [PMC free article] [PubMed] [Google Scholar]
- 27. Frishberg A, Brodt A, Steuerman Y, Gat-Viks I. ImmQuant: a user-friendly tool for inferring immune cell-type composition from gene-expression data. Bioinformatics 2016; 32:3842–3. [DOI] [PMC free article] [PubMed] [Google Scholar]
- 28. Lüdtke A, Ruibal P, Becker-Ziaja B, et al. Ebola virus disease is characterized by poor activation and reduced levels of circulating CD16+ monocytes. J Infect Dis 2016; 214:275–80. [DOI] [PubMed] [Google Scholar]
Associated Data
This section collects any data citations, data availability statements, or supplementary materials included in this article.


