

Abstract
Background:
National administrative healthcare data may be used as a case-finding method for prevalence studies of chronic disease in the United States, but the completeness of ascertainment likely varies depending on the disease under study.
Methods:
We used 3 case-finding sources (Medicare, Medicaid, and Veterans Administration data) to estimate the prevalence of amyotrophic lateral sclerosis (ALS) in the United States for 2002–2004, and applied the capture-recapture methodology to estimate the degree of under-ascertainment when relying solely on these sources for case identification.
Results:
Case-finding completeness was 76% overall and did not vary by race, but was lower for males (77%) than for females (88%), and lower for patients under age 65 (66%) than patients over age 65 (79%). The uncorrected ALS prevalence ratio was 2.8/100,000 in 2002, 3.3/100,000 in 2003, and 3.7/100,000 in 2004. After correcting for under-ascertainment, the annual prevalence increased by approximately 1 per 100,000 to 3.7/100,000 in 2002 (95% CI 3.66–3.80), 4.4/100,000 in 2003 (95% CI 4.34–4.50), and 4.8/100,000 in 2004 (95% CI 4.76–4.91).
Conclusions:
Federal healthcare claims databases ascertained are a very efficient method for identifying the majority of ALS-prevalent cases in the National ALS Registry, and may be enhanced by having patients self-register through the registry web portal.
Keywords: Amyotrophic lateral sclerosis, Motor neuron disease, Prevalence, Prevalence ratio, Capture-recapture, Log-linear models, Administrative data
Introduction
The number of people with amyotrophic lateral sclerosis (ALS) in the United States is difficult to estimate because, until recently, there was no nationwide disease registry or surveillance system for ALS. Prior estimates of national ALS prevalence were obtained by extrapolating findings from prevalence studies done in smaller geographic regions to the nation as a whole. The National ALS Registry was mandated by the U.S. Congress in 2008 for the purpose of estimating the incidence and prevalence of ALS, characterizing the demographics of those living with the disease, and examining the risk factors for ALS [1]. In 2009, the federal Agency for Toxic Substances and Disease Registry (ATSDR) began work to establish the National ALS Registry, and sought the best methods for identifying patients with ALS. Through early pilot efforts, the National ALS Registry developed a novel case-finding method to identify patients with ALS using the combination of several national healthcare administrative databases.
We sought to estimate the completeness of these databases for estimating the prevalence of ALS in the United States during the years 2002–2004, prior to the establishment of the National ALS Registry [2–4]. Our primary objectives were to (i) examine the relative effectiveness of this case-finding method for identifying persons with ALS; (ii) estimate the prevalence of ALS in the United States by relying solely on these healthcare administrative data sources; and (iii) to obtain revised estimates of ALS prevalence for the years 2002–2004 after correcting for under ascertainment using capture-recapture methods.
Methods
The National ALS Registry is the first national registry to use existing administrative data as the primary method to identify patients to estimate the prevalence of ALS in the United States. For the years 2002–2004, we sought to use several national administrative databases to estimate ALS prevalence: Medicare (parts A and B), Medicaid, Veterans Health Administration (VHA), and Veterans Benefit Administration (VBA). Although we obtained data from all of these sources for the years 2001–2005, we restricted our estimates of annual prevalence to the years 2002 through 2004 because several of the case finding criteria (described below) required 2 years of data in order to meet the case definition. The administrative data files include computerized records documenting out-patient visits, inpatient hospitalizations, clinical procedures, laboratory results, and medication prescriptions. Potential ALS cases were identified by actively searching the databases for International Classification of Diseases, 9th Revision (ICD-9), Clinical Modification codes of 335.2X (motor neuron diseases [MND], ALS (ICD 335.20), progressive muscular atrophy (ICD-9 code 335.21), progressive bulbar palsy (PBP; ICD-9 code 335.22), pseudobulbar palsy (PBP; ICD-9 code 335.23), primary lateral sclerosis (ICD-9 code 335.24), and other adult-onset MND (other MND; ICD-9 code 335.29). We also obtained information from pharmacy data (available in the Medicaid and VA sources) indicating whether potential cases had been prescribed riluzole (brand name Rilutek), the only FDA-approved medication indicated for ALS.
The ALS case identification algorithm was developed from work done through several pilot projects [5]. Patients were categorized into 3 distinct groups: definite ALS, possible ALS, and not ALS. The algorithm was developed by using several different criteria in an iterative process to determine the best model for categorizing patients. It was possible for a given patient to satisfy more than one criterion to be classified as definite ALS (online suppl. Appendix Table A1; for all online suppl. material, see www.karger.com/doi/10.1159/000488798). Six criteria were used for classifying patients as definite ALS, and all patients satisfied at least one of the 6 criteria: (1) having an ICD-9 code of ALS in one or more years from the same case-finding source and/or prescription for riluzole; (2) an ALS code in 2 or more years with a neurologist visit in the same source; (3) age <65, with one or more ALS codes in Medicare and ≥1 neurology visits; (4) one or more ALS codes in ≥1 years with at least one neurologist visit in one source, combined with 1 or more ALS codes in another source; (5) having an ALS code in 3 or more sources; and (6) having ALS in 1 year and 5 or more neurologist visits. The validated algorithm has been shown to have high sensitivity (87%) and specificity (85%) [5].
Deduplication of subjects contained in more than one national administrative data source was carried out at ATSDR based on identifiers such as name, date of birth, sex, and geographic location. Each subject had a study ID that was assigned at ATSDR, where the unique link with the subject’s protected health information was securely stored. An analytic data set containing de-identified information was prepared and transferred to the Stanford University and Palo Alto VA study team, and included information on demographic characteristics and case definition criteria.
Capture-recapture is a statistical method that examines the overlap in identification of cases from different data sources and uses this overlap to estimate disease prevalence [6, 7]. We carried out statistical analyses using SAS™ software. We conducted descriptive analyses of the demographic and clinical characteristics of the ALS cases identified by each of the sources. We estimated the completeness of case ascertainment for each of the 4 ALS registry sources, pairwise and in various combinations. Registry undercounts were estimated using each pairwise combination of the sources, making the assumption that the pair of sources was independent in their likelihood of case identification; and 95% CIs for the 2-source solution were calculated.
We characterized the degree of “dependence” between each pairwise combination of sources by multiplying the proportion of cases identified by each source to estimate the expected proportion that would be expected if the 2 sources were operating independently, and compared “expected proportion under independence” to the observed proportion of cases identified by both sources. Positive dependency occurs when the probability of being “captured” or identified by one source is positively associated with the probability of being identified by the other source. Negative dependency occurs when the probability of being identified by one source is inversely associated with the probability of being identified by the other source. When 2 sources are positively dependent, the probability of being captured by the second source is more likely, given the case was captured by the first source. This can occur in situations such as we observed in our data, where there is a strong positive dependence between VHA and VBA. The probability of being identified as a case in the VHA is highly likely if the case was also identified through VBA because the majority of VBA patients have been seen in the VHA for disability evaluation (data not shown). Given this very strong positive dependence between the VA sources, we combined VHA and VBA into a single “VA” source for all capture-recapture analyses.
Because it is unlikely that any 2 sources provide a completely independent capture of cases, we carried out log-linear modeling [8] using the SAS™ GENMOD procedure to calculate capture-recapture estimates derived by various combinations of the 3 sources (Medicare, Medicaid, VA). Our base model included a regression term for each source to represent its main effect (model 1), and we modeled source dependence between any 2 sources by singly adding the corresponding 2-source interaction term to the model with the main effects (models 2–4). Then we fitted models with main effects and two of the three 2-source interactions terms (models 5–7), and lastly estimated the number of people with ALS who were not identified by any of the 3 sources by fitting a fully saturated model including all 2-source and 3-source interactions (model 8). The significance of each interaction term was assessed using the likelihood ratio statistic (G2). Goodness of fit was assessed by examining the deviance of alternative models, and the best model was selected by choosing the one with the smallest Akaike Information Criterion. When 2 or more models had a similar degree of fit, we chose the one with the fewest interaction terms (i.e., most parsimonious) as the final model. CIs for estimated number of cases were computed using the profile likelihood method [9].
The strictest application of capture-recapture assumes a homogenous study population where all members have the same probability of being included in each source. In practice, however, this is an untenable assumption because the degree of ascertainment by the various sources can vary according to factors such as sex, age, and race. We examined how the completeness of ascertainment varied according to sex, age group, race, and year of study. We fit models that allow for dependencies among the sources and for effects of sex, age, and race on the probability of an individual being identified from a source.
We calculated ascertainment-corrected point prevalence estimates of ALS for the years 2002–2004, using capture-recapture methods to correct for under ascertainment in each stratum defined on the basis of age, sex, and/or race. We used the parameter estimates from capture-recapture log-linear models to estimate the total number of ALS cases in each population subgroup (defined on the basis of age, sex, and race-ethnicity), and interpolated estimates between the 2000 and 2010 U.S. census data to obtain population denominators for 2002–2004 for the calculation of point prevalence estimates, using as the denominator the number of people over age 18 residing in the U.S. during each study year.
Results
The demographic characteristics of ALS cases identified in the sources in 2003 are presented in Table 1. We present the findings for the middle year (2003) because there were no material differences among the 3 years. Not surprisingly, males comprised 95% of cases identified through the VA but only 58.0% of the non-VA cases (data not shown). In the total group, the majority of ALS cases were white (85%), with 13% non-White and 2% unknown. A higher percentage of ALS cases identified through Medicare were white (88%) than were cases identified through Medicaid (74%) or the VA (80%). In the Medicare and VA sources, the majority of cases were in the age group 65 and above (56 and 51% respectively), whereas in the Medicaid source, only 36.2% of cases were age 65 and above.
Table 1.
Demographic characteristics of ALS cases according to case ascertainment source, ALS prevalent cases, 2003
| Characteristic | Medicare | Medicaid | Veterans administration (VHA, VBA) | Total all sources | ||||
|---|---|---|---|---|---|---|---|---|
| number | % | number | % | number | % | number | % | |
| Number of cases with records in source | 8,929 | 2,230 | 1,406 | 9,705 | ||||
| Gender, male (number, % of source) | 5,189 | 58.1 | 1,188 | 53.3 | 1,336 | 95.0 | 5,797 | 59.7 |
| Age, years | ||||||||
| Median/mean age | 67.0/64.5 | 58.0/58.1 | 66.0/64.3 | 66.0/63.8 | ||||
| <65 | 3,910 | 43.8 | 1,397 | 62.6 | 619 | 44.0 | 4,529 | 46.7 |
| >65 | 5,002 | 56.0 | 807 | 36.2 | 721 | 51.3 | 5,171 | 53.3 |
| Unknown | 17 | 0.2 | 26 | 1.2 | 66 | 4.7 | 5 | 0.1 |
| Ethnicity (number, % of source) | ||||||||
| White | 7,840 | 87.8 | 1,638 | 73.5 | 1,123 | 79.9 | 8,268 | 85.2 |
| Non-white | 1,076 | 12.1 | 547 | 24.5 | 128 | 9.1 | 1,235 | 12.7 |
| Not available | 13 | 0.1 | 45 | 2.0 | 155 | 11.0 | 202 | 2.1 |
ALS, amyotrophic lateral sclerosis; VHA, veterans health administration; VBA, veterans benefit administration.
The number of ALS cases identified by each source by itself, as well as by any 2- or 3-source combinations of sources is summarized in Figure 1. The highest yield source was Medicare (92% of all cases), followed by Medicaid (23%) and VA (15%). The majority of cases (71.6%) were identified by only one source. Medicare was the most effective means of identifying cases, and if it had been used as the single source, only a small percentage of ALS cases would have been missed who were identified solely through Medicaid (3.3%) or the VA (4.3%).
Fig. 1.
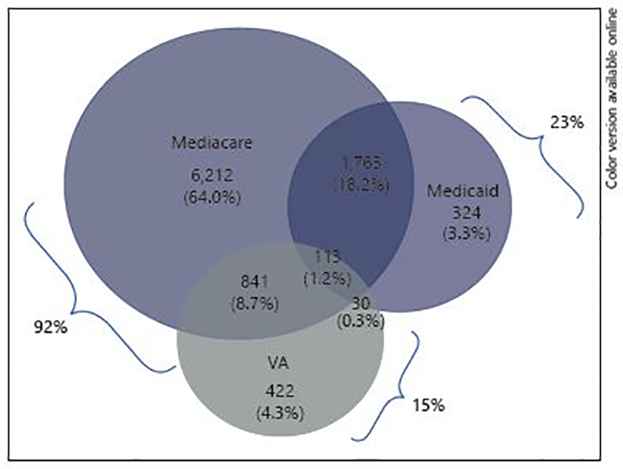
Case ascertainment overlap, prevalent cases, 2003.
When 2 sources are negatively dependent, the probability of being captured by one source is less likely, given the case was captured by the second source. Examination of the bottom row of Table 2 indicates that Medicaid and VA are strongly negatively dependent because the observed probability of being identified by both Medicaid and VA was 0.041, yet the expected probability of being identified by both sources assuming that they operate independently was 0.257. This strong difference between the observed proportion and the expected probability indicates that cases identified by Medicaid are not likely to be identified by VA, and vice versa.
Table 2.
Examination of 2-source dependencies, ALS prevalent cases, 2003
| Two source combination | Number in category | Probability of being identified by first source | Probability of being identified by second source | Expected probability of being identified by both sources (assuming independence) | Observed Proportion identified by probability both sources | Observed minus expected probability of being in both sources | Direction of dependence |
|---|---|---|---|---|---|---|---|
| Medicare and Medicaid | 9,283 | 0.962 | 0.240 | 0.231 | 0.202 | −0.029 | Slightly negative |
| Medicare and VA | 9,381 | 0.952 | 0.15 | 0.143 | 0.102 | −0.041 | Slightly negative |
| Medicaid and VA | 3,493 | 0.638 | 0.403 | 0.257 | 0.041 | −0.216 | Strongly negative |
ALS, amyotrophic lateral sclerosis.
We carried out log-linear modeling to calculate capture-recapture estimates derived by combinations of the 3 sources (Medicare, Medicaid, VA) for the year 2003 (Table 3). In Table 3, n is the estimated unobserved cell using log-linear modeling, that is, the estimated number of ALS cases not identified by any of the 3 sources. “N” is the estimated total population using log-linear modeling (i.e., the total number of cases actually identified by the 3 sources plus the estimated missing cell n). The best fitting model was model 6 (i.e., the one with the smallest Akaike Information Criterion), which contained terms for the 3 main effects and two of the 2-source interaction terms (Medicare and Medicaid, Medicaid and VA). Very similar results were obtained with log-linear models for the years 2002 and 2004 (online suppl. Tables A3a, A3b in the Appendix).
Table 3.
Three-source capture-recapture estimates using log-linear modeling, ALS prevalent cases, 2003
| Model | df | AIC | Estimated, n | 95% CI | Estimated, N | 95% CI | |
|---|---|---|---|---|---|---|---|
| Main effects only | |||||||
| 1 | Medicare, Medicaid, VA | 3 | 303.9 | 1,899 | 1,749−2,063 | 11,604 | 11,454−11,768 |
| Main effects with 2-source interactions one-at-a-time | |||||||
| 2 | Medicare, Medicaid, VA, Medicare*Medicaid | 2 | 128.5 | 3,559 | 3,169−3,997 | 13,264 | 12,874−13,702 |
| 3 | Medicare, Medicaid, VA, Medicare*VA | 2 | 195.8 | 1,270.7 | 1,127−1,433 | 10,976 | 10,832−11,138 |
| 4 | Medicare, Medicaid, VA, Medicaid*VA | 2 | 207.7 | 1,774 | 1,632−1929 | 11,479 | 11,337−11,634 |
| Main effects with 2-source interactions pairs | |||||||
| 5 | Medicare, Medicaid, VA, Medicare*Medicaid, Medicare*VA | 1 | 128.6 | 4,558 | 3,098−6,705 | 14,263 | 12,803−16,410 |
| 6 | Medicare, Medicaid, VA, Medicare*Medicaid, Medicaid*VA | 1 | 70.5 | 3,117 | 2,766−3,513 | 12,822 | 12,471−13,218 |
| 7 | Medicare, Medicaid, VA, Medicare*VA, Medicaid*VA Saturated model | 1 | 77.5 | 1,142 | 1,011−1,289 | 10,847 | 10,716−10,994 |
| 8 | Medicare, Medicaid, VA, Medicare*Medicaid, Medicare*VA, Medicaid*VA | 0 | 0 | 2,158 | 1,395−3,338 | 11,863 | 11,099−13,043 |
n is the estimated unobserved cell using log-linear modeling, that is, the estimated number not identified by any of the 3 sources.
N is the estimated total population using log-linear modeling, that is, the total number of cases actually identified by the 3 sources plus the estimated missing cell n).
AIC, Akaike Information Criterion; ALS, amyotrophic lateral sclerosis.
The performance of sources for case-finding varied according to race, sex, and age (Fig. 2). Examination of results by sex indicated that the estimate of case undercount was larger for male patients (23%) than for female patients (12%), and also larger for patients under age 65 (34%) than patients age 65 and older (16%). Examination of results by race indicated that the percentage of cases missing after using 3 sources was similar among whites (9%) and non-whites (10%).
Fig. 2.

Number of ALS cases in 2003 by sex, age, and race, corrected for case undercount using the capture-recapture method. ALS, amyotrophic lateral sclerosis.
Overall, for the years 2002 through 2004, the number of ALS cases observed across sources increased in a linear fashion, from 8,005 in 2002 to 9,705 in 2003 to 10,732 in 2004 (Fig. 3). For 2003, the best-fitting log-linear model (model 6) estimated that the missing cell count (i.e., the count of those not identified by any of the 3 sources) was 3,117, indicating that 24% of all ALS cases (3,117 of 12,822) were missed by all 3 methods. When added to the observed count of ALS cases (n = 9,705), this resulted in a capture-recapture corrected ALS case count of 12,822. This corrected estimate indicates that 24% of the true number of ALS cases were missed by the 3 sources (Medicare, Medicaid, VA; Fig. 3). Estimates of the percentage of missing cases for 2002 and 2004 data were similar (25 and 24% of cases missed respectively).
Fig. 3.

Number of ALS cases, 2002–2004, corrected for case ascertainment using the capture-recapture method. ALS, amyotrophic lateral sclerosis.
The uncorrected ALS prevalence ratios for 2002, 2003, and 2004 were 2.78 per 100,000 (95% CI 2.72–2.84), 3.34/100,000 (95% CI 3.28–3.41), and 3.67/100,000 (95% CI 3.60–3.73), respectively (Fig. 4). When the prevalence estimates were corrected using the capture-recapture method, they increased by nearly 1/100,000 to 3.73 per 100,000 in 2002 (95% CI 3.66–3.80), 4.42/100,000 (95% CI 4.34–4.50) in 2003, and 4.83/100,000 (95% CI 4.76–4.91) in 2004. When the prevalence ratios were corrected for the undercounts, the male to female ratio was approximately 1.6 (1.57 in 2002, 1.77 in 2003, and 1.61 in 2004).
Fig. 4.

Annual ALS prevalence estimates, 2002–2004, corrected for case undercount using the capture-recapture method. ALS, amyotrophic lateral sclerosis.
Discussion
To our knowledge, no other previous study has attempted to estimate the prevalence of a neurologic disease in the United States relying solely on a combination of administrative healthcare data sources. We found that a large number of ALS cases can be identified by combining several national administrative claims databases. The prevalence estimates resulting from the combination of the 3 sources, when corrected for under-ascertainment using capture-recapture methods, resulted in ALS period prevalence estimates ranging from 3.7 to 4.8 per 100,000. These estimates are strikingly similar to estimates for the years 2009–2011 obtained by National ALS Registry scientists when using extensive case-finding methods in several state and metropolitan regions in the United States, which reported crude point and annual period prevalence estimates ranging from 3.8 to 4.4 per 100,000 [10–13]. Prevalence estimates corrected using capture-recapture indicate that ALS increased steadily, beginning with 3.7 per 100,000 in 2002, 4.4 per 100,000 in 2003, and 4.8 per 100,000 in 2004. These estimates are similar to ALS prevalence estimates reported for the first years of the National ALS Registry, which increased from 4.3 per 100,000 persons during 2010–2011 [2] to 4.7 cases per 100,000 U.S. population for 2012 and 5.0 per 100,000 for 2013 [4]. Moreover, with our application of capture-recapture methods we estimate that only 24–25% of ALS cases in the U.S. are missed by relying on these large national healthcare databases. Together our findings support the conclusion that reliance only on federal databases for ascertaining ALS cases may ascertain more than 75% of ALS cases in the United States.
Two recent reviews have illustrated the value of population-based prospective registries of neurological disease for descriptive and analytic epidemiologic studies of ALS [14] and of neurological conditions in general [15]. Two key features of ideal registries are the use of multiple sources to maximize ALS case ascertainment and the use of El Escorial diagnostic criteria [16] applied by expert neurologists. The completeness of case ascertainment from a large country like the United States (292 million in 2004) using retrospective national administrative healthcare data would be expected to be less optimal than estimates obtained from prospective studies conducted in smaller countries or in U.S counties where intensive or prospective case-finding is feasible. Therefore, not unexpectedly, the crude annual ALS prevalence estimates for our study (2.8–3.7 per 100,000 in 2002–2004) were lower than prevalence estimates from studies that used more intensive clinical case-finding methods. For example, a study from Ireland in 1996 reported a point prevalence of 4.7 per 100,000 (95% CI 4.0–5.5) [17] and a study in Jefferson County, Missouri in 2002 reported a point prevalence of 3.9 per 100,000 (95% CI 1.7–7.7) [18]. Our capture-recapture corrected estimates of 3.7–4.4 per 100,000 were closer to those estimates; however, we estimated a 1-year period prevalence rather than point prevalence, so our crude estimates would be expected to be larger on that basis alone.
Medicare was the single largest contributor to case-finding, identifying 92% of all identified cases and uniquely identifying 64% of cases not identified by any other case finding source. If Medicare had been used as a single source, only a small percentage of ALS cases would have been missed who were identified solely through Medicaid (3%) or the VA (4%). Medicare is the primary source of case ascertainment in the elderly because it is an entitlement that is available to all U.S. citizens aged 65 and over. Nevertheless, the estimate of proportion of cases missed in the age group 65 and above was estimated to be 16%, perhaps because Medicare data prior to 2006 do not contain medication data. The number of cases missed in this age group would be expected to be lower in later Medicare data (after 2006), with the addition of prescription data, which would allow the identification of ALS patients using the medication (riluzole).
Because Medicare is a broad entitlement program for older adults and people with a disability, it is not surprising that the probability of being identified by Medicare was largely independent of the probability of being identified by either Medicaid or the Veterans Affairs. In contrast, there was a strong negative dependency between Medicaid and the VA in that if a case was identified by one of these sources, it was less likely to be identified by the other. This finding is not surprising because Medicaid eligibility and VA copayments reflect financial need; patients who have satisfied the eligibility for one type of coverage might be less likely to seek the other source of coverage, especially because both Medicaid and VA offer prescription drug coverage.
Medicaid was a source of identification for 23% of cases; however, it was responsible for only 3% of uniquely identified cases, indicating that Medicaid as a case-finding method could be eliminated with very little consequence for completeness of case ascertainment. Moreover, Medicaid data are not usually available until 3–4 years after they are generated and may be affected by variable or incomplete reporting, making it infeasible to rely on Medicaid as a responsive case-finding source in an active registry.
In the years covered by this study, the average VA population size was 7 million patients; therefore, we would not expect VA to contribute a large proportion of cases. Nevertheless, a large proportion of men in the older age groups affected by ALS have served in the military at some point in their lives, and VA was the source of 15% of cases but responsible for only 4% of uniquely identified cases.
Additional insights into this case-finding methodology can be gained by examining how the completeness of case-finding varied by demographic subgroups. We examined how the completeness of ascertainment varied according to sex, age, and race, and found that there were important differences in the effectiveness of the sources. Case-finding completeness was lower for males (77%) than for females (88%), but did not differ by race. Case-finding completeness was lower for patients under age 65 (66%) than patients age 65 and over (79%). This is not surprising because Medicare would be expected to find much higher proportion of ALS cases age 65 and older given that Medicare coverage is an entitlement in that age group and the new benefit for those with ALS did not go into effect until August of 2003.
Although these databases do not cover the entire population of the United States, they represent a significant portion of the population most likely affected by ALS because Medicare covers individuals 65 years of age or older and disability benefits are available to all patients with ALS even before age 65. Both the Social Security Administration and the Veterans Administration have made ALS an automatic qualification for “presumptive disability” (Social Security Administration in 2003; VA in 2008). Once a patient with ALS obtains Social Security Disability Income, the 2-year waiting period for Medicare eligibility is waived. Thus, both Medicare and VA could be even more valuable sources for case ascertainment in recent years after these changes took effect. Our findings suggest that administrative healthcare databases are an excellent foundation for identifying ALS cases for the recently established National ALS Registry. Nevertheless, it is likely that individuals on the younger end of the age spectrum and who are employed may still be getting insurance through their employer and thus would be less likely to be identified through the 3 case-finding sources until they turn 65, stop working, and/or apply for Social Security Disability income. As a result, ascertaining cases through these databases might preferentially exclude ALS cases who are at the starting stages of their disease course or less disabled. In anticipation of this concern, the National ALS Registry has implemented methods, including volunteer web portal registration, that are expected to improve the completeness of ascertainment, especially in younger age groups that cannot yet be identified through the 3 entitlement programs Medicare, Medicaid, and VA. Our group is currently applying capture-recapture methods with later years of registry data (2011 and beyond) that include the web portal as a case-finding method. The Registry has also partnered with ALS advocacy groups such as the ALS Association, Muscular Dystrophy Association, Les Turner ALS Foundation, and others to increase Registry awareness with patients and caregivers.
Despite the strengths of the ALS Registry case-finding methods, it is important to recognize that any chronic disease surveillance system in the United States will not be able to capture all cases. Our application of capture-recapture methods indicates that approximately 24–25% of ALS cases in the United States are missed by relying solely on large national healthcare databases as a method of case identification. Patients missing from our initial ALS prevalence estimates are likely to be largely comprised of individuals who are still employed and are covered either by private insurance or by employer-provided insurance.
In December 2016, the U.S. Congress passed the 21st Century Cures Act (H.R. 34) [19], which mandated the creation of a nationwide surveillance system to monitor the incidence and prevalence of other neurological diseases [16]. Information provided by our analysis suggests that administrative healthcare data sources provide an excellent methodological foundation for estimating national ALS prevalence in a large country with a fragmented healthcare system, and may be valuable for tracking cases of other neurological diseases and estimating the extent of their prevalence.
Supplementary Material
Acknowledgments
We gratefully acknowledge the people who assisted with the collection of data for the National ALS Registry, and who structured the analytic data set prior to data analysis including Ms. Marchelle Sanchez, Dr. Oleg Muravov, and Judy Smith.
Funding Sources
This project was designed, implemented, and funded by the federal government of the United States. The funder provided support in the form of salaries for authors P.M., D.K.H., and D.W., and in the form of salary support for L.M.N., B.T., and T.W. via an interagency agreement with the Palo Alto Veterans Administration. L.M.N., T.W., B.T., P.M., W.K., and D.K.H. assisted with study design, data collection and analysis, and preparation of the manuscript. D.W. assisted with data interpretation and preparation of the manuscript. McKing Consulting Corporation provided support in the form of salary for author W.K., but did not have any additional role in the study design, data collection and analysis, decision to publish, or in the preparation of the manuscript.
Footnotes
Disclosure Statement
Dr. Paul Mehta, Dr. D. Kevin Horton, and Dr. David Williamson are employees of the federal government. Dr. Wendy Kaye is employed by McKing Consulting Corporation and is a paid contractor for the National ALS Registry. There are no patents, products in development, or marketed products to declare. There are no other competing interests for the submitted research.
Publisher's Disclaimer: Disclaimer
Publisher's Disclaimer: The findings and conclusions in this paper have not been formally disseminated by the ATSDR and should not be construed to represent any agency determination or policy.
References
- 1.US Public Health Service: ALS Registry Act. Washington, DC: 110th Congress. Public Law 2008;122(Stat 4047):110–373. [Google Scholar]
- 2.Mehta P, Antao V, Kaye W, Sanchez M, Williamson D, Bryan L, Muravov O, Horton K; Division of Toxicology and Human Health Sciences, Agency for Toxic Substances and Disease Registry, Atlanta, Georgia; Centers for Disease Control and Prevention (CDC): Prevalence of amyotrophic lateral sclerosis – United States, 2010–2011. MMWR Suppl 2014;63: 1–14. [PubMed] [Google Scholar]
- 3.Horton DK, Mehta P, Antao VC: Quantifying a nonnotifiable disease in the United States: The National Amyotrophic Lateral Sclerosis Registry model. JAMA 2014;312: 1097–1098. [DOI] [PMC free article] [PubMed] [Google Scholar]
- 4.Mehta P, Kaye W, Bryan L, Larson T, Copeland T, Wu J, Muravov O, Horton K: Prevalence of Amyotrophic Lateral Sclerosis – United States, 2012–2013. MMWR Surveill Summ 2016;65:1–12. [DOI] [PubMed] [Google Scholar]
- 5.Kaye WE, Sanchez M, Wu J: Feasibility of creating a National ALS Registry using administrative data in the United States. Amyotroph Lateral Scler Frontotemporal Degener 2014;15:433–439. [DOI] [PMC free article] [PubMed] [Google Scholar]
- 6.Wittes JT, Colton T, Sidel VW: Capture-recapture methods for assessing the completeness of case ascertainment when using multiple information sources. J Chronic Dis 1974;27:25–36. [DOI] [PubMed] [Google Scholar]
- 7.Hook EB, Regal RR: The value of capture-recapture methods even for apparent exhaustive surveys. The need for adjustment for source of ascertainment intersection in attempted complete prevalence studies. Am J Epidemiol 1992;135:1060–1067. [DOI] [PubMed] [Google Scholar]
- 8.Bishop YMM, Fienberg SE, Holland PW: Discrete Multivariate Analysis: Theory and Practice. Cambridge, MIT Press, 1975, pp 229–256. [Google Scholar]
- 9.Giminez O, Choquet R, Lamor L, Scofield P, Fletcher D, LeBreton JD, Pradel R: Efficient profile-likelihood confidence intervals for capture-recapture models. J Agri-cult Biolog and Env Statistics 2005;10:184–196. [Google Scholar]
- 10.Wagner L, Rechtman L, Jordan H, Ritsick M, Sanchez M, Sorenson E, Kaye W: State and metropolitan area-based amyotrophic lateral sclerosis (ALS) surveillance. Amyotroph Lateral Scler Frontotemporal Degener 2015;17: 128–134. [DOI] [PMC free article] [PubMed] [Google Scholar]
- 11.Freer C, Hylton T, Jordan HM, Kaye WE, Singh S, Huang Y: Results of Florida’s amyotrophic lateral sclerosis surveillance project, 2009–2011. BMJ Open 2015;5:e007359. [DOI] [PMC free article] [PubMed] [Google Scholar]
- 12.Jordan H, Fagliano J, Rechtman L, Lefkowitz D, Kaye W: Population-based surveillance of amyotrophic lateral sclerosis in New Jersey, 2009–2011. Neuroepidemiology 2014;43:49–56. [DOI] [PMC free article] [PubMed] [Google Scholar]
- 13.Rechtman L, Wagner L, Kaye W, Villanacci J: Updated prevalence and demographic characteristics for ALS cases in Texas, 2009–2011. South Med J 2015;108:483–486. [DOI] [PMC free article] [PubMed] [Google Scholar]
- 14.Logroscino G, Traynor BJ, Hardiman O, Chio’ A, Couratier P, Mitchell JD, Swingler RJ, Beghi E; EURALS: Descriptive epidemiology of amyotrophic lateral sclerosis: new evidence and unsolved issues. J Neurol Neurosurg Psychiatry 2008;79:6–11. [DOI] [PubMed] [Google Scholar]
- 15.Rooney JPK, Brayne C, Tobin K, Logroscino G, Glymour MM, Hardiman O: Benefits, pitfalls, and future design of population-based registers in neurodegenerative disease. Neurology 2017;88:2321–2329. [DOI] [PubMed] [Google Scholar]
- 16.Brooks BR: El Escorial World Federation of Neurology criteria for the diagnosis of amyotrophic lateral sclerosis. Subcommittee on Motor Neuron Diseases/Amyotrophic Lateral Sclerosis of the World Federation of Neurology Research Group on Neuromuscular Diseases and the El Escorial “Clinical limits of amyotrophic lateral sclerosis” workshop con tributors. J Neurol Sci 1994;124(suppl):96–107. [DOI] [PubMed] [Google Scholar]
- 17.Traynor BJ, Codd MB, Corr B, Forde C, Frost E, Hardiman O: Incidence and prevalence of ALS in Ireland, 1995–1997:a population-based study. Neurology 1999;52:504–509. [DOI] [PubMed] [Google Scholar]
- 18.Turabelidze G, Zhu BP, Schootman M, Malone JL, Horowitz S, Weidinger J, Williamson D, Simoes E: An epidemiologic investigation of amyotrophic lateral sclerosis in Jefferson County, Missouri, 1998–2002. Neurotoxicology 2008;29:81–86. [DOI] [PubMed] [Google Scholar]
- 19.21st Century Cures Act, Enacted by the 114th United States Congress in December 2016. An Act to Accelerate the Discovery, Development, and Delivery of 21st Century Cures, and for Other Purposes. Public Law 114–255. [Google Scholar]
Associated Data
This section collects any data citations, data availability statements, or supplementary materials included in this article.