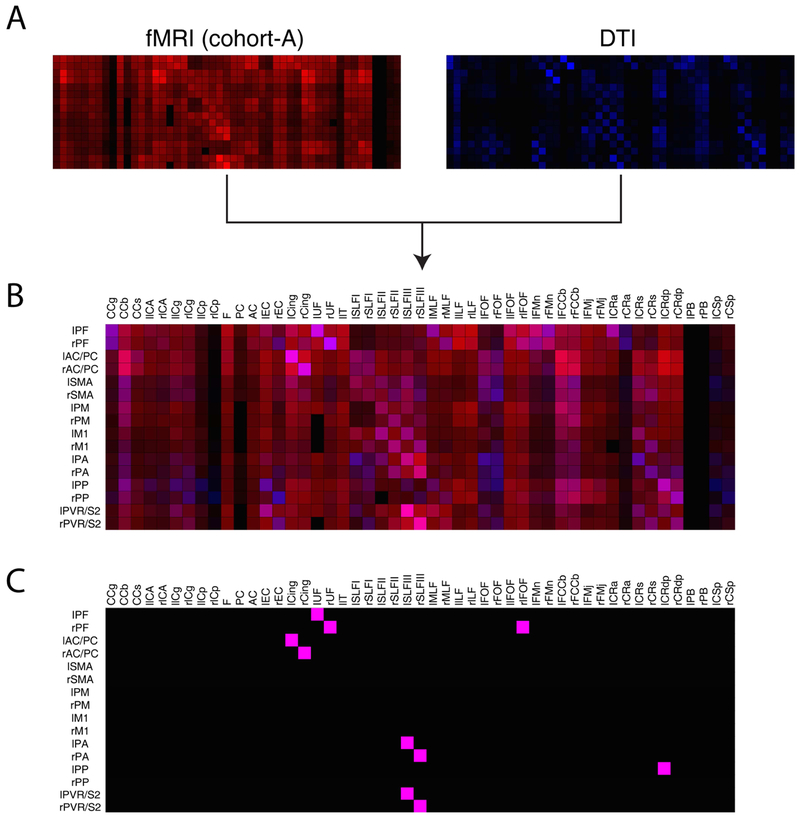
Figure 7:
Similarity comparison of rsfMRI with DTI connectivity of each individual GM-WM pair through RGB color overlay. (A) Normalized rsfMRI correlation (left) and DTI fiber count (right) matrices from Figure 2A-B are displayed as hues of red and blue respectively on a RGB scale. (B) Overlay of the red and blue connectivity matrices through additive color mixing. Maximal possible overlay would appear as the color of pure magenta with RGB elements of [1 0 1]. (C) Thresholded WM-GM pairs that exhibit highest degrees of similarity between the two modalities. Each WM-GM pair’s red and blue pigments were thresholded by their respective 95th percentile value; connectivity pair elements in (B) with both red and blue pigments greater than their respective thresholds are displayed as magenta voxels, and as black voxels otherwise.

