

Abstract
Walking on a split-belt treadmill (each of the two belts running at a different speed) has been proposed as an experimental paradigm to investigate the flexibility of the neural control of gait and as a form of therapeutic exercise. However, the scarcity of dynamic investigations challenges the validity of the available findings. The aim of the present study was to investigate the dynamic asymmetries of lower limbs of healthy adults during adaptation to gait on a split-belt treadmill. Ten healthy adults walked on a split-belt treadmill mounted on force sensors, with belts running either at the same speed (‘tied’ condition) or at different speeds (‘split’ condition, 0.4 vs. 0.8 or 0.8 vs. 1.2 m/s). The sagittal power and work provided by ankle, knee and hip joints, joint rotations, muscle lengthening, and surface electromyography were recorded simultaneously. Various tied/split walking sequences were requested. In the split condition a marked asymmetry between the parameters recorded from each of the two lower limbs, in particular from the ankle joint, was recorded. The work provided by the ankle (the main engine of body propulsion) was 4.8 and 2.2 times higher (in the 0.4 vs. 0.8, and 0.8 vs. 1.2 m/s conditions, respectively) compared with the slower side, and 1.2 and 1.1 times higher compared with the same speed in the tied condition. Compared with overground gait in hemiplegia, split gait entails an opposite spatial and dynamic asymmetry. The faster leg mimics the paretic limb temporally, but the unimpaired limb from the spatial and dynamic point of view. These differences challenge the proposed protocols of split gait as forms of therapeutic exercise.
Keywords: asymmetry, gait, joint power, muscle work, rehabilitation, split-belt treadmill
Introduction
More than a decade after a pioneering work by Dietz et al. (1994), thanks to an influential paper by Reisman et al. (2005), the scientific literature began to pay attention to the effects of walking on a split-belt treadmill (heretofore ‘split gait’). The instrument is composed of two independent belts that can run at different speeds. This imposes an asymmetrical gait, mimicking limping that has been observed in various pathologic conditions. Healthy individuals and stroke (Malone and Bastian, 2014), Parkinson’s (Fasano et al., 2016), and cerebellar (Morton and Bastian, 2006) patients were studied. In stroke patients, split gait has been tested widely as a form of therapeutic exercise. The rationale is based on the observation that in hemiparetic patients, the paretic (anterior) step is usually longer than the opposite step. In split gait, this asymmetry is emphasized by placing the paretic limb on the slower belt, although in various research protocols, the opposite arrangement was also tested (Morton and Bastian, 2006; Lauzière et al., 2014a, 2014b; Hoogkamer et al., 2015). When the belts are returned to the same speed, an after-effect occurs, entailing a more symmetric step length. In a unique paper, this was shown to last up to a month if repeated sessions are applied (Reisman et al., 2009). Some hypotheses were advanced on the differential control and storage of intralimb and interlimb parameters, the potential cerebellar localization of the corresponding neural circuits (Reisman et al., 2005; Morton and Bastian, 2006; Malone and Bastian, 2014; Hoogkamer et al., 2015), and the distorted perceptions of average single-limb speed during split gait (Malone and Bastian, 2010; Lauzière et al., 2014a, 2014b; Hoogkamer and O’Brien, 2016).
However, the absence of dynamic considerations challenges the validity of the above-cited neurologic speculations. It is well known that in most unilateral impairments kinematic symmetry is compatible with hidden dynamic asymmetries between the lower limbs and also between the energy changes of the body center of mass between subsequent steps (Cavagna et al., 1983a, 1983b; Tesio et al., 1998; Rota et al., 2016).
Although split-belt rehabilitation has been shown to be effective (Reisman, McLean, and Bastian, 2010; Reisman et al., 2013), to the authors’ knowledge only two research groups have reported that split gait may impose an asymmetric production of work from the lower limbs (Roemmich et al., 2012; Lauzière et al., 2014a, 2014b). In the current study, these preliminary observations were examined more systematically and the differential effects of split gait on lower limb kinematics and dynamics were clarified.
Participants and methods
Participants
A convenience sample of 10 healthy voluntary adults enrolled. The inclusion criteria were as follows: (i) ability to wittingly sign the informed consent form; (ii) ability to understand the instructions and to complete the locomotor task; (iii) age between 18 and 60 years; (iv) absence of neurologic or orthopedic conditions affecting gait. Patients were excluded if they had received surgical orthopedic interventions in the 18 months before the study, and had joint diseases (any forms of arthritis, joint laxity, joint replacement), symptomatic spine diseases, and previous experience of walking on split-belt treadmills. Participants were tested for their foot dominance by means of the Waterloo footedness questionnaire-revised (Elias et al., 1998).
Instruments and methods
Instruments and methods to record and analyze joint kinematics and dynamics, and surface electromyography (sEMG) during walking, have been described previously in detail (Tesio and Rota, 2008). Briefly, gait was analyzed using a split-belt force-sensorized treadmill (model ADAL 3D; Médical Développement, Andrézieux-Bouthéon, France) embedded in the floor. It consists of two parallel, independent half-treadmills, each mounted on four three-dimensional (3D) piezoelectric force sensors (KI 9048B; Kistler, Winterthur, Switzerland). Speeds up to 10 km/h can be regulated in 0.1 m/s steps. Force and belt speed signals were sampled at 250 Hz.
Joint kinematics was recorded through an optoelectronic method as per the Davis anthropometric model. The 3D displacement of the markers was captured using 10 near-infrared stroboscopic cameras (Smart-D optoelectronic system; BTS Bioengineering Spa, Milan, Italy, sampling rate 250 Hz), thus enabling the estimation of ankle, knee, and hip 3D excursions.
Through the spatiotemporal synchronization of ground reaction force vectors and the joint centers of rotation, the joint moment and power can be computed. In this work, kinematic and dynamic variables were analyzed only along the sagittal plane.
Four sEMG probes (FreeEMG; BTS Bioengineering Spa) were positioned, bilaterally, on the bellies of Tibialis Anterior (not shown in the present study), Gastrocnemius Lateralis (GaLat), Vastus Medialis, and Semi-Membranosus as per the SENIAM guidelines. Sample frequency was set at 1 kHz. The sEMG signals were off-line rectified (time constant: 0.08 s) and filtered (band pass Hamming filter: 10–450 Hz).
The length changes in GaLat, Rectus Femoris, and Semi-Membranosus were estimated from joint kinematics using an anthropometric model implemented in the SMART Software Suite (BTS Bioengineering Spa) and expressed as a percentage of the muscle length estimated at rest in the supine position.
General testing procedures
The participant had to wear a t-shirt, short pants, and light gym shoes. Once he/she was equipped, height and weight were measured. Then, the participant was instructed to stand quietly on the treadmill for about 15 s during calibration of the participant’s weight. Finally, the participant was allowed to adapt to walk on the treadmill for about 30 s (baseline), and then asked to walk in different gait conditions (adaptation). The participant was instructed not to look at her/his feet during walking, but toward a black spot (8 cm diameter) placed at about 2 m distance and 1.65 m height on a white wall in front of the treadmill. A researcher stood beside the participant. Neither handrails nor a suspension safety harness were deemed necessary at the tested speeds.
Dynamic parameters
Only the sagittal plane of motion was considered here. Joint power was computed as the product of joint torque and joint rotation speed (Tesio and Rota, 2008). As it is customary in physiology, power was defined as generated or positive when joint moment and rotation speed share the same direction (agonist muscles are contracting while shortening, thus providing ‘positive’ work), and as absorbed or negative otherwise. Positive work was computed as the integral of generated (positive) power over time (Tesio et al., 2017a, 2017b).
Tagging gait patterns
In the context of this paper, gait modality refers to walking on belts running either at the same speed (tied modality) or at different speeds (split modality). Gait condition indicates a specific combination of speeds of each belt. A four-number tag without decimals was assigned to each combination of walking speed and belt speed asymmetry. The first two numbers referred to the speed of the belt running under the nondominant limb. The next two numbers referred to the speed of the other belt. For example, the tag 0408 labeled a walking trial where the belt under the nondominant and the dominant lower limbs ran at 0.4/ms and 0.8 m/s, respectively (split modality, 0408 condition).
Sequence and timing of gait conditions
Table 1 shows the experimental timeline.
Table 1.
Experimental sequence and timing of gait conditions

During the baseline phase, the participant was asked to walk with treadmill belts tied from 0.2 to 1.2 m/s at increasing speeds (in 0.2 m/s steps). Speed increases were applied every 30 s after a verbal warning. Changes in the average belt speed were completed gradually in 3–5 s. After a 2 min pause, the first adaptation phase began. This included a tied condition, a split condition, and a postsplit tied condition. Participants walked 30 s at 0404. Then, they had to walk for 3 min at 0408, i.e. with the dominant lower limb on the faster belt, and again for 30 s at 0404. After another 2 min pause, the tied-split-tied sequence was repeated at higher speeds (0808, 0812, and 0808, respectively).
Definitions and computations of variables
Spatiotemporal gait parameters
Step: the ensemble of kinematic, dynamic, and electrophysiological events taking place between two subsequent foot–ground contacts. Foot–ground contact phases were determined from vertical ground reactions equal to or exceeding 30 N (threshold above the background noise) (Tesio and Rota, 2008).
Side of step: the side of the posterior foot during double stance.
Step length: the sagittal distance between the reflective markers placed on the lateral malleolus of the posterior and the anterior foot at the ground strike of the anterior foot.
Step time: the time duration of the step.
Stride length, unilateral: the sagittal distance covered by the external malleolus of one side between two subsequent foot–ground contacts of the same foot. This quantity is the same on both sides in the tied modality, but not in the split modality.
Stride length in split modality: the sum of the length of two subsequent steps, or, alternatively, the average length between the unilateral strides of the left and the right side.
Single-stance time: for each lower limb, the time interval during which the limb determines vertical ground reactions equal to or exceeding 30 N.
Swing time: for each lower limb, the time interval during which vertical ground reactions are lower than 30 N.
Double-stance time: the time interval during which under each of the lower limbs vertical ground reactions equal or exceed 30 N.
Total stance time: for each lower limb, the time interval during which vertical ground reactions under each foot equal or exceed 30 N.
Side of the double-stance phase: the side of the posterior foot.
It must be kept in mind that here, both the sides of the step and of the double-stance phase were named after the posterior foot during double foot–ground contact. This has the advantage of linking spatiotemporal parameters to joint dynamics, that is, the step length and duration to the body propulsion, which is mostly provided by the posterior leg during double stance (Tesio et al., 2017a, 2017b).
Data analysis
Strides in the first 10 s after completion of each speed change were not considered, in order to neglect the transition phase. In the split modality, within the next 20 strides, a sequence of six subsequent strides was selected for further analysis. Therefore, only the early phase of adaptation was considered here.
All signals were synchronized and off-line analyzed using algorithms available within the SMART Software Suite. Stride time was normalized to 100 time points. Results were averaged across six subsequent strides for each participant, and then grand-averaged across participants. Further computations, statistics, and graphic representation were performed using MATLAB (version 8; MathWorks Inc., Natick, Massachusetts, USA), STATA (version 14.0; STATA Corp., College Station, Texas, USA), and SigmaPlot software (version 12.0; Systat software Inc., San Jose, California, USA).
Statistics
A sample size of 10 was considered to be sufficient for a reliable estimate of all the recorded parameters, given the very high reproducibility allowed within participants across subsequent steps. Reproducibility is fostered by the known and constant average speed imposed by the treadmill, as confirmed by previous articles (Tesio and Rota, 2008, 2017a, 2017b).
The Shapiro–Wilk’s test was used to assess the normality of the distribution of spatiotemporal, kinematic, and dynamic variables. Descriptive summaries were given as ranges (for age, only), and mean (SD). All variables were compared between the two sides using a paired Student’s t-test or a non-parametric Wilcoxon signed-rank test in case of non-normality. For each of the continuous variables analyzed the dominant/non-dominant side ratio (linearized through log-odd transformation; Cavagna et al., 1983) was computed. The faster/slower side ratios in the split modality with the dominant/non-dominant side ratio in the tied modality were compared using a repeated analysis of variance (ANOVA) model (non-parametric Friedman ANOVA in case of non-normality). The contrasted tied modality was the one in which speed (a) matched either the faster or the slower speed between the split belts, or (b) was the average between the two belt speeds. In case of significant ANOVA models, Tukey’s (or the Wilcoxon signed-rank test in case of non-normality) post-hoc tests were run on contrasts between pairs of conditions. Also, the difference in side log-ratios was tested between the two split conditions (i.e. 0408 vs. 0812).
Significance was set at P less than 0.05. The Benjamini–Hochberg ‘false discovery rate’ correction for multiplicity was adopted (Benjamini and Hochberg, 1995) whenever appropriate.
The time courses of limb joint angles and power, muscle length, and sEMG signals were shown as mean values within each of 100 time bins. For graphic clarity, confidence bands were not provided. It was shown previously that these are of very moderate amplitude and almost superimposable to those found in ground walking at the same speed (Tesio and Rota, 2008; Tesio et al., 2017a, 2017b).
Ethics
All participants provided written consent before participation. The study was approved by the local ethic committee of this Institution.
Results
Demographic and anthropometric information of the participants enrolled in the present study is presented in Table 2.
Table 2.
Demographic characteristics of the 10 participants

Figure 1 graphically represents the mean values of the various spatiotemporal gait parameters as a function of the belt speed combinations. Numeric values [mean (SD)] are shown in Table 3.
Fig. 1.

Spatiotemporal gait parameters. From top to bottom, the panels show the spatiotemporal gait parameters indicated by the labels (ss TIME: single-stance time, ds TIME: double-stance time, ts TIME: total stance time). Pairs of bars are provided for each combination of belt speeds, given on the abscissa. The bars show the grand-mean (SD) across six subsequent strides performed by 10 participants for each parameter. The gray and black bars refer to the nondominant and the dominant side, respectively, in tied conditions. The white and the dashed bars refer to the same sides, becoming the slower and the faster sides in split conditions. *Statistically significant pairwise comparisons between lower limb sides on a same gait condition.  Statistically significant comparisons of faster/slower side ratios (linearized through log-odd transformation) in the split conditions with respect to the dominant/nondominant side ratios in the tied conditions (i.e. 0408 vs. 0404, 0606, and 0808; and 0812 vs. 0808, 1010, and 1212), and between the two split conditions (i.e. 0408 vs. 0812).
Table 3.
Spatiotemporal gait parameters across six subsequent strides performed by 10 healthy participants walking on the split-belt treadmill at different gait modalities and speed conditions

Results show that:
Under tied conditions no significant differences emerged between steps on opposite sides.
For all parameters, as expected, a difference between sides could be detected in both split conditions (i.e. 0408 and 0812), except for the double-stance time (side named after the posterior foot) in the 0812 split condition.
The split conditions implied that, on the faster side, step length (side named after the posterior foot) and swing time were longer, whereas single-stance and double-stance (hence, total stance) time were shorter compared with the slower side.
For all parameters, the faster/slower side ratios (log-transformed; see Participants and methods section) were statistically different between the two split conditions (i.e. 0408 vs. 0812) (Table 4).
The faster/slower side ratio of step length, single-stance time, total stance time, and swing time showed significant differences in all the comparisons between gait conditions. Significance was missed only for the 0812/1010 comparison of step length (Tables 6 and 7).
For all spatiotemporal parameters the asymmetries were larger in the 0408, compared with the 0812, split condition, that is, when the faster/slower side ratio was larger.
Table 4.
Results from the repeated analysis of variance model between faster/slower side ratios (linearized through log-odd transformation) in the two split conditions (i.e. 0408 vs. 0812)

Table 6.
Results from the repeated analysis of variance model (Friedman analysis of variance in case of non-normality) among faster/slower side ratios (linearized through log-odd transformation) in the 0408 split condition with dominant/nondominant side ratios in the 0404, 0606, and 0808 tied conditions

Table 7.
Results from the repeated analysis of variance model (Friedman analysis of variance in case of non-normality) among faster/slower side ratios (linearized through log-odd transformation) in the 0812 split condition with dominant/nondominant side ratios in the 0808, 1010, and 1212 tied conditions

Figure 2 shows the kinematic, dynamic, and sEMG changes during a stride in the 0408 split condition and in tied conditions (0404, 0606, and 0808, respectively). Results show that the values of all parameters are barely distinguishable between the two sides in the tied conditions.
Fig. 2.

Kinematic, dynamic, and surface electromyography (sEMG) changes in joint parameters (on the ordinate) as a function of normalized stride time (on the abscissa, absolute mean duration within brackets) during walking on the force treadmill with belts running at 0.4 and 0.8 m/s (0408 split condition, upper panel on the left), with both belts tied at 0.4 m/s (0404 tied condition, upper panel on the right), at 0.6 m/s (0606 tied condition, lower panel on the left), and at 0.8 m/s (0808 tied condition, lower panel on the right). In each panel, the labels above the uppermost panel indicate the joint (ankle, knee, and hip from left to right, respectively) and the muscle (within brackets) analyzed in each column. From top to bottom, the rows show the joint sagittal rotations, the changes in muscle length, the joint sagittal power and the sEMG signal. The curves show the grand-mean of data recorded from six subsequent strides performed by 10 healthy adults. The horizontal bottom bars show the single-stance (dashed or filled background) and the double-stance (white background) time. The ‘whiskers’ show the total stance time SD. The dashed lines and bar segments show the dominant (fast in split gait) lower limb; the continuous lines and the filled bar segments show the nondominant (slow in split gait) lower limb.
As expected (Tesio et al., 2017a, 2017b), ankle plantar flexors provided most of the propulsive power required during the stride. More precisely, this occurred just before and during the double stance of the corresponding step. A speed-dependent increase in the amplitude of kinematic, dynamic and sEMG values, and a decrease in ground contact time and relative phase duration were also evidenced.
The effect of split gait can be appreciated by comparing the split condition 0408 with the tied conditions. Shifting from the tied to the split condition induced a marked asymmetry between the parameters recorded from each of the two lower limbs, in particular, from the ankle joint (Fig. 2, leftmost columns of each panel).
On the faster belt, the ankle rotation (negative values indicate plantar flexed position) ranged from −12.7° to 11.8° versus 0.0° to 14.4° for the slower side. These ranges were superimposable to those found at the corresponding speeds in tied conditions: −8.2° to 14.6° and −4.1° to 13.7° in 0808 and 0404 conditions, respectively. On the slower side, by contrast, the ankle never reached a plantar flexed position. Joint excursions were paralleled by changes in the elongation of the GaLat muscle (second row from the top in each panel).
The ankle joint on the faster belt provided a much higher and earlier peak of plantar flexor power compared with the opposite joint and with an earlier onset. Ankle power was generated from 31 to 84% of the gait cycle on the faster belt versus 59 to 86% of the slower belt. Remarkably, ankle joint peak power on the faster belt was intermediate between that recorded in the corresponding 0808 tied condition [1.51 (0.24) vs. 1.78 (0.45) W/kg] and that recorded in the 0606 tied condition [1.24 (0.23) W/kg] (Fig. 2).
In the latter condition, both lower limbs were moving at 0.6 m/s, the average speed between the two belts. Similar effects of the split gait modality were found from the sEMG tracings (fourth panel from top). On the slower side, peak sEMG from GaLat was equal to 29.64 (10.17) µV and lower than that recorded in the 0404 tied condition [38.95 (20.36) µV]. On the faster side, peak sEMG from GaLat was equal to 75.78 (39.65) µV and greater than that recorded both in the 0606 [60.92 (31.41) µV] and the 0808 [58.64 (25.99) µV] conditions.
Interestingly, on both sides the generation of power was preceded by a phase of power absorption. On the faster side, the negative power reached a higher peak, appeared earlier, and had a lower duration compared with the slower side. This was paralleled by the larger lengthening–shortening cycle of the plantar flexor muscles and by an sEMG signal of higher amplitude and duration.
In Fig. 2 in each panel, the second and the third columns from left replicate the information given for the ankle with respect to knee and hip joints, respectively. It can be seen that the split gait modality entailed much smaller asymmetries, compared with the ankle joint, for all the recorded parameters. In particular, the amplitude of the power and sEMG signals was very small, as was the case for the tied modalities investigated.
All of the above considerations also apply to the 0812 split condition and to its comparison with the tied conditions replicating the speed of either belt (here, the 0808 and 1212 conditions), or in their average speed (here, the 1010 condition). For ankle joint rotation, Fig. 3 shows that the lower limb on the fast belt had a joint rotation range equal to 27.7° (5.7°), similar to that of the lower limbs moving with both belts tied at 1.2 m/s [24.8° (3.2°)], whereas the ankle joint on the slow belt had a rotation equal to 17.5° (2.7)°, resembling that of the lower limbs moving with both belts tied at slow speed [20.5° (3.4°)].
Fig. 3.

Kinematic, dynamic, and sEMG changes during walking on the force treadmill with split belts running at 0.8 and 1.2 m/s (0812 split condition, upper panel on the left), with both belts tied at 1.0 m/s (1010 tied condition, lower panel on the left), and with both belts tied at 1.2 m/s (1212 tied condition, lower panel on the right). Other information as in Fig. 2.
Peak power generated from the fast lower limb was greater than that from the slow lower limb [2.9 (0.3) vs. 1.9 (0.6) W/kg]. Moreover, it was lower than that generated in the 1212 tied condition [3.3 (0.5) W/kg], whereas it was more similar to that generated in the 1010 tied condition [2.6 (0.3) W/kg]. In the 0812 split condition, the ankle joint power generation lasted from 31 to 85% of the gait cycle of the fast lower limb and from 52 to 88% of the gait cycle of the slow lower limb.
It is worth noting that higher asymmetries were observed in the 0408 compared with the 0812 split condition. Analogous to the case of spatiotemporal parameters (Fig. 1), the faster/lower speed ratio (here, 2 : 1 vs. 1.5 : 1) between the two belts seemed more effective than speed difference in causing dynamic asymmetries.
In Fig. 4, a 3D representation of the ankle joint power as a function of normalized stride time and of gait conditions is reported.
Fig. 4.
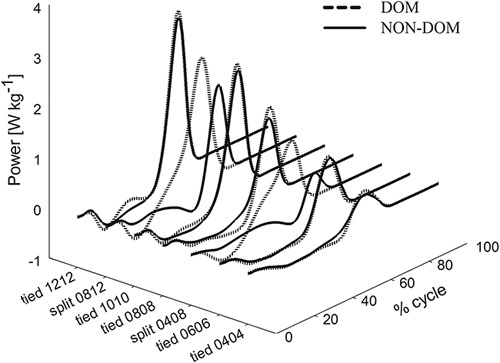
Ankle power in the sagittal plane (ordinate) as a function of both the standardized stride time (right abscissa) and the belt speed combinations (gait conditions, left abscissa). The dashed and the continuous lines show the dominant (DOM) and nondominant (NON-DOM) side, respectively, becoming the faster and the slower side in the split gait modality, respectively.
This form of representation makes it evident that on the faster belt (dominant lower limb, dashed curves), power was generated in an earlier phase and for a longer relative duration compared with both the slower side and the tied conditions.
A summary of dynamic findings is shown in Fig. 5. Numeric values [mean (SD)] are shown in Table 5. The figure highlights and complements the pattern shown in Fig. 4, contributing quantitative evidence.
Fig. 5.

Dynamic gait parameters. From top to bottom, the panels refer to the dynamic gait parameters of ankle, knee, and hip joints. The left and right columns show the peak positive power and positive work, respectively. Note the different graphic scaling for the ankle compared with both the knee and the hip. Other indications as in Fig. 1.
Table 5.
Dynamic gait parameters across six subsequent strides performed by 10 healthy participants walking on the split-belt treadmill at different gait modalities and speed conditions

As expected, higher values of peak power were observed with increasing average speeds. The ankle provided a peak power 5.56 and 2.80 times higher compared with knee and hip, respectively, in tied conditions, in agreement with a previous study (Tesio et al., 2017a, 2017b). Both interlimb asymmetries and an interaction with belt speed combinations emerged.
Interlimb asymmetries
In the split conditions a higher peak power was provided at ankle and knee joints on the faster side compared with the slower side. Significance was missed for the knee (both 0408 and 0812 conditions).
The split conditions implied a faster/slower side ratio of ankle peak power greater than the dominant/non-dominant ratios in tied conditions (Tables 6 and 7).
At the ankle, only, split gait entailed greater asymmetries for work than for power (P=0.01 for both split conditions; compare left and right upper panels of Fig. 5). This is consistent with the greater, anticipated, and prolonged power generation on the faster side (Figs 2 and 3).
Differences between gait modalities
Compared with the corresponding average tied speeds (i.e. 0606 vs. 0408 condition, and 1010 vs. 0812 condition), power and work were higher on the faster side and lower on the slower side (upper most row histograms in Fig. 5, also see Figs 2 and 3).
With respect to the corresponding tied speeds, peak power was lower on the faster side (0408 vs. 0808) and unchanged on the slower side (0408 vs. 0404).
At variance with power, work was lower for the slower side and higher for the faster side.
Discussion
From the current study split gait emerges as a unique paradigm of locomotion, not amenable to the familiar form of pathologic claudication known as escape limp. In a limping gait on a firm ground the affected leg ‘escapes’ from load, whereas in split gait the faster leg ‘escapes’ from being dragged backwards with respect to the slower leg. This effort requires an extra muscular work. In this effort muscle properties seem to be of some help. During human walking elastic energy is stored in the calf muscle–tendon complex during ankle dorsal flexion and released during the subsequent shortening (Zelik et al., 2014). This mechanism is stronger the faster the gait speed. The hypothesis of an effective elastic loading of the ankle on the faster side is consistent with the negative power phase, the muscle lengthening, and the sEMG tracings shown in Figs 2 and 3.
In short, the split-belt treadmill induced mechanical asymmetries in healthy individuals between the subsequent steps that mimic the natural-pathologic escape limp only in its temporal step parameters, but neither for the spatial or for the dynamic ones which are the focus of the present study.
The present results are consistent with published kinematic (Reisman et al., 2005) and dynamic data (Roemmich et al., 2012; Lauzière et al., 2014a, 2014b). However, the latter were limited to one belts’ speed combination, to plantar flexor moments during post-adaptation (thus neglecting knee and hip dynamics) (Roemmich et al., 2012; Lauzière et al., 2014a, 2014b), or did not provide information on joint rotations and EMG signals (Roemmich et al., 2012). As a key point, the present results suggest that a partial shift in perspective may help to clarify the potential of the split-belt paradigm as a research and rehabilitation tool. The aim of the adaptive behavior in split gait can be simplified to keep the body system at a forward average speed between those of the two belts. The main mechanism consists in the fine tuning of the main source of body propulsion, that is, the plantarflexion power and work. It is known that the pool of plantar flexor muscles provides more than 65% of the power needed to keep the body system in motion (Meinders et al., 1998; Zelik et al., 2014). This power is provided by the posterior limb during push-off (mostly overlapping with the double-stance phase) (Tesio et al., 1998). In split gait, however, there is more than a simple replication of the ankle power and work output provided on each side at the corresponding speed in tied modality (e.g. when in the 0408 condition, the same power provided in the 0404 and 0808 conditions, respectively). The timecourse of power and work is tailored to the split modality, mostly on the faster side. The published inferences on the neural substrate of adaptation should probably be simplified. All kinematic changes may be seen as the consequence of this necessary dynamic adaptation, not as a primary goal of the adaptive behavior. Dynamic symmetry implies a kinematic one, whereas the reverse is not necessarily true (Cavagna et al., 1983a, 1983b; Tesio et al., 1998; Rota et al., 2016). Step length mostly arises from limb swing, whereas propulsive power is mostly generated during double stance when minor joint rotations occur. This may make the clinical assessment of gait asymmetries difficult on visual inspection alone. This notwithstanding, one should not ignore the fact that dynamic symmetry, reflecting an intrinsic, not an adaptive recovery, is a more relevant goal for rehabilitation. Split gait is a favorable form of rehabilitation exercise as long as it forces dynamic symmetry by assigning the faster belt to the affected or to the unaffected lower limb, depending on the search for adaptation or postadaptation effects, respectively (a still open matter). In either case, however, it cannot be overemphasized that opposite changes occur on spatiotemporal gait parameters.
Some limitations of this study must be highlighted. First, age was very homogenous across participants (it ranged from 22 to 30 years). Caution must be exercised when extrapolating results to either children or older patients. With respect to adults, quite surprisingly, data are missing for the age range 40–60 years (Herssens et al., 2018). The available literature suggests, in any case, that relevant dynamic differences are expected neither with respect to healthy children older than 5 years of age nor with respect to older adults, once the speed is adjusted for size in the former (Cavagna et al., 1983a, 1983b), and the same absolute speed (not the preferred one) is compared across the latter (Tesio et al., 1991). Second, a speed difference between the two belts greater than 0.4 m/s and a speed ratio greater than 2 : 1 have not been taken into consideration. Third, neither the whole timecourse of adaptation nor the postadaptation phases were analyzed. Step length tends to approach symmetry during late (e.g. >10 min) adaptation (Reisman et al., 2005) whereas in the present study, only the early phase (<3 min) was considered. The dynamic perspective claimed for in this work, however, predicts that plantar flexor power should remain asymmetric nonetheless to cope with the persisting asymmetry of belt speed.
All of these limitations seem to represent valuable targets for the next research agenda on the mechanics of split gait.
Acknowledgements
This research was funded by Istituto Auxologico Italiano, IRCCS, STRAnGe project, ‘Ricerca Corrente 2018’.
Conflicts of interest
There are no conflicts of interest.
References
- Benjamini Y, Hochberg Y. (1995). Controlling the false discovery rate: a practical and powerful approach to multiple testing. J R Stat Soc Series B Methodol 57:289–300. [Google Scholar]
- Cavagna GA, Franzetti P, Fuchimoto T. (1983a). The mechanics of walking in children. J Physiol 343:323–339. [DOI] [PMC free article] [PubMed] [Google Scholar]
- Cavagna GA, Tesio L, Fuchimoto T, Heglund NC. (1983b). Ergometric evaluation of pathological gait. J Appl Physiol 55:607–613. [DOI] [PubMed] [Google Scholar]
- Dietz V, Zijlstra W, Duysens J. (1994). Human neuronal interlimb coordination during split-belt locomotion. Exp Brain Res 101:513–520. [DOI] [PubMed] [Google Scholar]
- Elias LJ, Bryden MP, Bulman-Fleming MB. (1998). Footedness is a better predictor than is handedness of emotional lateralization. Neuropsychologia 36:37–43. [DOI] [PubMed] [Google Scholar]
- Fasano A, Schlenstedt C, Herzog J, Plotnik M, Rose FEM, Volkmann J, Deuschl G. (2016). Split-belt locomotion in Parkinson’s disease links asymmetry, dyscoordination and sequence effect. Gait Posture 48:6–12. [DOI] [PubMed] [Google Scholar]
- Herssens N, Verbecque E, Hallemans A, Vereeck L, Van Rompaey V, Saeys W. (2018). Do spatiotemporal parameters and gait variability differ across the lifespan of healthy adults? A systematic review. Gait Posture 64:181–190. [DOI] [PubMed] [Google Scholar]
- Hoogkamer W, O’Brien MK. (2016). Sensorimotor recalibration during split-belt walking: task-specific and multisensory? J Neurophysiol 116:1539–1541. [DOI] [PMC free article] [PubMed] [Google Scholar]
- Hoogkamer W, Bruijn SM, Sunaert S, Swinnen SP, Van Calenbergh F, Duysens J. (2015). Adaptation and aftereffects of split-belt walking in cerebellar lesion patients. J Neurophysiol 114:1693–1704. [DOI] [PMC free article] [PubMed] [Google Scholar]
- Lauzière S, Mièville C, Betschart M, Duclos C, Aissaoui R, Nadeau S. (2014a). Plantarflexion moment is a contributor to step length after-effect following walking on a split-belt treadmill in individuals with stroke and healthy individuals. J Rehabil Med 46:849–857. [DOI] [PubMed] [Google Scholar]
- Lauzière S, Miéville C, Duclos C, Aissaoui R, Nadeau S. (2014b). Perception threshold of locomotor symmetry while walking on a split-belt treadmill in healthy elderly individuals. Percept Mot Skills 118:475–490. [DOI] [PubMed] [Google Scholar]
- Malone LA, Bastian AJ. (2010). Thinking about walking: effects of conscious correction versus distraction on locomotor adaptation. J Neurophysiol 103:1954–1962. [DOI] [PMC free article] [PubMed] [Google Scholar]
- Malone LA, Bastian AJ. (2014). Spatial and temporal asymmetries in gait predict split-belt adaptation behavior in stroke. Neurorehabil Neural Repair 28:230–240. [DOI] [PMC free article] [PubMed] [Google Scholar]
- Meinders M, Gitter A, Czerniecki JM. (1998). The role of ankle plantar flexor muscle work during walking. Scand J Rehabil Med 30:39–46. [DOI] [PubMed] [Google Scholar]
- Morton SM, Bastian AJ. (2006). Cerebellar contributions to locomotor adaptations during splitbelt treadmill walking. J Neurosci 26:9107–9116. [DOI] [PMC free article] [PubMed] [Google Scholar]
- Reisman DS, Block HJ, Bastian AJ. (2005). Interlimb coordination during locomotion: what can be adapted and stored? J Neurophysiol 94:2403–2415. [DOI] [PubMed] [Google Scholar]
- Reisman DS, Wityk R, Silver K, Bastian AJ. (2009). Split-belt treadmill adaptation transfers to overground walking in persons poststroke. Neurorehabil Neural Repair 23:735–744. [DOI] [PMC free article] [PubMed] [Google Scholar]
- Reisman DS, McLean H, Bastian AJ. (2010). Split-belt treadmill training poststroke: a case study. J Neurol Phys Ther 34:202–207. [DOI] [PMC free article] [PubMed] [Google Scholar]
- Roemmich RT, Stegemöller EL, Hass CJ. (2012). Lower extremity sagittal joint moment production during split-belt treadmill walking. J Biomech 45:2817–2821. [DOI] [PMC free article] [PubMed] [Google Scholar]
- Reisman DS, McLean H, Keller J, Danks KA, Bastian AJ. (2013). Repeated split-belt treadmill training improves poststroke step length asymmetry. Neurorehabil Neural Repair 27:460–468. [DOI] [PMC free article] [PubMed] [Google Scholar]
- Rota V, Benedetti MG, Okita Y, Manfrini M, Tesio L. (2016). Knee rotationplasty: motion of the body centre of mass during walking. Int J Rehabil Res 39:346–353. [DOI] [PMC free article] [PubMed] [Google Scholar]
- Tesio L, Rota V. (2008). Gait analysis on split-belt force treadmills: validation of an instrument. Am J Phys Med Rehabil 87:515–526. [DOI] [PubMed] [Google Scholar]
- Tesio L, Roi GS, Möller F. (1991). Pathological gaits: inefficiency is not a rule. Clin Biomech (Bristol, Avon) 6:47–50. [DOI] [PubMed] [Google Scholar]
- Tesio L, Lanzi D, Detrembleur C. (1998). The 3-D motion of the centre of gravity of the human body during level walking. II. Lower limb amputees. Clin Biomech (Bristol, Avon) 13:83–90. [DOI] [PubMed] [Google Scholar]
- Tesio L, Malloggi C, Portinaro NM, Catino L, Lovecchio N, Rota V. (2017a). Gait analysis on force treadmill in children: comparison with results from ground-based force platforms. Int J Rehabil Res 40:315–324. [DOI] [PMC free article] [PubMed] [Google Scholar]
- Tesio L, Rota V, Malloggi C, Brugliera L, Catino L. (2017b). Crouch gait can be an effective form of forced-use/no constraint exercise for the paretic lower limb in stroke. Int J Rehabil Res 40:254–267. [DOI] [PMC free article] [PubMed] [Google Scholar]
- Zelik KE, Huang TWP, Adamczyk PG, Kuo AD. (2014). The role of series ankle elasticity in bipedal walking. J Theor Biol 346:75–85. [DOI] [PMC free article] [PubMed] [Google Scholar]